We use cookies to enhance the usability of our website. If you continue, we'll assume that you are happy to receive all cookies. More information. Don't show this again.
RNA category is based on mRNA expression levels in the analyzed samples (RNA assay description). The categories include: tissue/cell line enriched, group enriched, tissue/cell line enhanced, expressed in all, mixed and not detected. RNA category is calculated separately for The Cancer Genome Atlas (TCGA) data from cancer tissues and internally generated Human Protein Atlas (HPA) data from normal tissues and cell lines.
TCGA (cancer tissue):
Expressed in all
HPA (cell line):
Cell line enhanced (AN3-CA, BEWO, HAP1, NTERA-2)
HPA (normal tissue):
Mixed
Protein evidencei
Protein evidence scores are generated from several independent sources and are classified as evidence at i) protein level, ii) transcript level, iii) no evidence, or iv) not available.
Evidence at protein level
Protein expression normal tissuei
A summary of the overall protein expression pattern across the analyzed normal tissues. The summary is based on knowledge-based annotation.
"Estimation of protein expression could not be performed. View primary data." is shown for genes analyzed with a knowledge-based approach where available RNA-seq and gene/protein characterization data has been evaluated as not sufficient in combination with immunohistochemistry data to yield a reliable estimation of the protein expression profile.
Standardized explanatory sentences with additional information required for full understanding of the knowledge-based expression profile.
Antibody staining mainly not consistent with RNA expression data.
Reliability score - normal tissuesi
Reliability score (score description), divided into Enhanced, Supported, Approved, or Uncertain, is evaluated in normal tissues and based on consistency between antibody staining pattern, available RNA-Seq and gene/protein characterization data, as well as similarity between independent antibodies targeting the same protein.
Kaplan-Meier plots for all cancers where high expression of this gene has significant (p<0.001) association with patient survival are shown in this summary. Whether the prognosis is favourable or unfavourable is indicated in brackets. Each Kaplan-Meier plot is clickable and redirects to a detailed page that includes individual expression and survival data for patients with the selected cancer.
RNA expression overview shows RNA-seq data from The Cancer Genome Atlas (TCGA).
TCGA dataseti
RNA-seq data in 17 cancer types are reported as median FPKM (number Fragments Per Kilobase of exon per Million reads), generated by the The Cancer Genome Atlas (TCGA). RNA cancer tissue category is calculated based on mRNA expression levels across all 17 cancer tissues and include: cancer tissue enriched, cancer group enriched, cancer tissue enhanced, expressed in all, mixed and not detected. To access cancer specific RNA and prognostic data, click on the cancer name. The cancer types are color-coded according to which type of normal organ the cancer originates from.
Antibody staining in 20 different cancers is summarized by a selection of four standard cancer tissue samples representative of the overall staining pattern. From left: colorectal cancer, breast cancer, prostate cancer and lung cancer. An additional fifth image can be added as a complement. The assay and annotation is described here. Note that samples used for immunohistochemistry by the Human Protein Atlas do not correspond to samples in the TCGA dataset.
For each cancer, color-coded bars indicate the percentage of patients (maximum 12 patients) with high and medium protein expression level. The cancer types are color-coded according to which type of normal organ the cancer originates from. Low or not detected protein expression results in a white bar. Mouse-over function shows details about expression level and normal tissue of origin. The images and annotations can be accessed by clicking on the cancer name or protein expression bar. If more than one antibody is analyzed, the tabs at the top of the staining summary section can be used to toggle between the different antibodies.
A few cases of non-Hodgkins lymphomas and duct carcinomas of breast displayed moderate to strong cytoplasmic positivity. Remaining malignant tissues were negative.
Skin cancers as well as several cases of cervical, lung, urothelial and liver cancers displayed moderate to strong immunoreactivity. Remaining cancer tissues were in general negative.
GENE INFORMATIONi
Gene information from Ensembl and Entrez, as well as links to available gene identifiers are displayed here. Information was retrieved from Ensembl if not indicated otherwise.
The protein encoded by this gene is a member of the fibroblast growth factor receptor family, where amino acid sequence is highly conserved between members and throughout evolution. FGFR family members differ from one another in their ligand affinities and tissue distribution. A full-length representative protein consists of an extracellular region, composed of three immunoglobulin-like domains, a single hydrophobic membrane-spanning segment and a cytoplasmic tyrosine kinase domain. The extracellular portion of the protein interacts with fibroblast growth factors, setting in motion a cascade of downstream signals, ultimately influencing mitogenesis and differentiation. This particular family member is a high-affinity receptor for acidic, basic and/or keratinocyte growth factor, depending on the isoform. Mutations in this gene are associated with Crouzon syndrome, Pfeiffer syndrome, Craniosynostosis, Apert syndrome, Jackson-Weiss syndrome, Beare-Stevenson cutis gyrata syndrome, Saethre-Chotzen syndrome, and syndromic craniosynostosis. Multiple alternatively spliced transcript variants encoding different isoforms have been noted for this gene. [provided by RefSeq, Jan 2009]
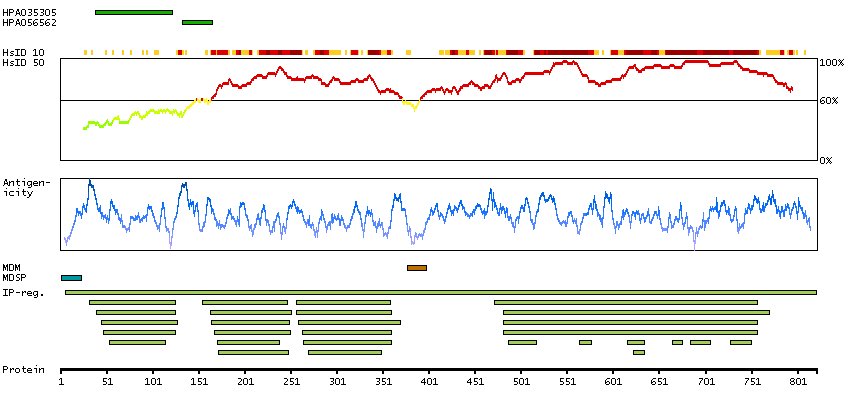
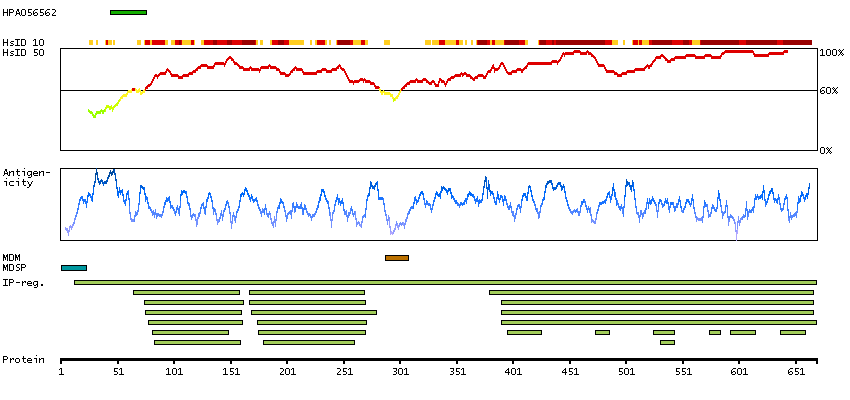
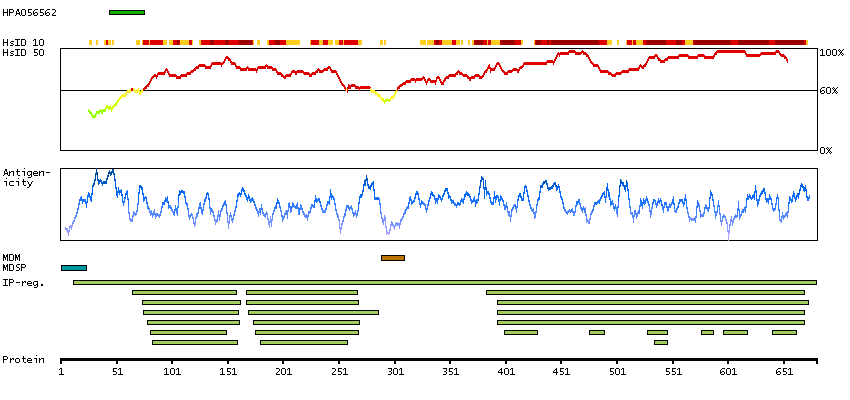
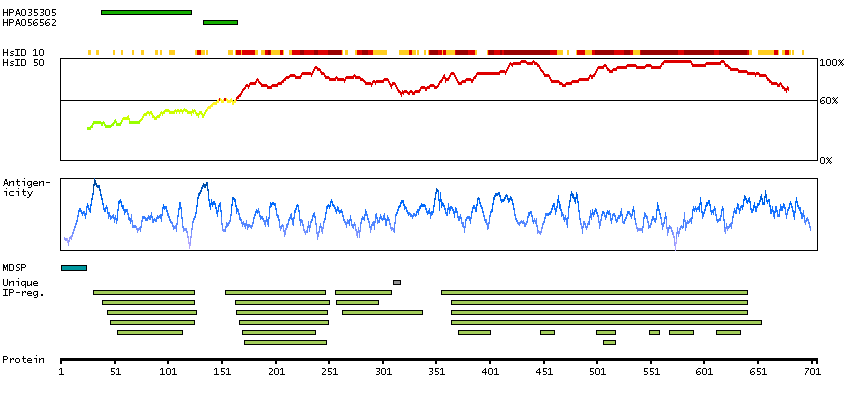
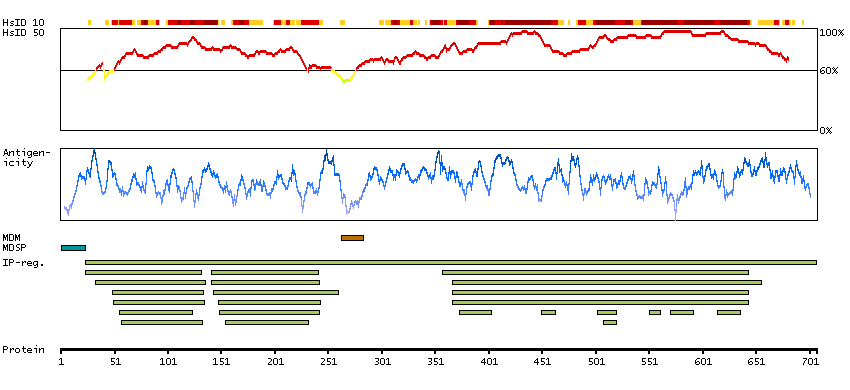
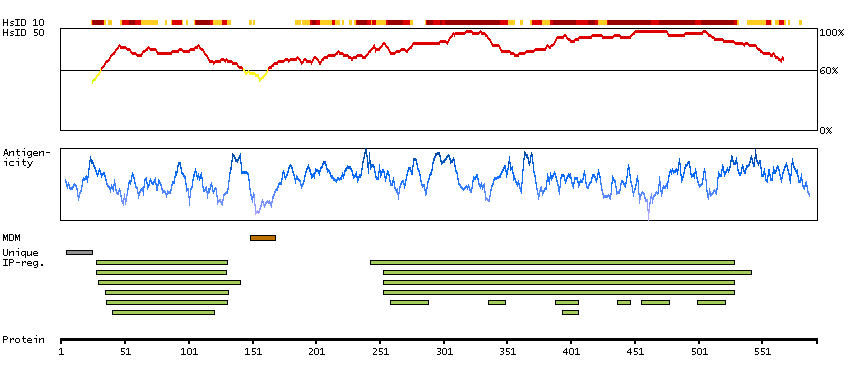
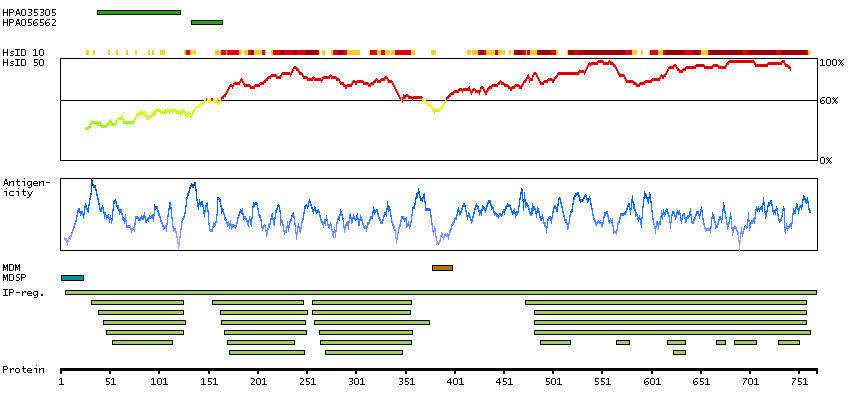
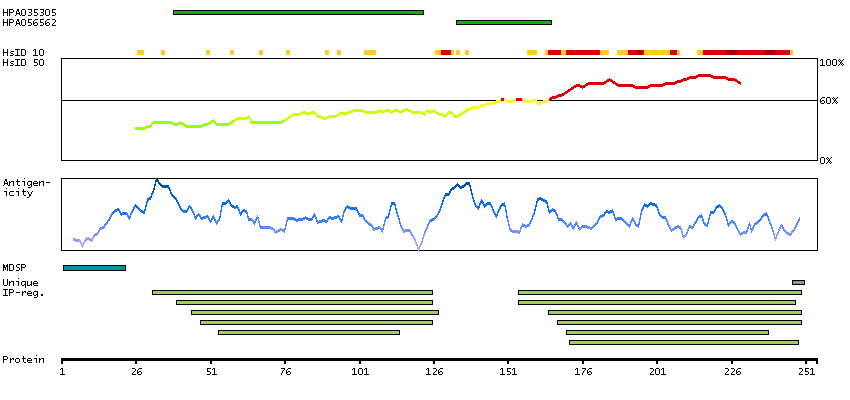
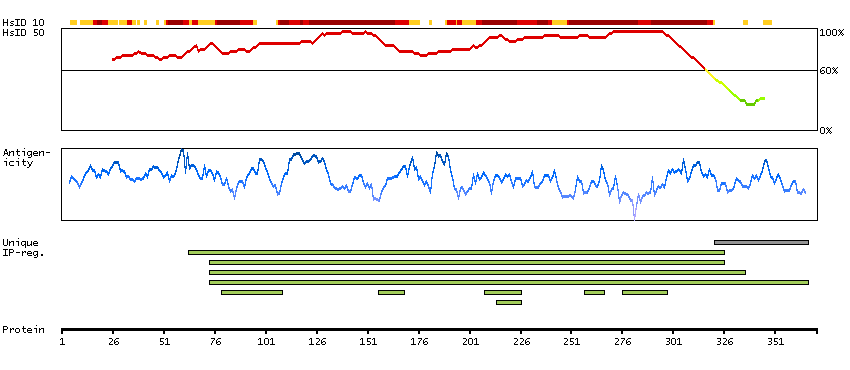
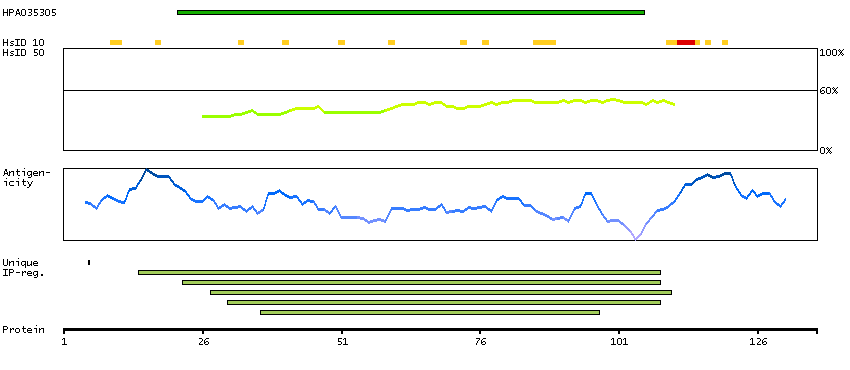
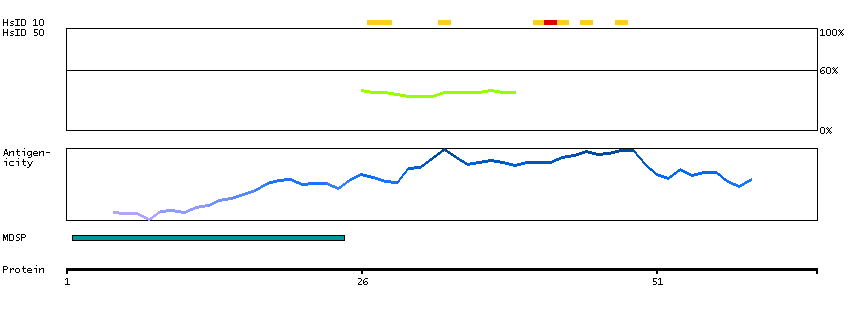
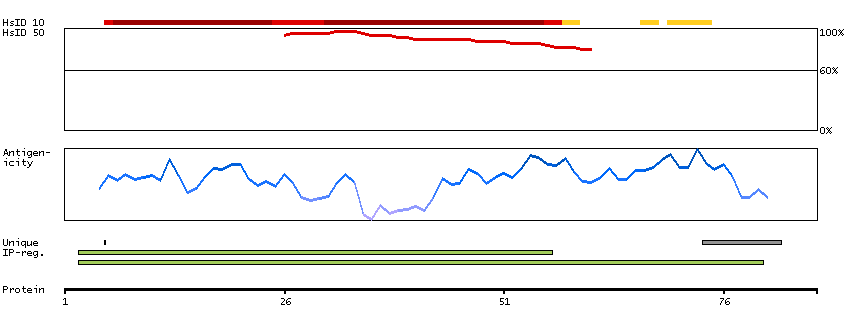
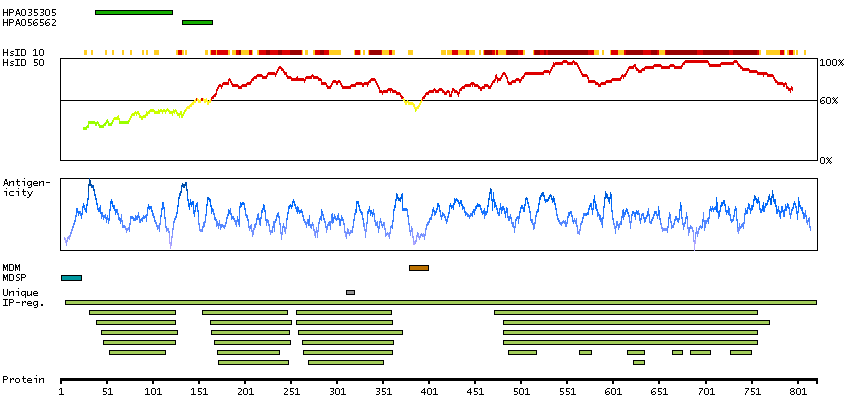
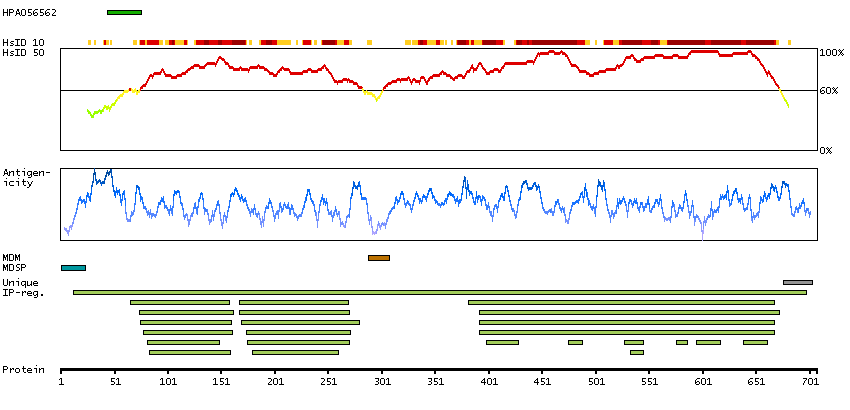
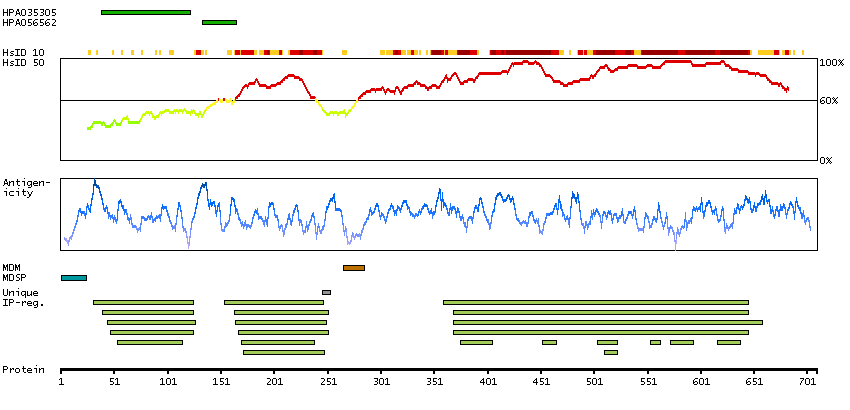
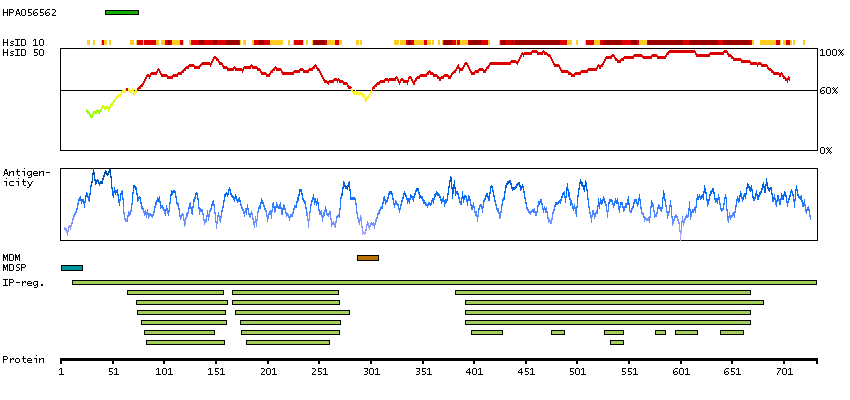
The protein browser displays the antigen location on the target protein(s) and the features of the target protein. The tabs at the top of the protein view section can be used to switch between the different splice variants to which an antigen has been mapped.
At the top of the view, the position of the antigen (identified by the corresponding HPA identifier) is shown as a green bar. A yellow triangle on the bar indicates a <100% sequence identity to the protein target.
Under the antigens, the maximum percent sequence identity of the protein to all other proteins from other human genes is displayed, using a sliding window of 10 aa residues (HsID 10) or 50 aa residues (HsID 50). The region with the lowest possible identity is always selected for antigen design, with a maximum identity of 60% allowed for designing a single-target antigen (read more).
The curve in blue displays the predicted antigenicity i.e. the tendency for different regions of the protein to generate an immune response, with peak regions being predicted to be more antigenic.The curve shows average values based on a sliding window approach using an in-house propensity scale. (read more).
If a signal peptide is predicted by a majority of the signal peptide predictors SPOCTOPUS, SignalP 4.0, and Phobius (turquoise) and/or transmembrane regions (orange) are predicted by MDM, these are displayed.
Low complexity regions are shown in yellow and InterPro regions in green. Common (purple) and unique (grey) regions between different splice variants of the gene are also displayed (read more), and at the bottom of the protein view is the protein scale.
The protein information section displays alternative protein-coding transcripts (splice variants) encoded by this gene according to the Ensembl database.
The ENSP identifier links to the Ensembl website protein summary, while the ENST identifier links to the Ensembl website transcript summary for the selected splice variant. The data in the UniProt column can be expanded to show links to all matching UniProt identifiers for this protein.
The protein classes assigned to this protein are shown if expanding the data in the protein class column. Parent protein classes are in bold font and subclasses are listed under the parent class.
The Gene Ontology terms assigned to this protein are listed if expanding the Gene ontology column. The length of the protein (amino acid residues according to Ensembl), molecular mass (kDalton), predicted signal peptide (according to a majority of the signal peptide predictors SPOCTOPUS, SignalP 4.0, and Phobius) and the number of predicted transmembrane region(s) (according to MDM) are also reported.
Enzymes ENZYME proteins Transferases Kinases Tyr protein kinases CD markers Predicted secreted proteins Secreted proteins predicted by MDSEC SignalP predicted secreted proteins Phobius predicted secreted proteins SPOCTOPUS predicted secreted proteins Plasma proteins RAS pathway related proteins Cancer-related genes Candidate cancer biomarkers Mutated cancer genes Mutational cancer driver genes COSMIC somatic mutations in cancer genes COSMIC Somatic Mutations COSMIC Missense Mutations Disease related genes FDA approved drug targets Biotech drugs Small molecule drugs Protein evidence (Ezkurdia et al 2014)
Show all
GO:0000122 [negative regulation of transcription from RNA polymerase II promoter] GO:0000165 [MAPK cascade] GO:0000166 [nucleotide binding] GO:0001525 [angiogenesis] GO:0001657 [ureteric bud development] GO:0001701 [in utero embryonic development] GO:0002053 [positive regulation of mesenchymal cell proliferation] GO:0003148 [outflow tract septum morphogenesis] GO:0003149 [membranous septum morphogenesis] GO:0004672 [protein kinase activity] GO:0004713 [protein tyrosine kinase activity] GO:0004714 [transmembrane receptor protein tyrosine kinase activity] GO:0005007 [fibroblast growth factor-activated receptor activity] GO:0005088 [Ras guanyl-nucleotide exchange factor activity] GO:0005515 [protein binding] GO:0005524 [ATP binding] GO:0005576 [extracellular region] GO:0005634 [nucleus] GO:0005654 [nucleoplasm] GO:0005737 [cytoplasm] GO:0005794 [Golgi apparatus] GO:0005886 [plasma membrane] GO:0005887 [integral component of plasma membrane] GO:0005938 [cell cortex] GO:0006468 [protein phosphorylation] GO:0006915 [apoptotic process] GO:0007267 [cell-cell signaling] GO:0007409 [axonogenesis] GO:0008201 [heparin binding] GO:0008284 [positive regulation of cell proliferation] GO:0008543 [fibroblast growth factor receptor signaling pathway] GO:0008589 [regulation of smoothened signaling pathway] GO:0009791 [post-embryonic development] GO:0009880 [embryonic pattern specification] GO:0009887 [animal organ morphogenesis] GO:0009986 [cell surface] GO:0010453 [regulation of cell fate commitment] GO:0010518 [positive regulation of phospholipase activity] GO:0014066 [regulation of phosphatidylinositol 3-kinase signaling] GO:0016020 [membrane] GO:0016021 [integral component of membrane] GO:0016301 [kinase activity] GO:0016303 [1-phosphatidylinositol-3-kinase activity] GO:0016310 [phosphorylation] GO:0016331 [morphogenesis of embryonic epithelium] GO:0016740 [transferase activity] GO:0017134 [fibroblast growth factor binding] GO:0018108 [peptidyl-tyrosine phosphorylation] GO:0021769 [orbitofrontal cortex development] GO:0021847 [ventricular zone neuroblast division] GO:0021860 [pyramidal neuron development] GO:0022612 [gland morphogenesis] GO:0030177 [positive regulation of Wnt signaling pathway] GO:0030282 [bone mineralization] GO:0030324 [lung development] GO:0030855 [epithelial cell differentiation] GO:0030901 [midbrain development] GO:0030916 [otic vesicle formation] GO:0031012 [extracellular matrix] GO:0031069 [hair follicle morphogenesis] GO:0031410 [cytoplasmic vesicle] GO:0032808 [lacrimal gland development] GO:0033688 [regulation of osteoblast proliferation] GO:0035264 [multicellular organism growth] GO:0035265 [organ growth] GO:0035602 [fibroblast growth factor receptor signaling pathway involved in negative regulation of apoptotic process in bone marrow] GO:0035603 [fibroblast growth factor receptor signaling pathway involved in hemopoiesis] GO:0035604 [fibroblast growth factor receptor signaling pathway involved in positive regulation of cell proliferation in bone marrow] GO:0035607 [fibroblast growth factor receptor signaling pathway involved in orbitofrontal cortex development] GO:0036092 [phosphatidylinositol-3-phosphate biosynthetic process] GO:0040014 [regulation of multicellular organism growth] GO:0040036 [regulation of fibroblast growth factor receptor signaling pathway] GO:0042472 [inner ear morphogenesis] GO:0042476 [odontogenesis] GO:0042803 [protein homodimerization activity] GO:0043231 [intracellular membrane-bounded organelle] GO:0043410 [positive regulation of MAPK cascade] GO:0043547 [positive regulation of GTPase activity] GO:0045165 [cell fate commitment] GO:0045667 [regulation of osteoblast differentiation] GO:0045787 [positive regulation of cell cycle] GO:0045944 [positive regulation of transcription from RNA polymerase II promoter] GO:0046777 [protein autophosphorylation] GO:0046854 [phosphatidylinositol phosphorylation] GO:0046934 [phosphatidylinositol-4,5-bisphosphate 3-kinase activity] GO:0048015 [phosphatidylinositol-mediated signaling] GO:0048286 [lung alveolus development] GO:0048557 [embryonic digestive tract morphogenesis] GO:0048562 [embryonic organ morphogenesis] GO:0048565 [digestive tract development] GO:0048568 [embryonic organ development] GO:0048608 [reproductive structure development] GO:0048701 [embryonic cranial skeleton morphogenesis] GO:0048705 [skeletal system morphogenesis] GO:0048730 [epidermis morphogenesis] GO:0048755 [branching morphogenesis of a nerve] GO:0048762 [mesenchymal cell differentiation] GO:0050679 [positive regulation of epithelial cell proliferation] GO:0051150 [regulation of smooth muscle cell differentiation] GO:0051781 [positive regulation of cell division] GO:0055010 [ventricular cardiac muscle tissue morphogenesis] GO:0060045 [positive regulation of cardiac muscle cell proliferation] GO:0060076 [excitatory synapse] GO:0060174 [limb bud formation] GO:0060348 [bone development] GO:0060349 [bone morphogenesis] GO:0060442 [branching involved in prostate gland morphogenesis] GO:0060445 [branching involved in salivary gland morphogenesis] GO:0060449 [bud elongation involved in lung branching] GO:0060463 [lung lobe morphogenesis] GO:0060484 [lung-associated mesenchyme development] GO:0060501 [positive regulation of epithelial cell proliferation involved in lung morphogenesis] GO:0060512 [prostate gland morphogenesis] GO:0060523 [prostate epithelial cord elongation] GO:0060527 [prostate epithelial cord arborization involved in prostate glandular acinus morphogenesis] GO:0060529 [squamous basal epithelial stem cell differentiation involved in prostate gland acinus development] GO:0060595 [fibroblast growth factor receptor signaling pathway involved in mammary gland specification] GO:0060601 [lateral sprouting from an epithelium] GO:0060615 [mammary gland bud formation] GO:0060664 [epithelial cell proliferation involved in salivary gland morphogenesis] GO:0060667 [branch elongation involved in salivary gland morphogenesis] GO:0060670 [branching involved in labyrinthine layer morphogenesis] GO:0060687 [regulation of branching involved in prostate gland morphogenesis] GO:0060688 [regulation of morphogenesis of a branching structure] GO:0060915 [mesenchymal cell differentiation involved in lung development] GO:0060916 [mesenchymal cell proliferation involved in lung development] GO:0070372 [regulation of ERK1 and ERK2 cascade] GO:0070374 [positive regulation of ERK1 and ERK2 cascade] GO:0090263 [positive regulation of canonical Wnt signaling pathway]
Predicted intracellular proteins RAS pathway related proteins Cancer-related genes Mutated cancer genes Mutational cancer driver genes COSMIC somatic mutations in cancer genes COSMIC Somatic Mutations COSMIC Missense Mutations Protein evidence (Ezkurdia et al 2014)
Predicted intracellular proteins RAS pathway related proteins Cancer-related genes Mutated cancer genes Mutational cancer driver genes COSMIC somatic mutations in cancer genes COSMIC Somatic Mutations COSMIC Missense Mutations Protein evidence (Ezkurdia et al 2014)
 The Human Protein Atlas project is funded


 MENU
MENU