We use cookies to enhance the usability of our website. If you continue, we'll assume that you are happy to receive all cookies. More information. Don't show this again.
The protein expression bar, with the units not detected (n), low (l), medium (m) and high (h), is based on a best estimate of the true protein expression for proteins where the antibody staining pattern has been analyzed by knowledge-based annotation. For genes where more than one antibody has been used, a collective score is set. For details, see Assays & annotation.
h
m
l
n
RNA expressioni
RNA expression shows average values based on RNA-seq data generated by HPA, the Genotype-Tissue Expression (GTEx) consortium or the FANTOM5 consortium.
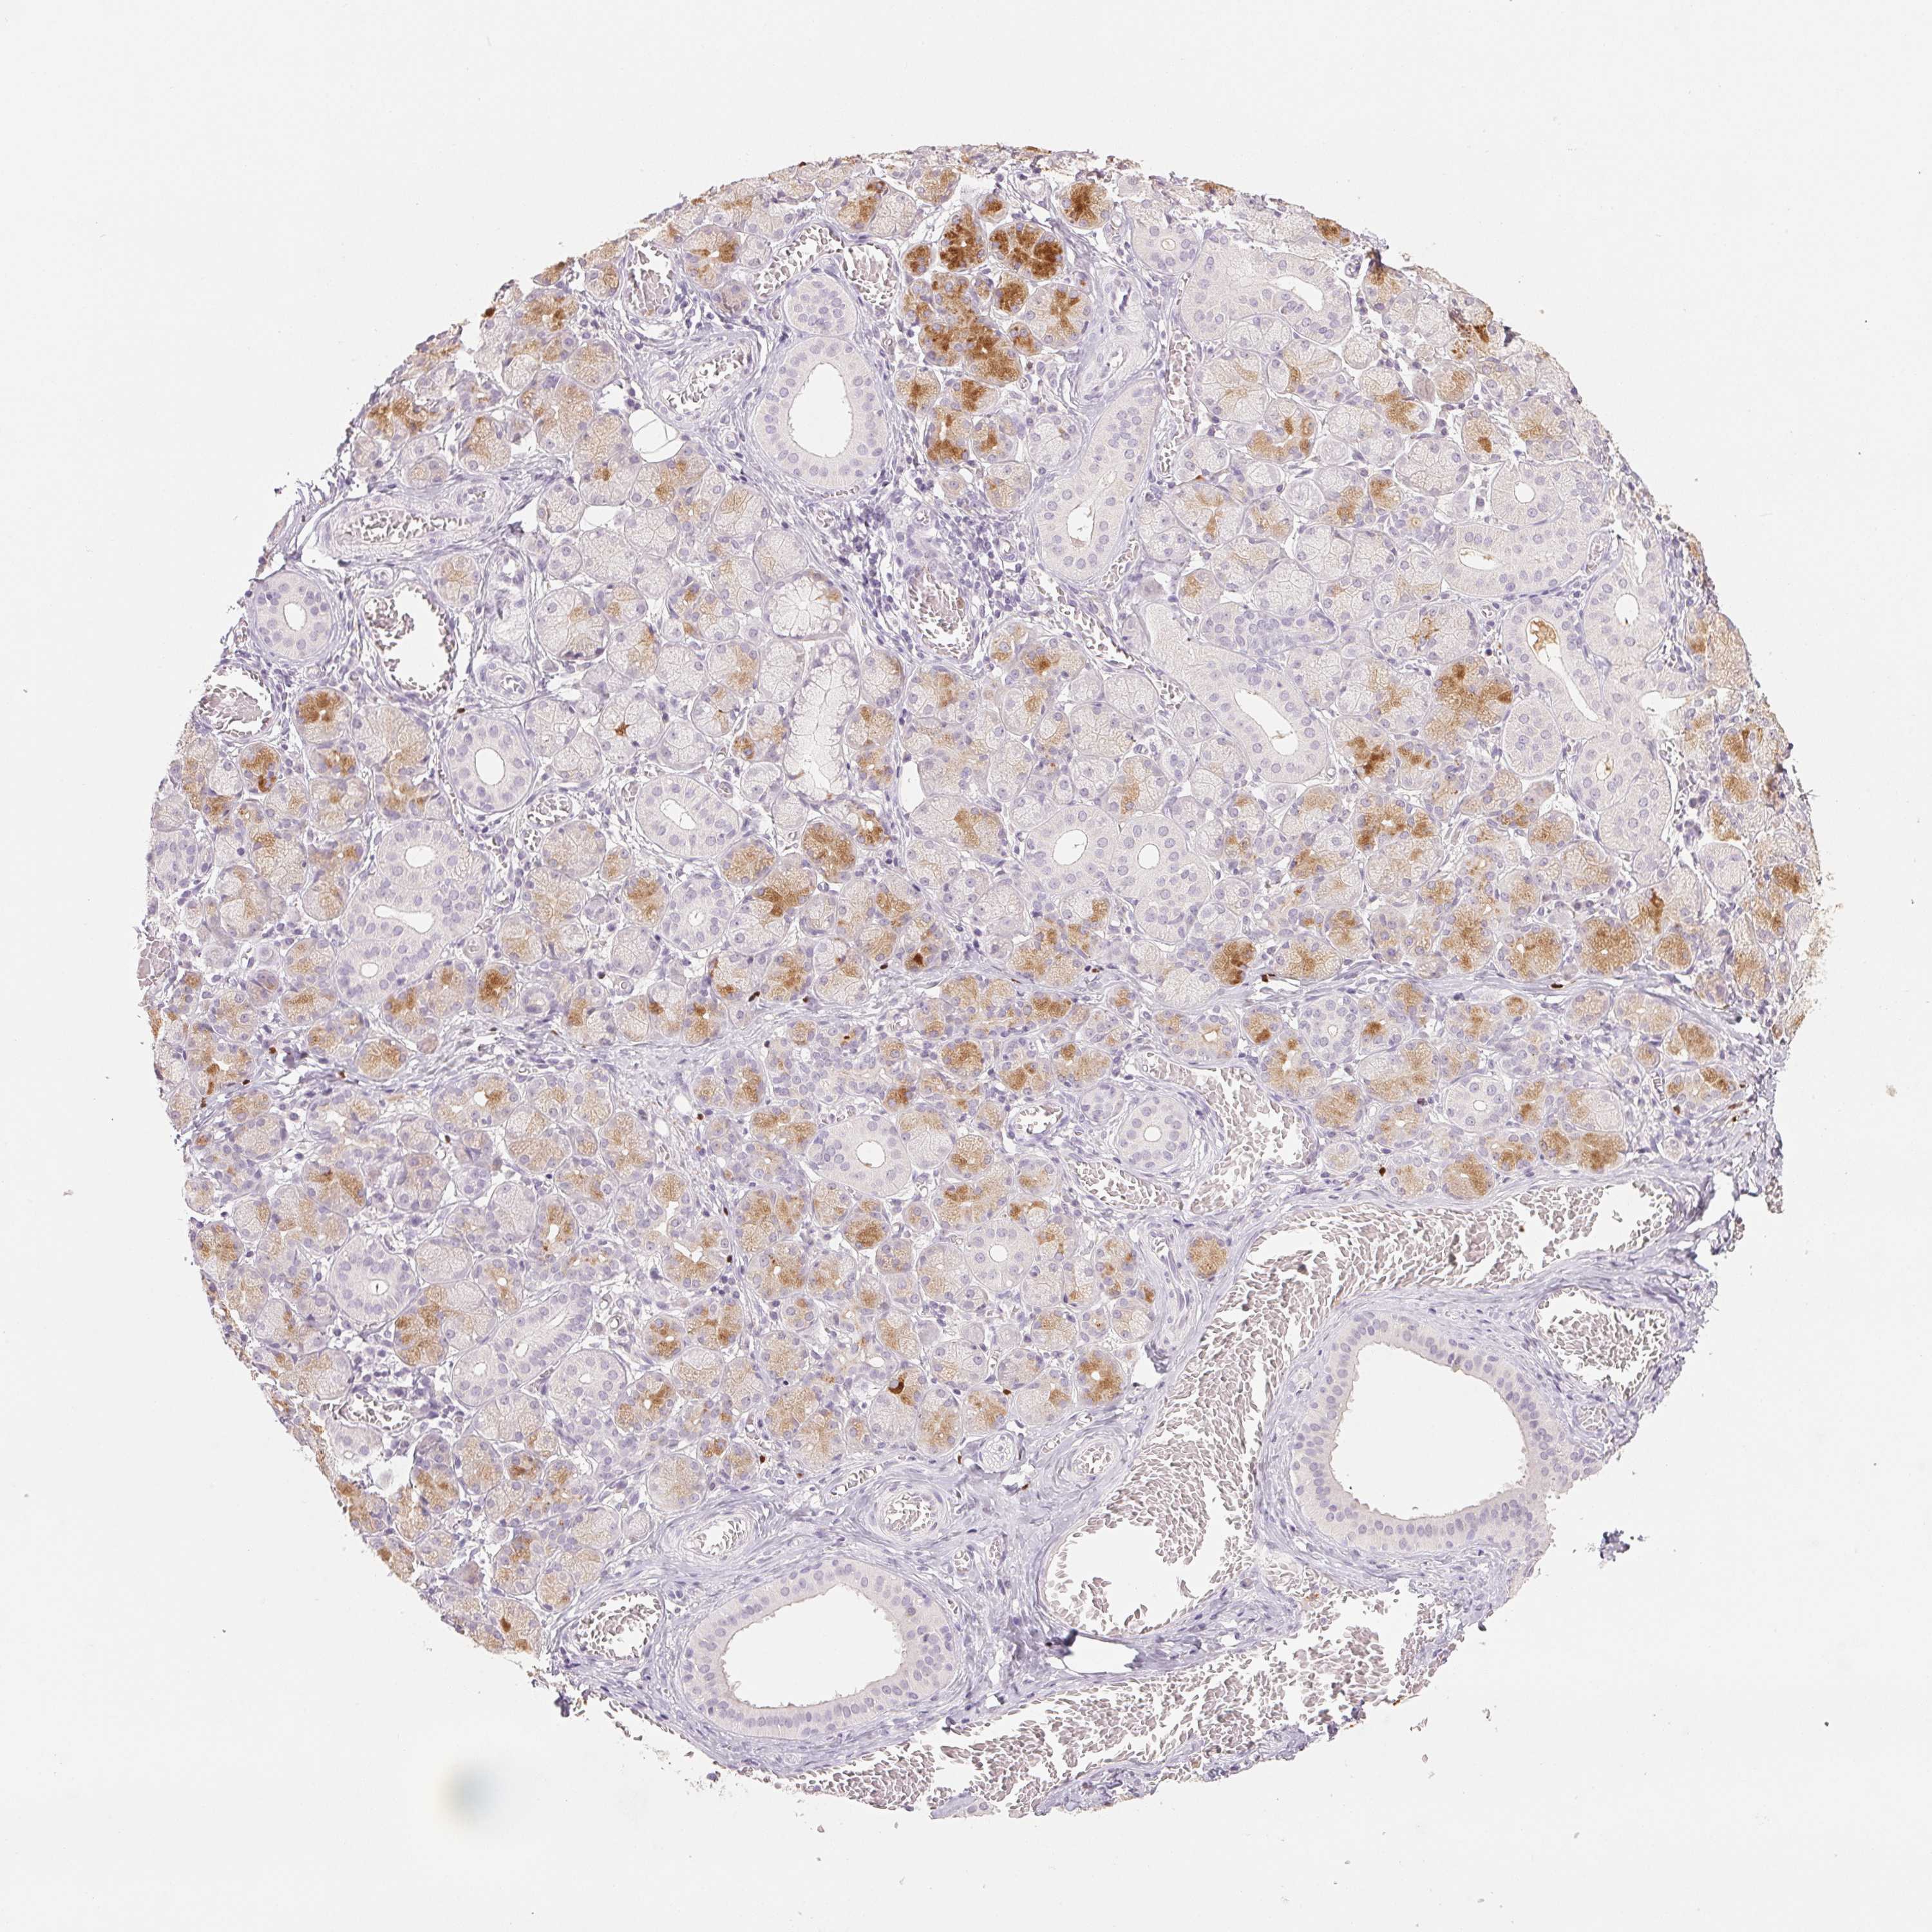
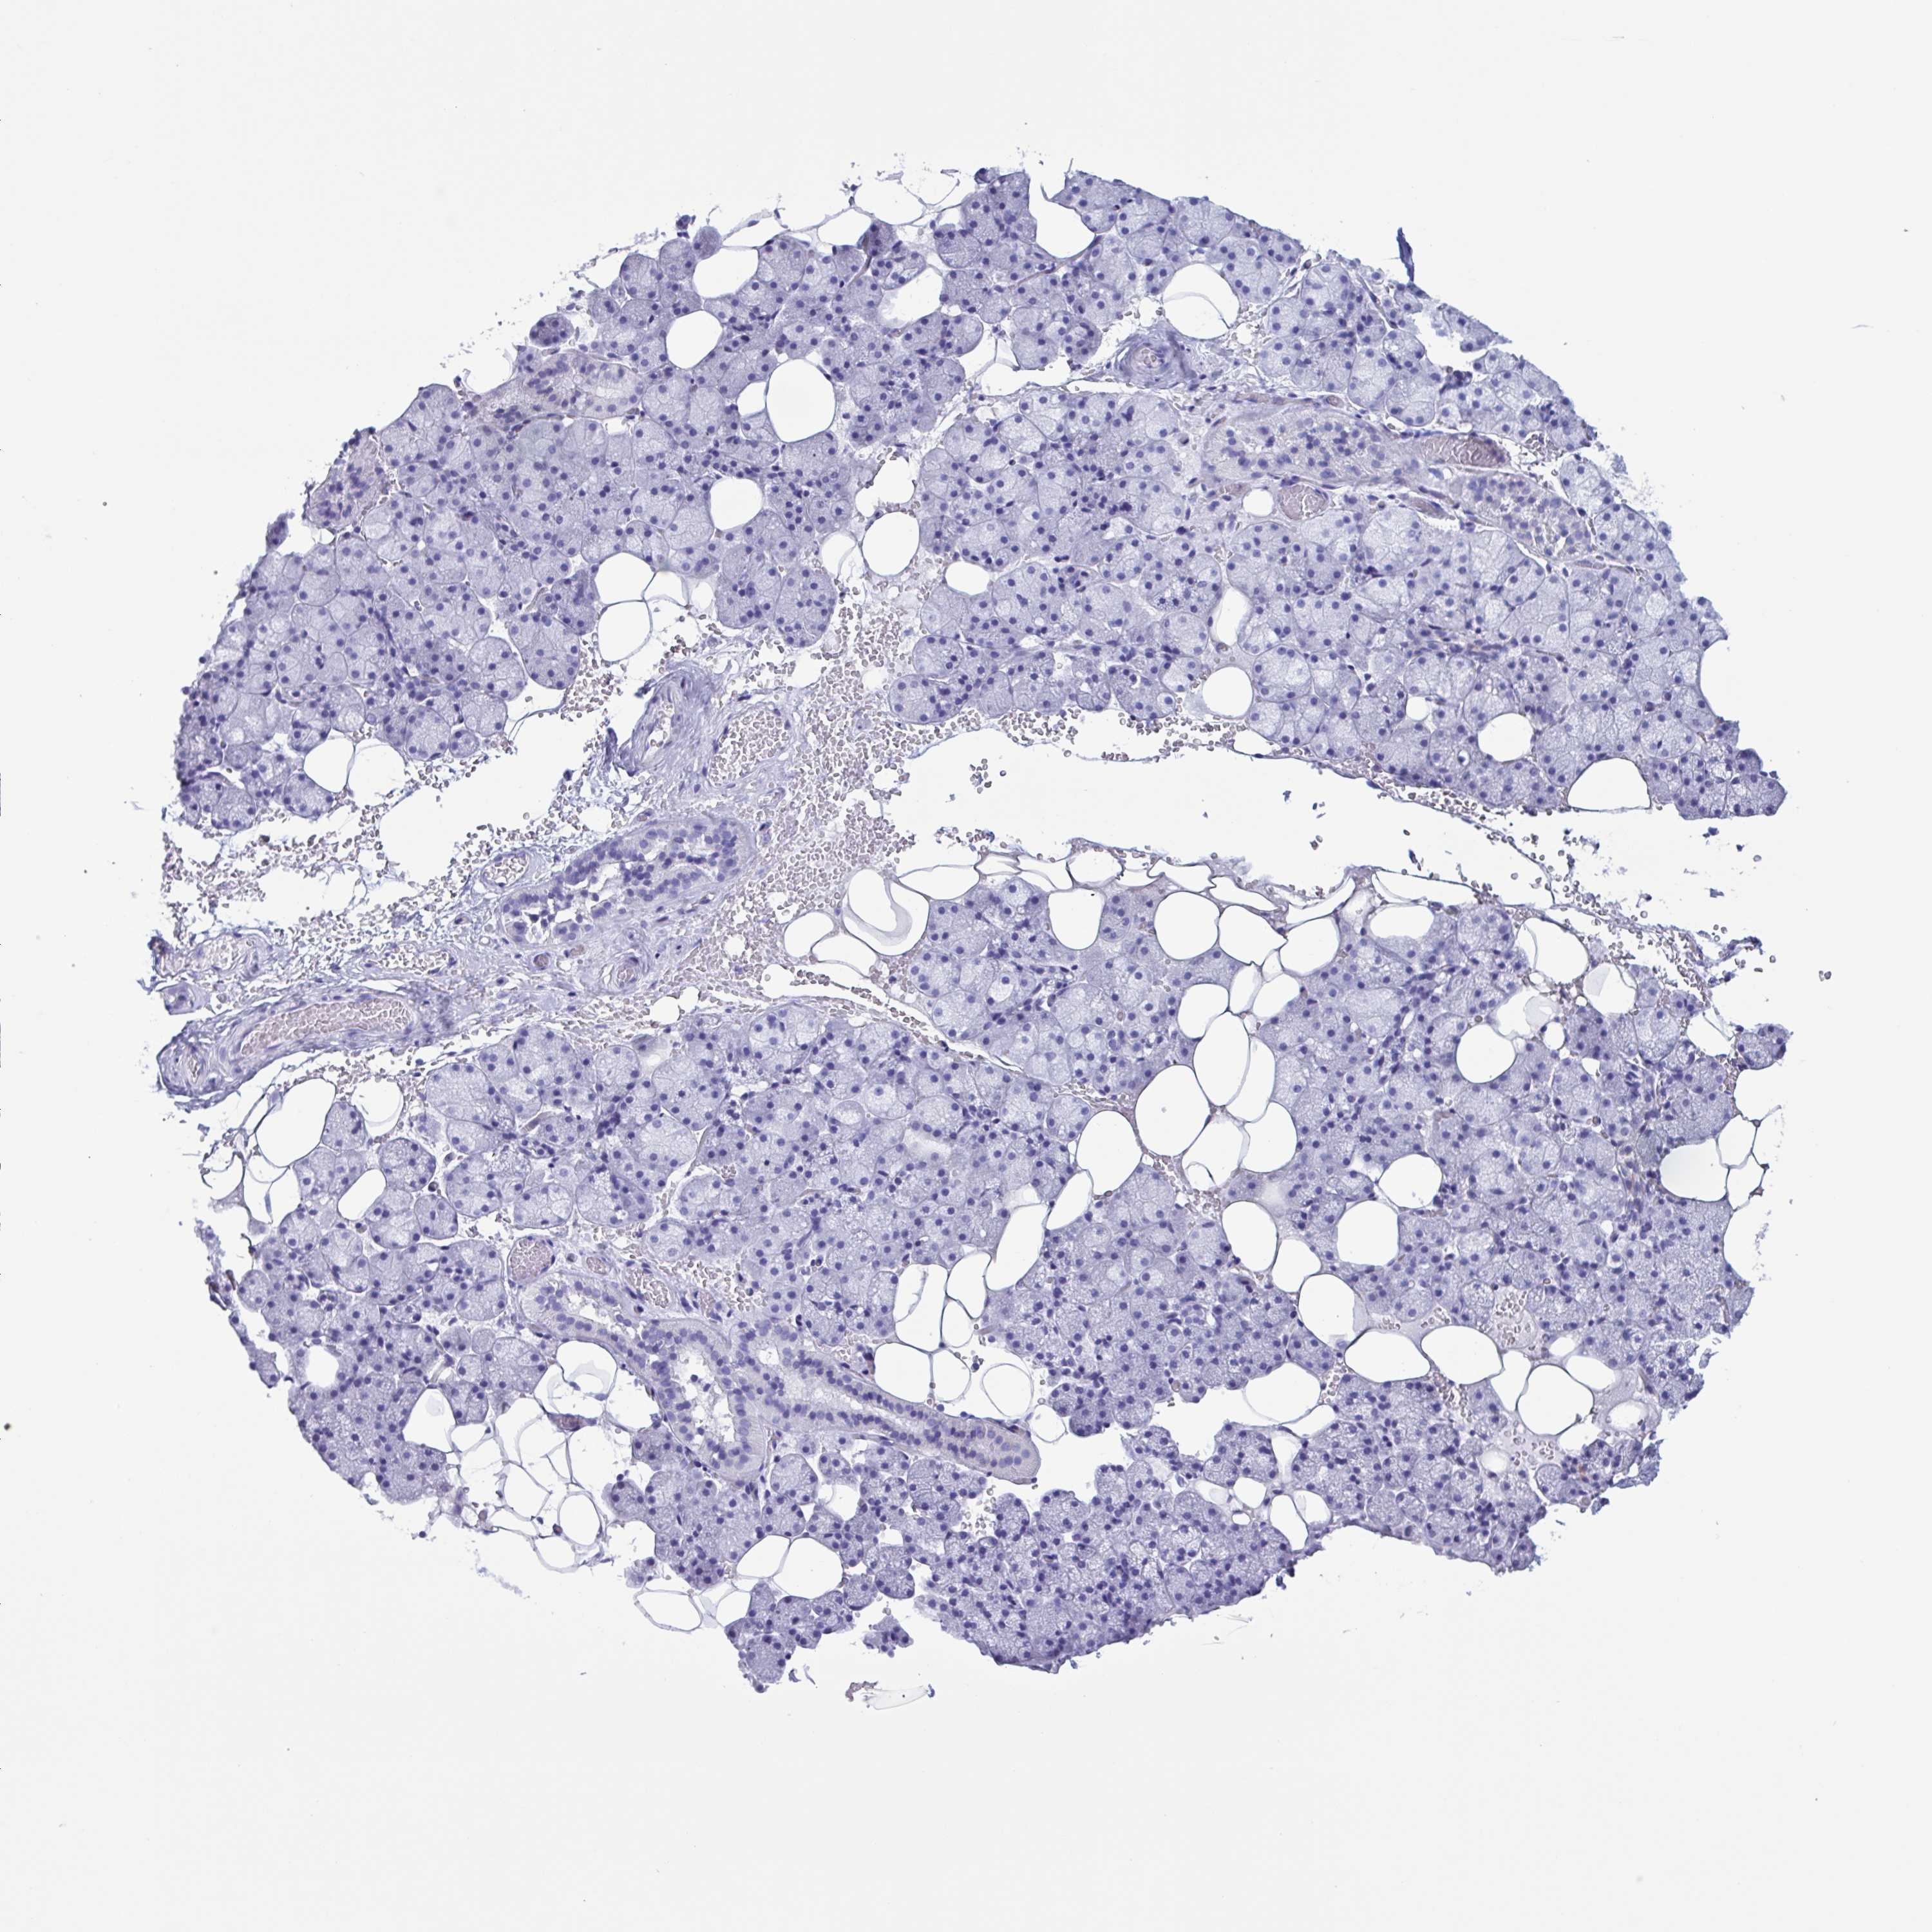
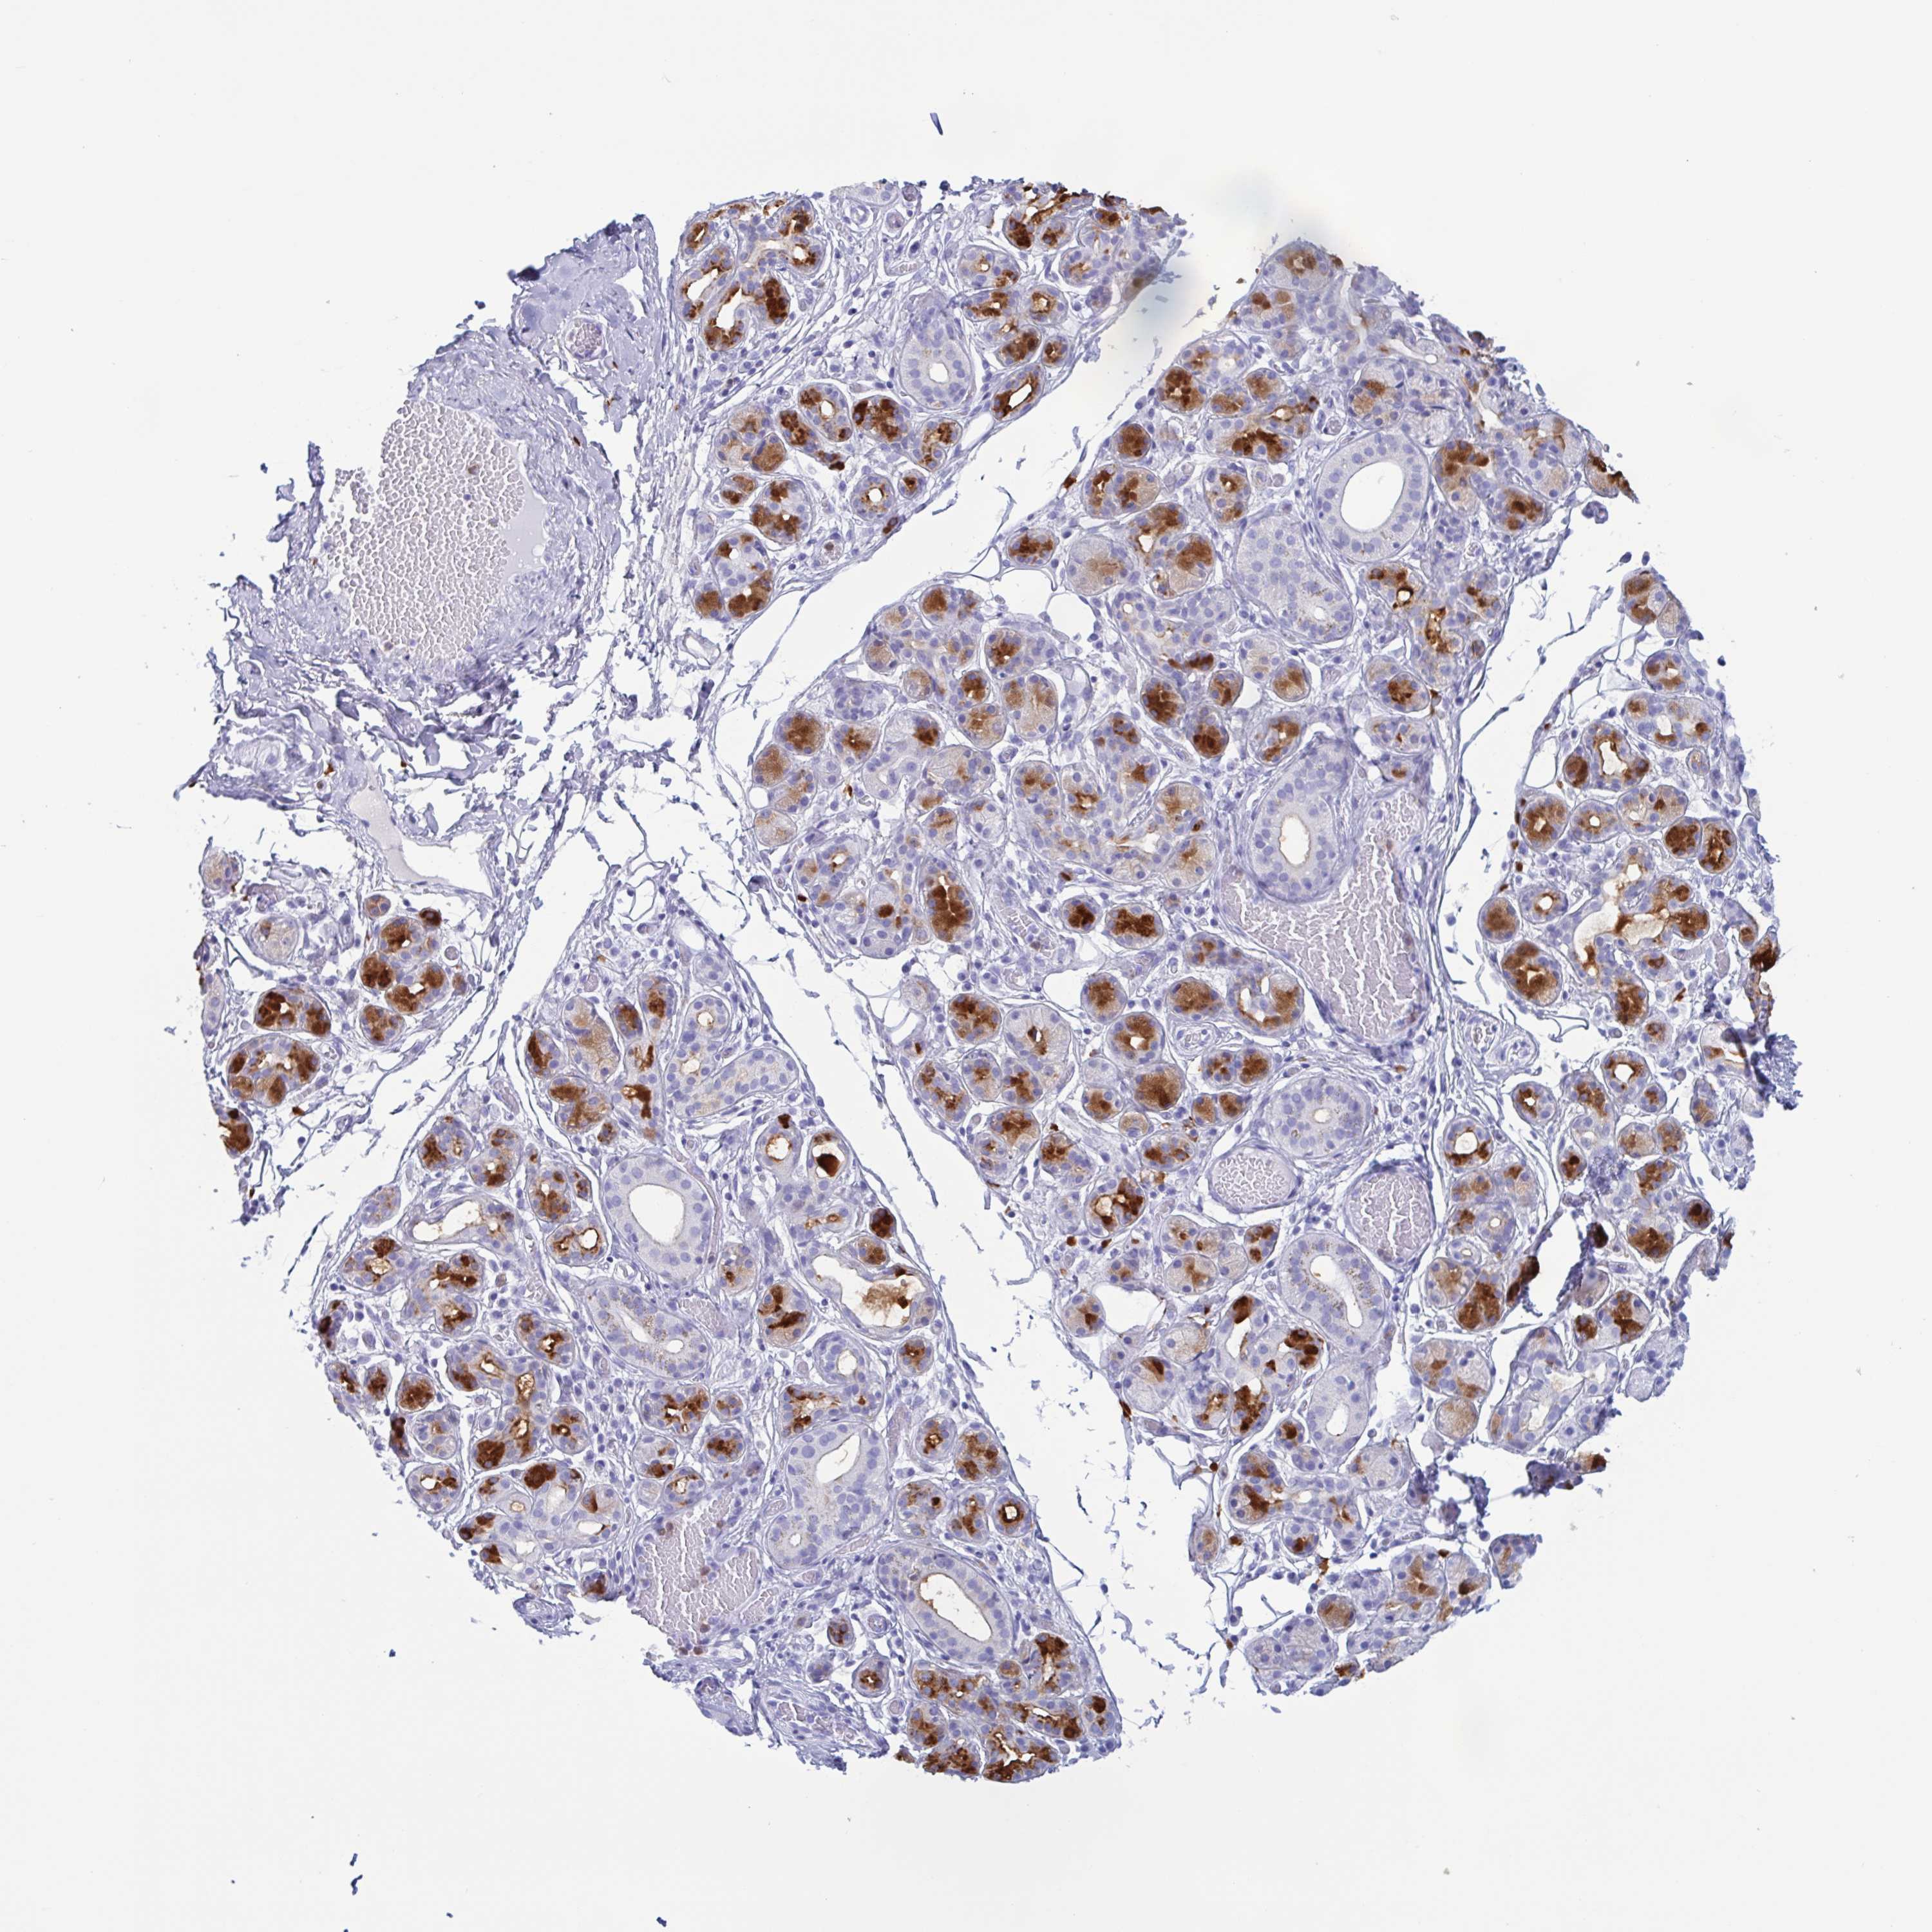
The detailed normal tissue page shows images of the stained tissue, together with antibody staining and expression level of the cell types. A knowledge-based annotated protein expression is provided for each cell type at the top of the page and the staining level of the individual antibodies is given underneath each antibody ID.
Samples from up to three different individuals have been stained for each antibody. The gender, age and tissue characterization are reported for each individual (patient) and are viewable when clicking on the image for magnification.
The images can be clicked for an enlarged view that can be panned. From the enlarged view, all stained images for all antibodies can be browsed (represented by miniature images). The miniature image with an orange overlay is the currently displayed image.
This score describes the level of antibody staining observed in the annotated cell types as not detected, low, medium, or high. It is based on the staining intensity and fraction of stained cells.
The RNA-seq details section shows detailed information about the individual samples used for the transcript profiling and results of the RNA-seq analysis.
Information about each individual sample is listed below, including gender, age, a tissue section image and estimated fractions of cell types. TPM (transcripts per million) values give a quantification of the gene abundance which is comparable between different genes and samples.
RNA-Seq data is reported as average RPKM (reads per kilobase per million mapped reads), generated by the Genotype-Tissue Expression (GTEx) project. More information can be found on the GTEx portal.
Normal distribution across the dataset is visualized with box plots, shown as median and 25th and 75th percentiles. Points are displayed as outliers if they are above or below 1.5 times the interquartile range. RPKM values of the individual samples are presented next to the box plot.
Max RPKM: 2476.2
Min RPKM: 3.2
Std RPKM: 547.9
Median RPKM: 317.9
GTEX-12WSL-2126-SM-5GCNG
50-59 years, male
2476.2
GTEX-13111-2326-SM-5LZUQ
50-59 years, male
2172.3
GTEX-YF7O-2226-SM-5CVN8
50-59 years, male
1781.9
GTEX-13OVI-2326-SM-5KM47
60-69 years, female
1492.8
GTEX-1339X-2326-SM-5HL5B
40-49 years, male
1482.1
GTEX-ZC5H-2726-SM-5KLZW
40-49 years, female
1480.5
GTEX-1314G-2026-SM-5LZUM
30-39 years, male
1192.7
GTEX-WOFM-2126-SM-4OOSR
20-29 years, male
1097.0
GTEX-WFJO-2026-SM-4LVM3
30-39 years, male
1071.7
GTEX-13O21-1926-SM-5MR39
50-59 years, male
1032.1
GTEX-ZXG5-2826-SM-5NQ8T
60-69 years, male
908.0
GTEX-Y5V6-2226-SM-4VDTC
60-69 years, male
901.3
GTEX-XMK1-2626-SM-4B65R
40-49 years, male
864.4
GTEX-11P82-0926-SM-5986X
20-29 years, male
724.9
GTEX-13G51-2426-SM-5LZY8
60-69 years, male
712.2
GTEX-1117F-3026-SM-5GZYU
60-69 years, female
711.4
GTEX-Y3I4-1926-SM-4TT8L
50-59 years, male
699.2
GTEX-11TUW-2426-SM-5EQKB
60-69 years, male
688.1
GTEX-13113-1526-SM-5EGHV
60-69 years, female
648.1
GTEX-1445S-2926-SM-5O993
60-69 years, male
570.1
GTEX-11P81-2026-SM-5P9GT
30-39 years, female
523.8
GTEX-146FR-1226-SM-5SIA7
60-69 years, female
504.4
GTEX-131XF-2826-SM-5EGKH
60-69 years, male
504.2
GTEX-ZA64-1726-SM-5CVMF
20-29 years, male
492.4
GTEX-ZP4G-1926-SM-57WDZ
20-29 years, female
453.8
GTEX-XGQ4-2626-SM-4AT6B
50-59 years, male
446.5
GTEX-X15G-2126-SM-4PQZR
50-59 years, female
426.2
GTEX-11WQK-2926-SM-5EQKT
50-59 years, male
381.3
GTEX-11EQ9-2026-SM-5P9JI
30-39 years, male
317.9
GTEX-YB5K-1726-SM-5IFIZ
40-49 years, female
303.4
GTEX-ZPU1-2326-SM-57WEP
40-49 years, male
283.5
GTEX-13JVG-2926-SM-5J2N9
60-69 years, male
278.1
GTEX-13CF2-2426-SM-5LZYL
60-69 years, male
266.5
GTEX-ZQUD-2126-SM-51MSY
30-39 years, male
258.3
GTEX-11ZTT-2226-SM-5CVLP
60-69 years, female
252.7
GTEX-ZQG8-2126-SM-4YCF1
60-69 years, female
228.5
GTEX-X261-2426-SM-4PQZU
50-59 years, male
223.1
GTEX-13QJC-2326-SM-5Q5CD
60-69 years, female
222.9
GTEX-145ME-1626-SM-5RQI3
40-49 years, female
208.9
GTEX-13NYC-2626-SM-5K7VN
60-69 years, male
199.6
GTEX-111FC-2926-SM-5GZY7
60-69 years, male
198.9
GTEX-XV7Q-2426-SM-4BRV8
40-49 years, female
181.6
GTEX-X5EB-1726-SM-4E3J7
40-49 years, male
165.8
GTEX-X3Y1-1926-SM-4PQZO
40-49 years, male
117.6
GTEX-ZE7O-2926-SM-51MSG
50-59 years, female
100.1
GTEX-12WSN-2226-SM-5DUXT
40-49 years, male
96.0
GTEX-12WSM-1826-SM-5BC64
60-69 years, male
68.7
GTEX-11NV4-1926-SM-5N9D4
60-69 years, male
67.4
GTEX-ZT9W-2126-SM-51MSF
50-59 years, male
67.1
GTEX-Y111-2626-SM-4TT24
50-59 years, male
65.7
GTEX-14B4R-1426-SM-5Q5CG
30-39 years, male
58.7
GTEX-Y5LM-1826-SM-4VDT9
40-49 years, female
55.2
GTEX-13OVL-2926-SM-5IFG3
50-59 years, male
43.5
GTEX-WYVS-2026-SM-4RGNS
40-49 years, female
40.0
GTEX-13NYB-2426-SM-5IFF4
40-49 years, male
36.1
GTEX-13VXT-1726-SM-5IFF5
20-29 years, female
11.4
GTEX-11ZTS-3026-SM-5EQM7
60-69 years, female
3.2
Show all
SALIVARY GLAND - FANTOM5 CAGEi
Tissue data obtained through Cap Analysis of Gene Expression (CAGE) are reported as Tags Per Million, generated by the FANTOM5 project. More information can be found here.
 The Human Protein Atlas project is funded


 MENU
MENU