We use cookies to enhance the usability of our website. If you continue, we'll assume that you are happy to receive all cookies. More information. Don't show this again.
The protein expression bar, with the units not detected (n), low (l), medium (m) and high (h), is based on a best estimate of the true protein expression for proteins where the antibody staining pattern has been analyzed by knowledge-based annotation. For genes where more than one antibody has been used, a collective score is set. For details, see Assays & annotation.
h
m
l
n
RNA expressioni
RNA expression shows average values based on RNA-seq data generated by HPA, the Genotype-Tissue Expression (GTEx) consortium or the FANTOM5 consortium.
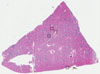
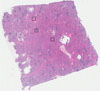
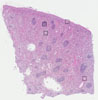
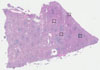
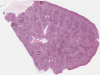
The detailed normal tissue page shows images of the stained tissue, together with antibody staining and expression level of the cell types. A knowledge-based annotated protein expression is provided for each cell type at the top of the page and the staining level of the individual antibodies is given underneath each antibody ID.
Samples from up to three different individuals have been stained for each antibody. The gender, age and tissue characterization are reported for each individual (patient) and are viewable when clicking on the image for magnification.
The images can be clicked for an enlarged view that can be panned. From the enlarged view, all stained images for all antibodies can be browsed (represented by miniature images). The miniature image with an orange overlay is the currently displayed image.
This score describes the level of antibody staining observed in the annotated cell types as not detected, low, medium, or high. It is based on the staining intensity and fraction of stained cells.
The RNA-seq details section shows detailed information about the individual samples used for the transcript profiling and results of the RNA-seq analysis.
Information about each individual sample is listed below, including gender, age, a tissue section image and estimated fractions of cell types. TPM (transcripts per million) values give a quantification of the gene abundance which is comparable between different genes and samples.
RNA-Seq data is reported as average RPKM (reads per kilobase per million mapped reads), generated by the Genotype-Tissue Expression (GTEx) project. More information can be found on the GTEx portal.
Normal distribution across the dataset is visualized with box plots, shown as median and 25th and 75th percentiles. Points are displayed as outliers if they are above or below 1.5 times the interquartile range. RPKM values of the individual samples are presented next to the box plot.
Max RPKM: 9821.6
Min RPKM: 1618.6
Std RPKM: 1749.1
Median RPKM: 5818.1
GTEX-11DXX-0726-SM-5H12X
60-69 years, female
9821.6
GTEX-ZVZP-0726-SM-59HKA
50-59 years, male
9568.6
GTEX-11EQ9-0426-SM-5A5JY
30-39 years, male
8837.0
GTEX-147F3-0126-SM-5NQBJ
50-59 years, female
8650.5
GTEX-QCQG-0226-SM-48U28
50-59 years, female
8618.3
GTEX-WFON-0126-SM-4LVM9
40-49 years, male
8530.2
GTEX-ZYFG-0726-SM-5GIDX
60-69 years, female
8426.0
GTEX-132QS-0226-SM-5IFFZ
60-69 years, male
8409.7
GTEX-12BJ1-0726-SM-5EGGF
60-69 years, male
8266.8
GTEX-12WSJ-0526-SM-5GCOZ
40-49 years, female
8191.0
GTEX-Y5LM-0326-SM-4VBRN
40-49 years, female
8064.1
GTEX-XGQ4-0126-SM-4AT4H
50-59 years, male
7985.7
GTEX-11LCK-0126-SM-5A5M5
30-39 years, male
7956.7
GTEX-QV31-0126-SM-447BP
30-39 years, male
7943.1
GTEX-12WSK-0126-SM-5GCO7
40-49 years, female
7814.4
GTEX-X4LF-0226-SM-4QAS8
50-59 years, male
7710.5
GTEX-13PVR-0326-SM-5RQJY
60-69 years, female
7666.1
GTEX-13VXT-1326-SM-5LU3Y
20-29 years, female
7664.6
GTEX-ZDTT-1026-SM-5KM19
60-69 years, male
7624.1
GTEX-ZZPU-0126-SM-5E446
50-59 years, female
7535.0
GTEX-Z9EW-0726-SM-5HL9H
40-49 years, male
7511.1
GTEX-ZVP2-0526-SM-51MSC
50-59 years, male
7171.7
GTEX-13111-0126-SM-5EGHO
50-59 years, male
7111.1
GTEX-13PL7-1126-SM-5MR5O
60-69 years, female
7085.5
GTEX-P4PP-0926-SM-48TBZ
30-39 years, female
6990.5
GTEX-X3Y1-0126-SM-4PQZA
40-49 years, male
6986.0
GTEX-YEC4-0126-SM-4W21T
40-49 years, male
6956.0
GTEX-13FH7-1326-SM-5IFG8
50-59 years, female
6844.8
GTEX-Y3I4-0126-SM-4TT26
50-59 years, male
6802.8
GTEX-XUJ4-0226-SM-4BOP8
60-69 years, female
6779.3
GTEX-117YX-2126-SM-5GIEL
50-59 years, male
6775.1
GTEX-S3XE-0626-SM-4AD6B
50-59 years, male
6765.2
GTEX-1399S-0226-SM-5IFFG
30-39 years, female
6578.8
GTEX-YB5K-1926-SM-4VDT4
40-49 years, female
6562.6
GTEX-P4QS-0926-SM-48TBS
60-69 years, male
6560.7
GTEX-ZP4G-0326-SM-4YCEF
20-29 years, female
6475.6
GTEX-UJHI-0126-SM-4IHLP
50-59 years, female
6345.2
GTEX-PX3G-0926-SM-48U12
20-29 years, female
6328.3
GTEX-11P7K-0426-SM-5BC5H
30-39 years, male
6305.4
GTEX-146FR-1926-SM-5NQA6
60-69 years, female
6257.6
GTEX-139T6-0226-SM-5IFGZ
50-59 years, male
6244.4
GTEX-XAJ8-0126-SM-47JYG
40-49 years, male
6155.7
GTEX-YFCO-0926-SM-5LUA5
40-49 years, male
6113.2
GTEX-14DAR-0326-SM-5S2PS
50-59 years, male
6076.5
GTEX-Y8LW-0126-SM-4VBS1
50-59 years, female
6004.8
GTEX-1122O-0526-SM-5N9DM
60-69 years, female
5991.1
GTEX-146FQ-0626-SM-5LU9U
30-39 years, male
5983.1
GTEX-13S86-0126-SM-5S2PI
40-49 years, male
5951.6
GTEX-13CF3-0226-SM-5J1NW
60-69 years, female
5909.0
GTEX-PLZ6-0126-SM-48TC6
30-39 years, male
5885.6
GTEX-1211K-0426-SM-5FQTP
60-69 years, female
5849.3
GTEX-W5WG-0626-SM-4SOID
50-59 years, female
5821.1
GTEX-ZPU1-1026-SM-4YCEQ
40-49 years, male
5815.1
GTEX-S4Z8-0226-SM-4AD5K
60-69 years, male
5802.5
GTEX-11XUK-0426-SM-5EQML
40-49 years, female
5720.6
GTEX-QMRM-0226-SM-4R1K7
50-59 years, male
5696.0
GTEX-12WSN-0126-SM-5DUX5
40-49 years, male
5647.0
GTEX-T5JW-0126-SM-4DM6K
20-29 years, female
5629.1
GTEX-QLQW-0126-SM-447BK
30-39 years, male
5564.1
GTEX-13X6H-0726-SM-5Q5BX
50-59 years, female
5549.6
GTEX-XPVG-0626-SM-4B65B
50-59 years, male
5522.9
GTEX-1399R-0226-SM-5IJGG
30-39 years, male
5474.2
GTEX-XMK1-0126-SM-4B65F
40-49 years, male
5416.0
GTEX-XXEK-0126-SM-4BRVU
50-59 years, male
5359.7
GTEX-Y114-0726-SM-4TT6U
50-59 years, female
5358.3
GTEX-11NSD-0426-SM-5N9CR
20-29 years, male
5322.9
GTEX-U3ZH-0126-SM-4DXUK
30-39 years, male
5279.1
GTEX-OIZH-0926-SM-48TBR
50-59 years, male
5197.4
GTEX-11VI4-0126-SM-5GU6Z
40-49 years, female
5188.5
GTEX-U4B1-0526-SM-4DXTK
40-49 years, male
4902.1
GTEX-131XG-0426-SM-5IFGD
50-59 years, female
4847.1
GTEX-144GN-2126-SM-5O99D
50-59 years, male
4778.9
GTEX-QDVN-0526-SM-48TZ4
50-59 years, male
4752.1
GTEX-11P81-1326-SM-5GU5S
30-39 years, female
4716.2
GTEX-VJYA-0126-SM-4KL1P
60-69 years, male
4705.8
GTEX-ZLFU-0526-SM-4WWBN
40-49 years, male
4648.1
GTEX-R55G-0226-SM-48FEI
40-49 years, female
4494.1
GTEX-RUSQ-0126-SM-47JWV
50-59 years, male
4446.8
GTEX-14E6E-1226-SM-5S2R5
30-39 years, male
4445.7
GTEX-POMQ-0126-SM-48TD6
20-29 years, female
4443.1
GTEX-U3ZN-0126-SM-4DXUM
30-39 years, female
4420.1
GTEX-ZAB5-0526-SM-5CVMU
50-59 years, male
4311.9
GTEX-WHWD-0126-SM-4OORS
50-59 years, male
4230.7
GTEX-ZLWG-0426-SM-4WWFA
50-59 years, female
4176.2
GTEX-145MN-0126-SM-5RQHY
30-39 years, male
4053.1
GTEX-13U4I-1626-SM-5IFFR
40-49 years, female
3958.6
GTEX-Q2AH-0226-SM-48U1I
40-49 years, male
3953.1
GTEX-QV44-0126-SM-4R1KH
50-59 years, male
3932.9
GTEX-ZYWO-0226-SM-5GZX3
40-49 years, female
3894.1
GTEX-ZV6S-0826-SM-5NQ6Z
40-49 years, female
3879.4
GTEX-YB5E-0426-SM-5IFHR
40-49 years, male
3870.3
GTEX-PW2O-0126-SM-48TC8
20-29 years, male
3838.5
GTEX-Y3IK-0126-SM-4WWE9
50-59 years, female
3698.1
GTEX-OOBJ-0926-SM-48TDO
60-69 years, male
3321.0
GTEX-Q734-0226-SM-48U1A
40-49 years, female
3287.8
GTEX-131XE-1126-SM-5EGHW
50-59 years, male
3281.3
GTEX-139YR-0426-SM-5IFFV
50-59 years, male
2991.3
GTEX-O5YT-0926-SM-48TDG
20-29 years, male
2942.2
GTEX-13N11-0126-SM-5KM2Z
50-59 years, female
2852.6
GTEX-UPK5-1626-SM-4JBHI
40-49 years, male
2840.6
GTEX-XV7Q-0126-SM-4BRVK
40-49 years, female
2543.4
GTEX-12WSG-0926-SM-5EGIH
50-59 years, female
2273.8
GTEX-X585-1826-SM-4QAS3
50-59 years, male
1705.1
GTEX-XQ8I-1726-SM-4BOQB
50-59 years, male
1618.6
Show all
SPLEEN - FANTOM5 CAGEi
Tissue data obtained through Cap Analysis of Gene Expression (CAGE) are reported as Tags Per Million, generated by the FANTOM5 project. More information can be found here.
 The Human Protein Atlas project is funded


 MENU
MENU