We use cookies to enhance the usability of our website. If you continue, we'll assume that you are happy to receive all cookies. More information. Don't show this again.
RNA expression shows average values based on RNA-seq data generated by HPA, the Genotype-Tissue Expression (GTEx) consortium or the FANTOM5 consortium.
The RNA-seq details section shows detailed information about the individual samples used for the transcript profiling and results of the RNA-seq analysis.
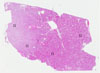
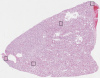
Information about each individual sample is listed below, including gender, age, a tissue section image and estimated fractions of cell types. TPM (transcripts per million) values give a quantification of the gene abundance which is comparable between different genes and samples.
Cells in tubules: 60 Cells in glomeruli: 20 Fibroblasts: 5 Other cell types: 15
Female, age 67
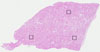
Sample 2 TPM: 14833.4
Cell types%
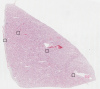
Cells in tubules: 70 Cells in glomeruli: 15 Fibroblasts: 10 Other cell types: 5
Female, age 55
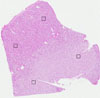
Sample 3 TPM: 16015.4
Cell types%
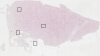
Cells in tubules: 80 Cells in glomeruli: 10 Fibroblasts: 5 Other cell types: 5
Male, age 46
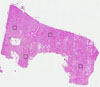
Sample 4 TPM: 18830
Cell types%
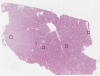
Cells in tubules: 60 Cells in glomeruli: 25 Fibroblasts: 5 Other cell types: 10
Female, age 57
Sample 5 TPM: 33686.6
Cell types%
Cells in tubules: 60 Cells in glomeruli: 10 Fibroblasts: 10 Other cell types: 20
Male, age 78
Sample 6 TPM: 15317.4
Cell types%
Cells in tubules: 65 Cells in glomeruli: 10 Fibroblasts: 5 Other cell types: 20
Male, age 73
Sample 7 TPM: 21149
Cell types%
Cells in tubules: 60 Cells in glomeruli: 10 Fibroblasts: 10 Other cell types: 20
Female, age 59
Sample 8 TPM: 19322.6
Cell types%
Cells in tubules: 65 Cells in glomeruli: 10 Fibroblasts: 10 Other cell types: 15
Female, age 48
Sample 9 TPM: 14591.5
Cell types%
Cells in tubules: 60 Cells in glomeruli: 5 Fibroblasts: 10 Other cell types: 25
KIDNEY - GTEx RNA-seqi
RNA-Seq data is reported as average RPKM (reads per kilobase per million mapped reads), generated by the Genotype-Tissue Expression (GTEx) project. More information can be found on the GTEx portal.
Normal distribution across the dataset is visualized with box plots, shown as median and 25th and 75th percentiles. Points are displayed as outliers if they are above or below 1.5 times the interquartile range. RPKM values of the individual samples are presented next to the box plot.
Max RPKM: 46672.0
Min RPKM: 3551.7
Std RPKM: 11033.2
Median RPKM: 22224.3
GTEX-13OW6-1826-SM-5N9F9
50-59 years, male
46672.0
GTEX-11GS4-2326-SM-5A5KS
60-69 years, male
42632.6
GTEX-ZYFD-1526-SM-5NQ7T
50-59 years, male
40926.3
GTEX-11OF3-1326-SM-5N9FJ
60-69 years, male
40816.6
GTEX-13OVL-1826-SM-5KLZR
50-59 years, male
35970.6
GTEX-N7MS-1626-SM-3LK5F
60-69 years, male
32487.7
GTEX-12WSG-0826-SM-5EQ5A
50-59 years, female
32453.7
GTEX-T5JC-1526-SM-4DM68
20-29 years, male
31357.5
GTEX-13O1R-2526-SM-5N9FW
60-69 years, male
28897.6
GTEX-XPVG-0526-SM-4B65N
50-59 years, male
27653.4
GTEX-1497J-0826-SM-5NQAJ
60-69 years, male
25827.0
GTEX-13112-2126-SM-5GCO4
50-59 years, male
25556.2
GTEX-ZC5H-1726-SM-5HL7X
40-49 years, female
24982.0
GTEX-UPIC-1126-SM-4IHLO
20-29 years, female
24404.9
GTEX-Y5V6-2026-SM-5IFHO
60-69 years, male
23180.8
GTEX-ZYT6-2226-SM-5GIC9
30-39 years, male
22838.3
GTEX-P4QS-1126-SM-3NMD5
60-69 years, male
21610.4
GTEX-12696-0926-SM-5FQTV
60-69 years, male
21046.2
GTEX-NPJ8-2226-SM-3TW8D
40-49 years, male
20583.3
GTEX-ZYFG-1626-SM-5GZYY
60-69 years, female
17554.8
GTEX-145MN-0326-SM-5QGQI
30-39 years, male
16653.2
GTEX-QDVN-1626-SM-48TZC
50-59 years, male
15772.9
GTEX-13RTJ-2226-SM-5S2Q1
60-69 years, male
15082.3
GTEX-ZVZP-0926-SM-5GIDB
50-59 years, male
15068.9
GTEX-147F4-2626-SM-5Q5CS
50-59 years, male
14584.0
GTEX-13NYB-1726-SM-5N9G2
40-49 years, male
13078.2
GTEX-QLQW-1626-SM-4R1K1
30-39 years, male
12579.4
GTEX-RN64-1626-SM-48FD7
50-59 years, male
9589.9
GTEX-1399S-0526-SM-5IJG8
30-39 years, female
8040.6
GTEX-13OVI-1126-SM-5KLZF
60-69 years, female
7765.1
GTEX-ZLFU-0926-SM-5P9F8
40-49 years, male
6612.1
GTEX-11TTK-1926-SM-5PNW8
60-69 years, female
3551.7
Show all
KIDNEY - FANTOM5 CAGEi
Tissue data obtained through Cap Analysis of Gene Expression (CAGE) are reported as Tags Per Million, generated by the FANTOM5 project. More information can be found here.
 The Human Protein Atlas project is funded


 MENU
MENU