We use cookies to enhance the usability of our website. If you continue, we'll assume that you are happy to receive all cookies. More information. Don't show this again.
The protein expression bar, with the units not detected (n), low (l), medium (m) and high (h), is based on a best estimate of the true protein expression for proteins where the antibody staining pattern has been analyzed by knowledge-based annotation. For genes where more than one antibody has been used, a collective score is set. For details, see Assays & annotation.
h
m
l
n
RNA expressioni
RNA expression shows average values based on RNA-seq data generated by HPA, the Genotype-Tissue Expression (GTEx) consortium or the FANTOM5 consortium.
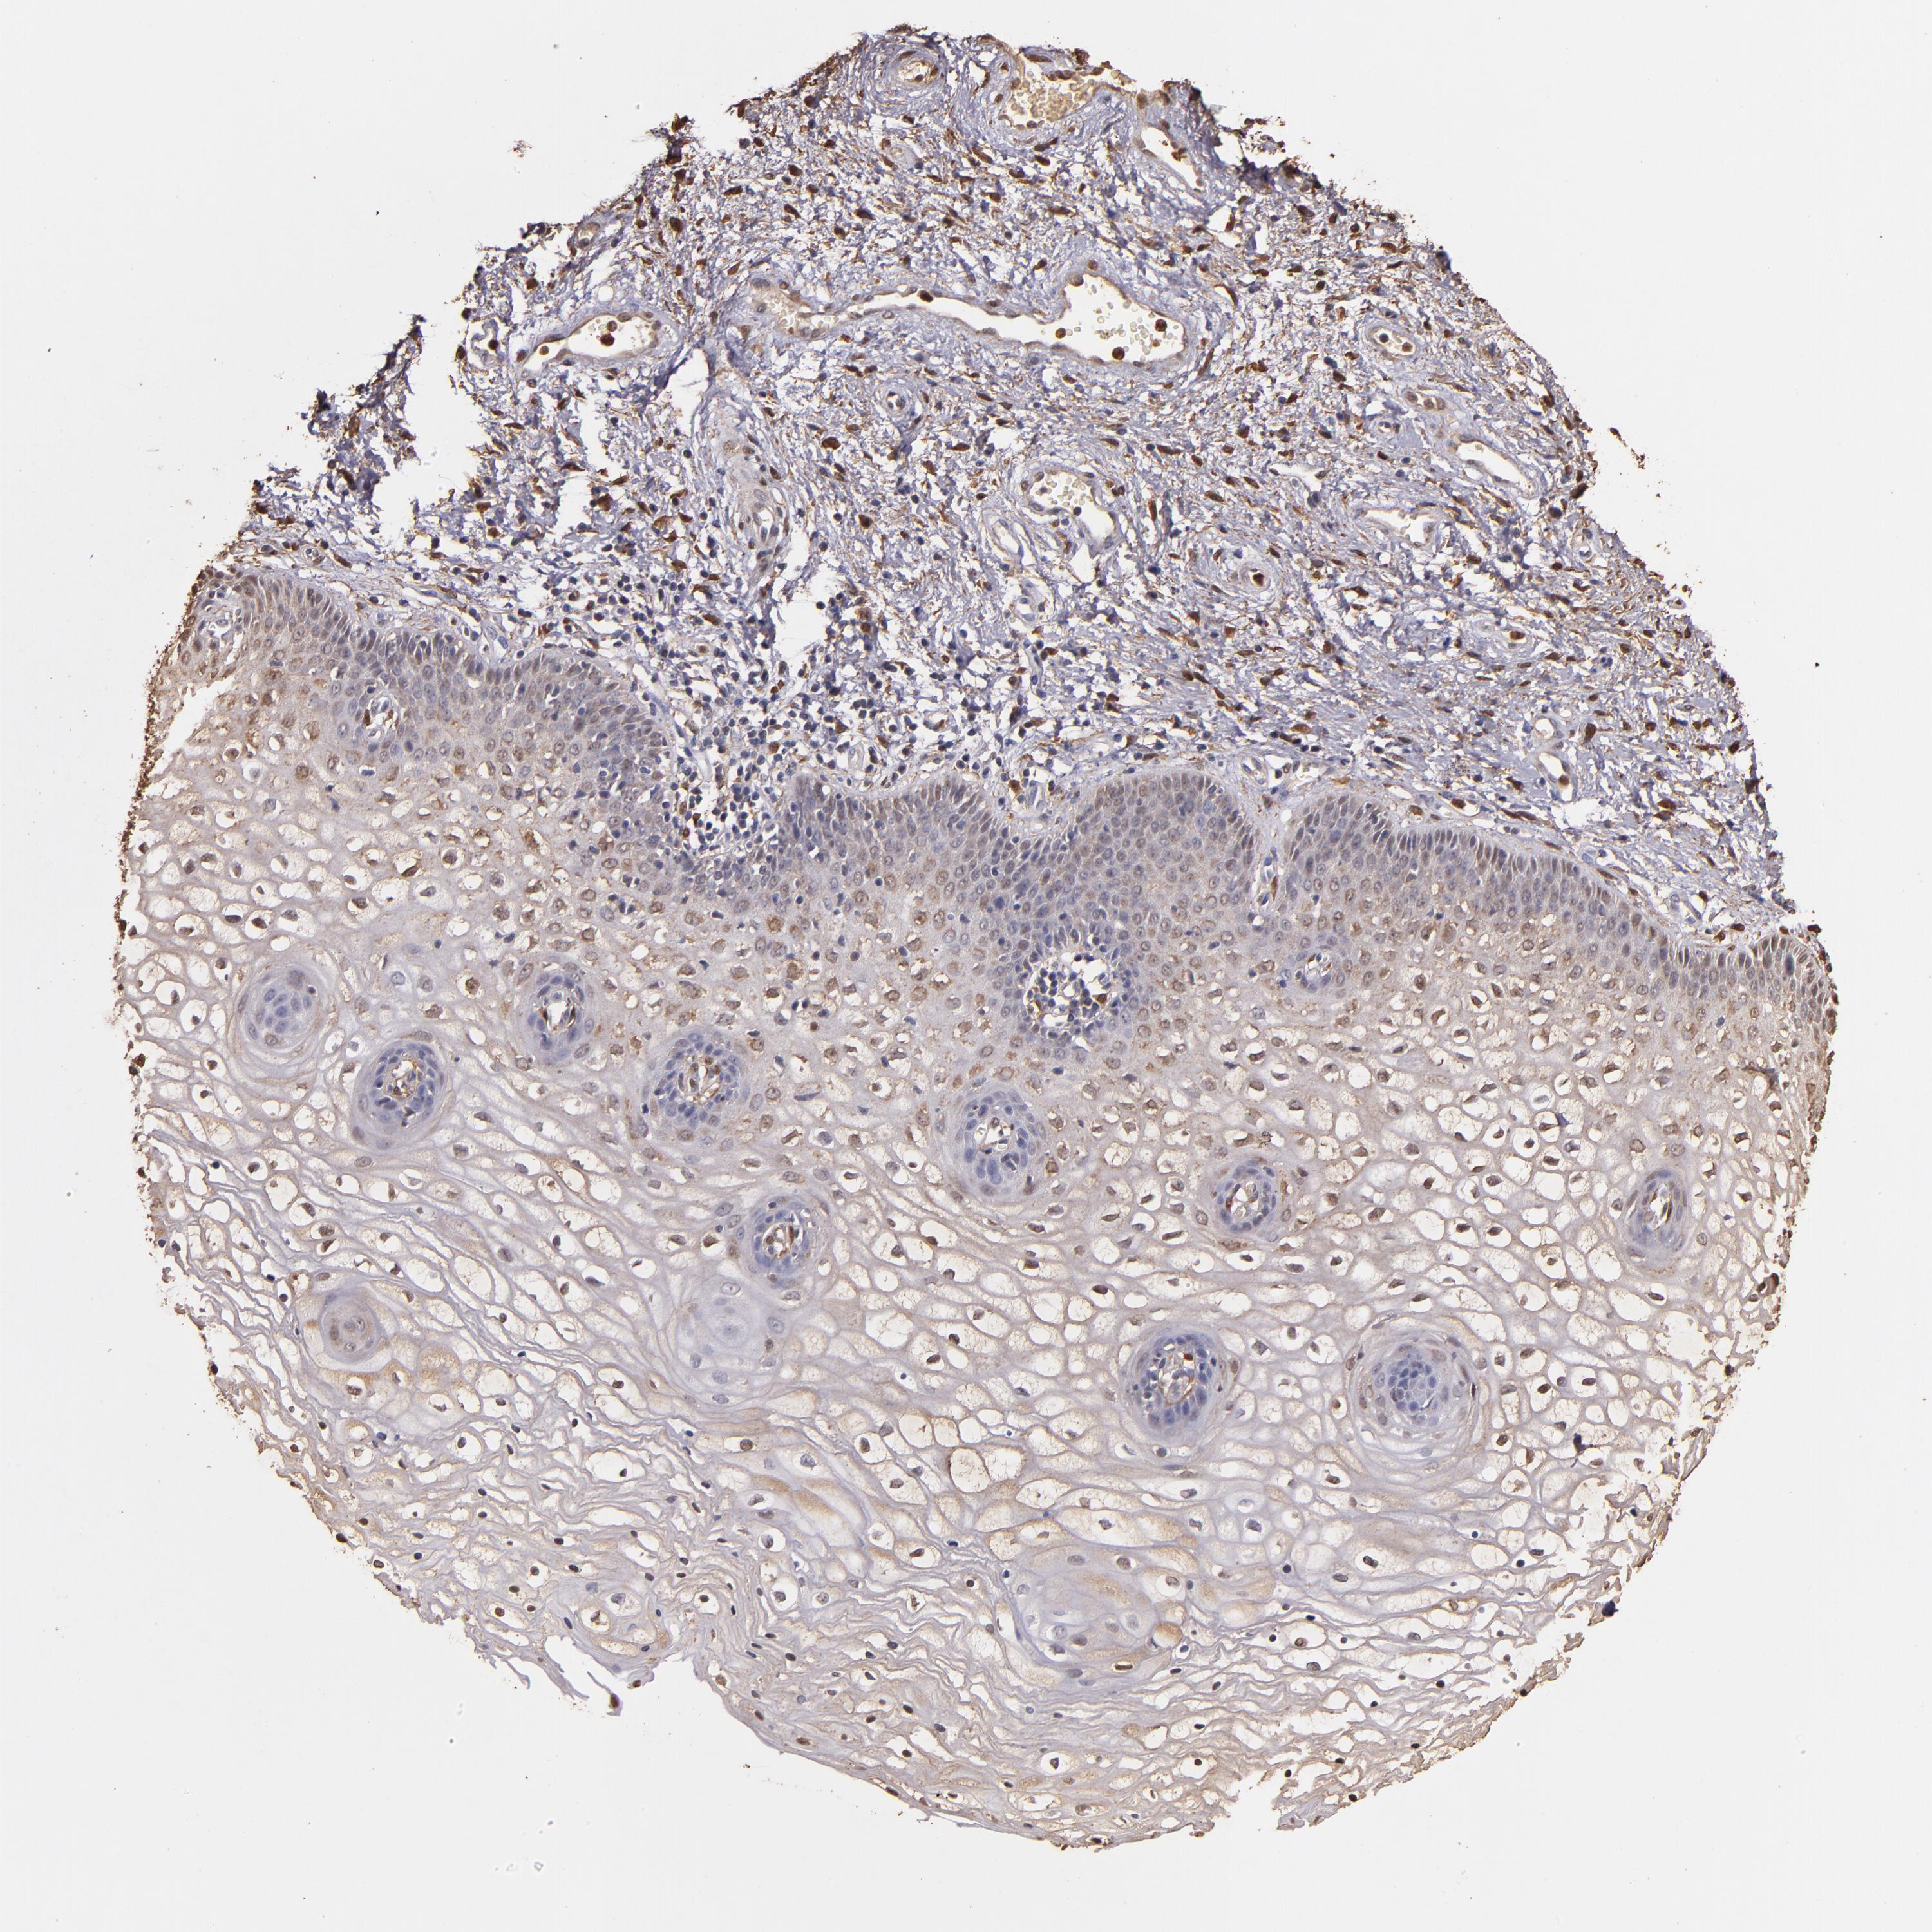
The detailed normal tissue page shows images of the stained tissue, together with antibody staining and expression level of the cell types. A knowledge-based annotated protein expression is provided for each cell type at the top of the page and the staining level of the individual antibodies is given underneath each antibody ID.
Samples from up to three different individuals have been stained for each antibody. The gender, age and tissue characterization are reported for each individual (patient) and are viewable when clicking on the image for magnification.
The images can be clicked for an enlarged view that can be panned. From the enlarged view, all stained images for all antibodies can be browsed (represented by miniature images). The miniature image with an orange overlay is the currently displayed image.
This score describes the level of antibody staining observed in the annotated cell types as not detected, low, medium, or high. It is based on the staining intensity and fraction of stained cells.
The RNA-seq details section shows detailed information about the individual samples used for the transcript profiling and results of the RNA-seq analysis.
Information about each individual sample is listed below, including gender, age, a tissue section image and estimated fractions of cell types. TPM (transcripts per million) values give a quantification of the gene abundance which is comparable between different genes and samples.
RNA-Seq data is reported as average RPKM (reads per kilobase per million mapped reads), generated by the Genotype-Tissue Expression (GTEx) project. More information can be found on the GTEx portal.
Normal distribution across the dataset is visualized with box plots, shown as median and 25th and 75th percentiles. Points are displayed as outliers if they are above or below 1.5 times the interquartile range. RPKM values of the individual samples are presented next to the box plot.
Max RPKM: 1148.7
Min RPKM: 109.9
Std RPKM: 210.9
Median RPKM: 573.5
GTEX-ZYVF-0326-SM-5GIES
50-59 years, female
1148.7
GTEX-11DXX-1726-SM-5H11T
60-69 years, female
1129.7
GTEX-12ZZX-1926-SM-5EGKC
40-49 years, female
1046.1
GTEX-ZAJG-2926-SM-5HL8P
50-59 years, female
933.6
GTEX-ZP4G-0826-SM-4WWF3
20-29 years, female
919.0
GTEX-QCQG-1226-SM-48U23
50-59 years, female
914.6
GTEX-ZVT3-2726-SM-5GU5X
60-69 years, female
907.8
GTEX-WEY5-0826-SM-4LMIH
40-49 years, female
896.2
GTEX-ZV6S-1326-SM-59HJA
40-49 years, female
888.2
GTEX-RU1J-1426-SM-46MUV
20-29 years, female
860.1
GTEX-146FR-2426-SM-5NQAU
60-69 years, female
853.4
GTEX-YFC4-2926-SM-5IFJ8
40-49 years, female
843.5
GTEX-12WSD-2926-SM-5LZUH
60-69 years, female
834.9
GTEX-11EM3-1826-SM-5A5KO
20-29 years, female
810.0
GTEX-TMMY-1926-SM-4DXUU
40-49 years, female
806.7
GTEX-UJHI-1326-SM-4IHJO
50-59 years, female
799.2
GTEX-X15G-1926-SM-4PQZQ
50-59 years, female
787.7
GTEX-12WSJ-1326-SM-5GCOB
40-49 years, female
784.3
GTEX-X8HC-2826-SM-46MWJ
50-59 years, female
771.9
GTEX-W5WG-1026-SM-4LMIF
50-59 years, female
769.3
GTEX-113JC-1926-SM-5N9GE
50-59 years, female
768.4
GTEX-XV7Q-1626-SM-4BRWC
40-49 years, female
758.6
GTEX-13QIC-1826-SM-5J1MY
60-69 years, female
755.5
GTEX-T2IS-1926-SM-4DM74
20-29 years, female
751.4
GTEX-12WSB-2426-SM-5EGJC
60-69 years, female
747.8
GTEX-WRHU-2926-SM-4MVNQ
50-59 years, female
747.3
GTEX-147F3-1526-SM-5SIAK
50-59 years, female
746.2
GTEX-ZLWG-1126-SM-4WWFQ
50-59 years, female
735.2
GTEX-QDT8-2526-SM-48TYX
30-39 years, female
733.8
GTEX-PX3G-2526-SM-48TZV
20-29 years, female
719.3
GTEX-ZVT2-0626-SM-5GICR
50-59 years, female
718.2
GTEX-ZE7O-2426-SM-57WD7
50-59 years, female
705.9
GTEX-13PVR-1426-SM-5S2PW
60-69 years, female
703.5
GTEX-13OVI-0926-SM-5J1MI
60-69 years, female
701.6
GTEX-11GSP-2226-SM-5HL5Q
60-69 years, female
698.9
GTEX-ZQG8-1126-SM-51MRL
60-69 years, female
664.0
GTEX-ZYWO-2026-SM-5GIDA
40-49 years, female
663.9
GTEX-131YS-2426-SM-5J2OD
60-69 years, female
654.8
GTEX-P4PP-2526-SM-3P61P
30-39 years, female
654.3
GTEX-13D11-1326-SM-5IJFY
50-59 years, female
651.6
GTEX-RWS6-1726-SM-47JXP
60-69 years, female
644.4
GTEX-14A5I-2726-SM-5SIB3
50-59 years, female
631.3
GTEX-PWOO-2026-SM-48TDE
40-49 years, female
620.7
GTEX-ZGAY-2226-SM-4YCCX
40-49 years, female
604.9
GTEX-Q734-1426-SM-48TZQ
40-49 years, female
602.0
GTEX-131XG-2126-SM-5DUXG
50-59 years, female
593.6
GTEX-13N11-1526-SM-5L3FL
50-59 years, female
591.7
GTEX-P78B-2226-SM-3P5ZZ
40-49 years, female
573.6
GTEX-146FH-2626-SM-5Q5E1
50-59 years, female
573.4
GTEX-NL3G-2526-SM-4SOIE
60-69 years, female
569.8
GTEX-PWN1-2526-SM-48TDS
40-49 years, female
565.4
GTEX-XUJ4-1626-SM-4BONV
60-69 years, female
564.1
GTEX-S4UY-1326-SM-4AD4X
40-49 years, female
557.9
GTEX-Y114-1926-SM-4TT8J
50-59 years, female
542.6
GTEX-13QBU-1726-SM-5IJFQ
40-49 years, female
538.5
GTEX-ZYY3-2626-SM-5N9DH
60-69 years, female
536.6
GTEX-S4P3-1126-SM-4AD52
50-59 years, female
535.7
GTEX-XUW1-0326-SM-4BOOR
50-59 years, female
530.1
GTEX-13U4I-2026-SM-5LU3L
40-49 years, female
510.2
GTEX-U3ZN-0926-SM-4DXTU
30-39 years, female
500.0
GTEX-YJ8O-1226-SM-5P9JE
40-49 years, female
499.9
GTEX-11TTK-2726-SM-5GU58
60-69 years, female
494.1
GTEX-13W3W-2326-SM-5LU4Y
60-69 years, female
492.3
GTEX-PLZ4-2726-SM-3P61A
50-59 years, female
491.9
GTEX-TSE9-2526-SM-4DXUS
60-69 years, female
488.8
GTEX-Y8LW-1426-SM-5RQJJ
50-59 years, female
488.5
GTEX-11EMC-1926-SM-5A5JU
60-69 years, female
472.6
GTEX-14DAQ-2326-SM-5S2QX
60-69 years, female
471.4
GTEX-OHPL-2526-SM-3MJGT
60-69 years, female
469.2
GTEX-N7MT-1926-SM-3LK5N
60-69 years, female
455.3
GTEX-11P81-2126-SM-5HL6N
30-39 years, female
452.2
GTEX-TML8-1126-SM-4DXSS
40-49 years, female
439.7
GTEX-QVJO-2526-SM-4R1KB
60-69 years, female
432.8
GTEX-11VI4-0726-SM-5GU5B
40-49 years, female
429.6
GTEX-11XUK-1326-SM-5EQM4
40-49 years, female
428.6
GTEX-145ME-1426-SM-5RQJS
40-49 years, female
424.9
GTEX-UPIC-1426-SM-4IHLQ
20-29 years, female
422.7
GTEX-ZTPG-2226-SM-57WF9
20-29 years, female
420.2
GTEX-1399U-1526-SM-5J2N7
50-59 years, female
419.5
GTEX-14BMU-1926-SM-5S2QC
20-29 years, female
400.8
GTEX-T6MO-1226-SM-4DM5S
40-49 years, female
393.5
GTEX-Y3IK-2226-SM-4YCD4
50-59 years, female
371.9
GTEX-1399S-2326-SM-5K7YV
30-39 years, female
349.0
GTEX-PWCY-1726-SM-48TD3
20-29 years, female
309.2
GTEX-11I78-2026-SM-5987C
50-59 years, female
308.9
GTEX-ZZPU-2226-SM-5EGIV
50-59 years, female
299.2
GTEX-S7SF-1426-SM-4AT5A
20-29 years, female
297.2
GTEX-S341-1226-SM-4AD5S
40-49 years, female
292.7
GTEX-SE5C-1126-SM-4BRWZ
40-49 years, female
288.2
GTEX-13PL7-2726-SM-5L3GB
60-69 years, female
284.7
GTEX-ZXES-0626-SM-5E45P
30-39 years, female
284.0
GTEX-ZC5H-2226-SM-4WAWS
40-49 years, female
281.8
GTEX-OHPK-2526-SM-3MJH9
50-59 years, female
256.8
GTEX-132AR-1626-SM-5EGHP
50-59 years, female
237.9
GTEX-1117F-2526-SM-5GZY6
60-69 years, female
215.9
GTEX-14AS3-1726-SM-5RQJV
40-49 years, female
109.9
Show all
VAGINA - FANTOM5 CAGEi
Tissue data obtained through Cap Analysis of Gene Expression (CAGE) are reported as Tags Per Million, generated by the FANTOM5 project. More information can be found here.
 The Human Protein Atlas project is funded


 MENU
MENU