We use cookies to enhance the usability of our website. If you continue, we'll assume that you are happy to receive all cookies. More information. Don't show this again.
The protein expression bar, with the units not detected (n), low (l), medium (m) and high (h), is based on a best estimate of the true protein expression for proteins where the antibody staining pattern has been analyzed by knowledge-based annotation. For genes where more than one antibody has been used, a collective score is set. For details, see Assays & annotation.
h
m
l
n
RNA expressioni
RNA expression shows average values based on RNA-seq data generated by HPA, the Genotype-Tissue Expression (GTEx) consortium or the FANTOM5 consortium.
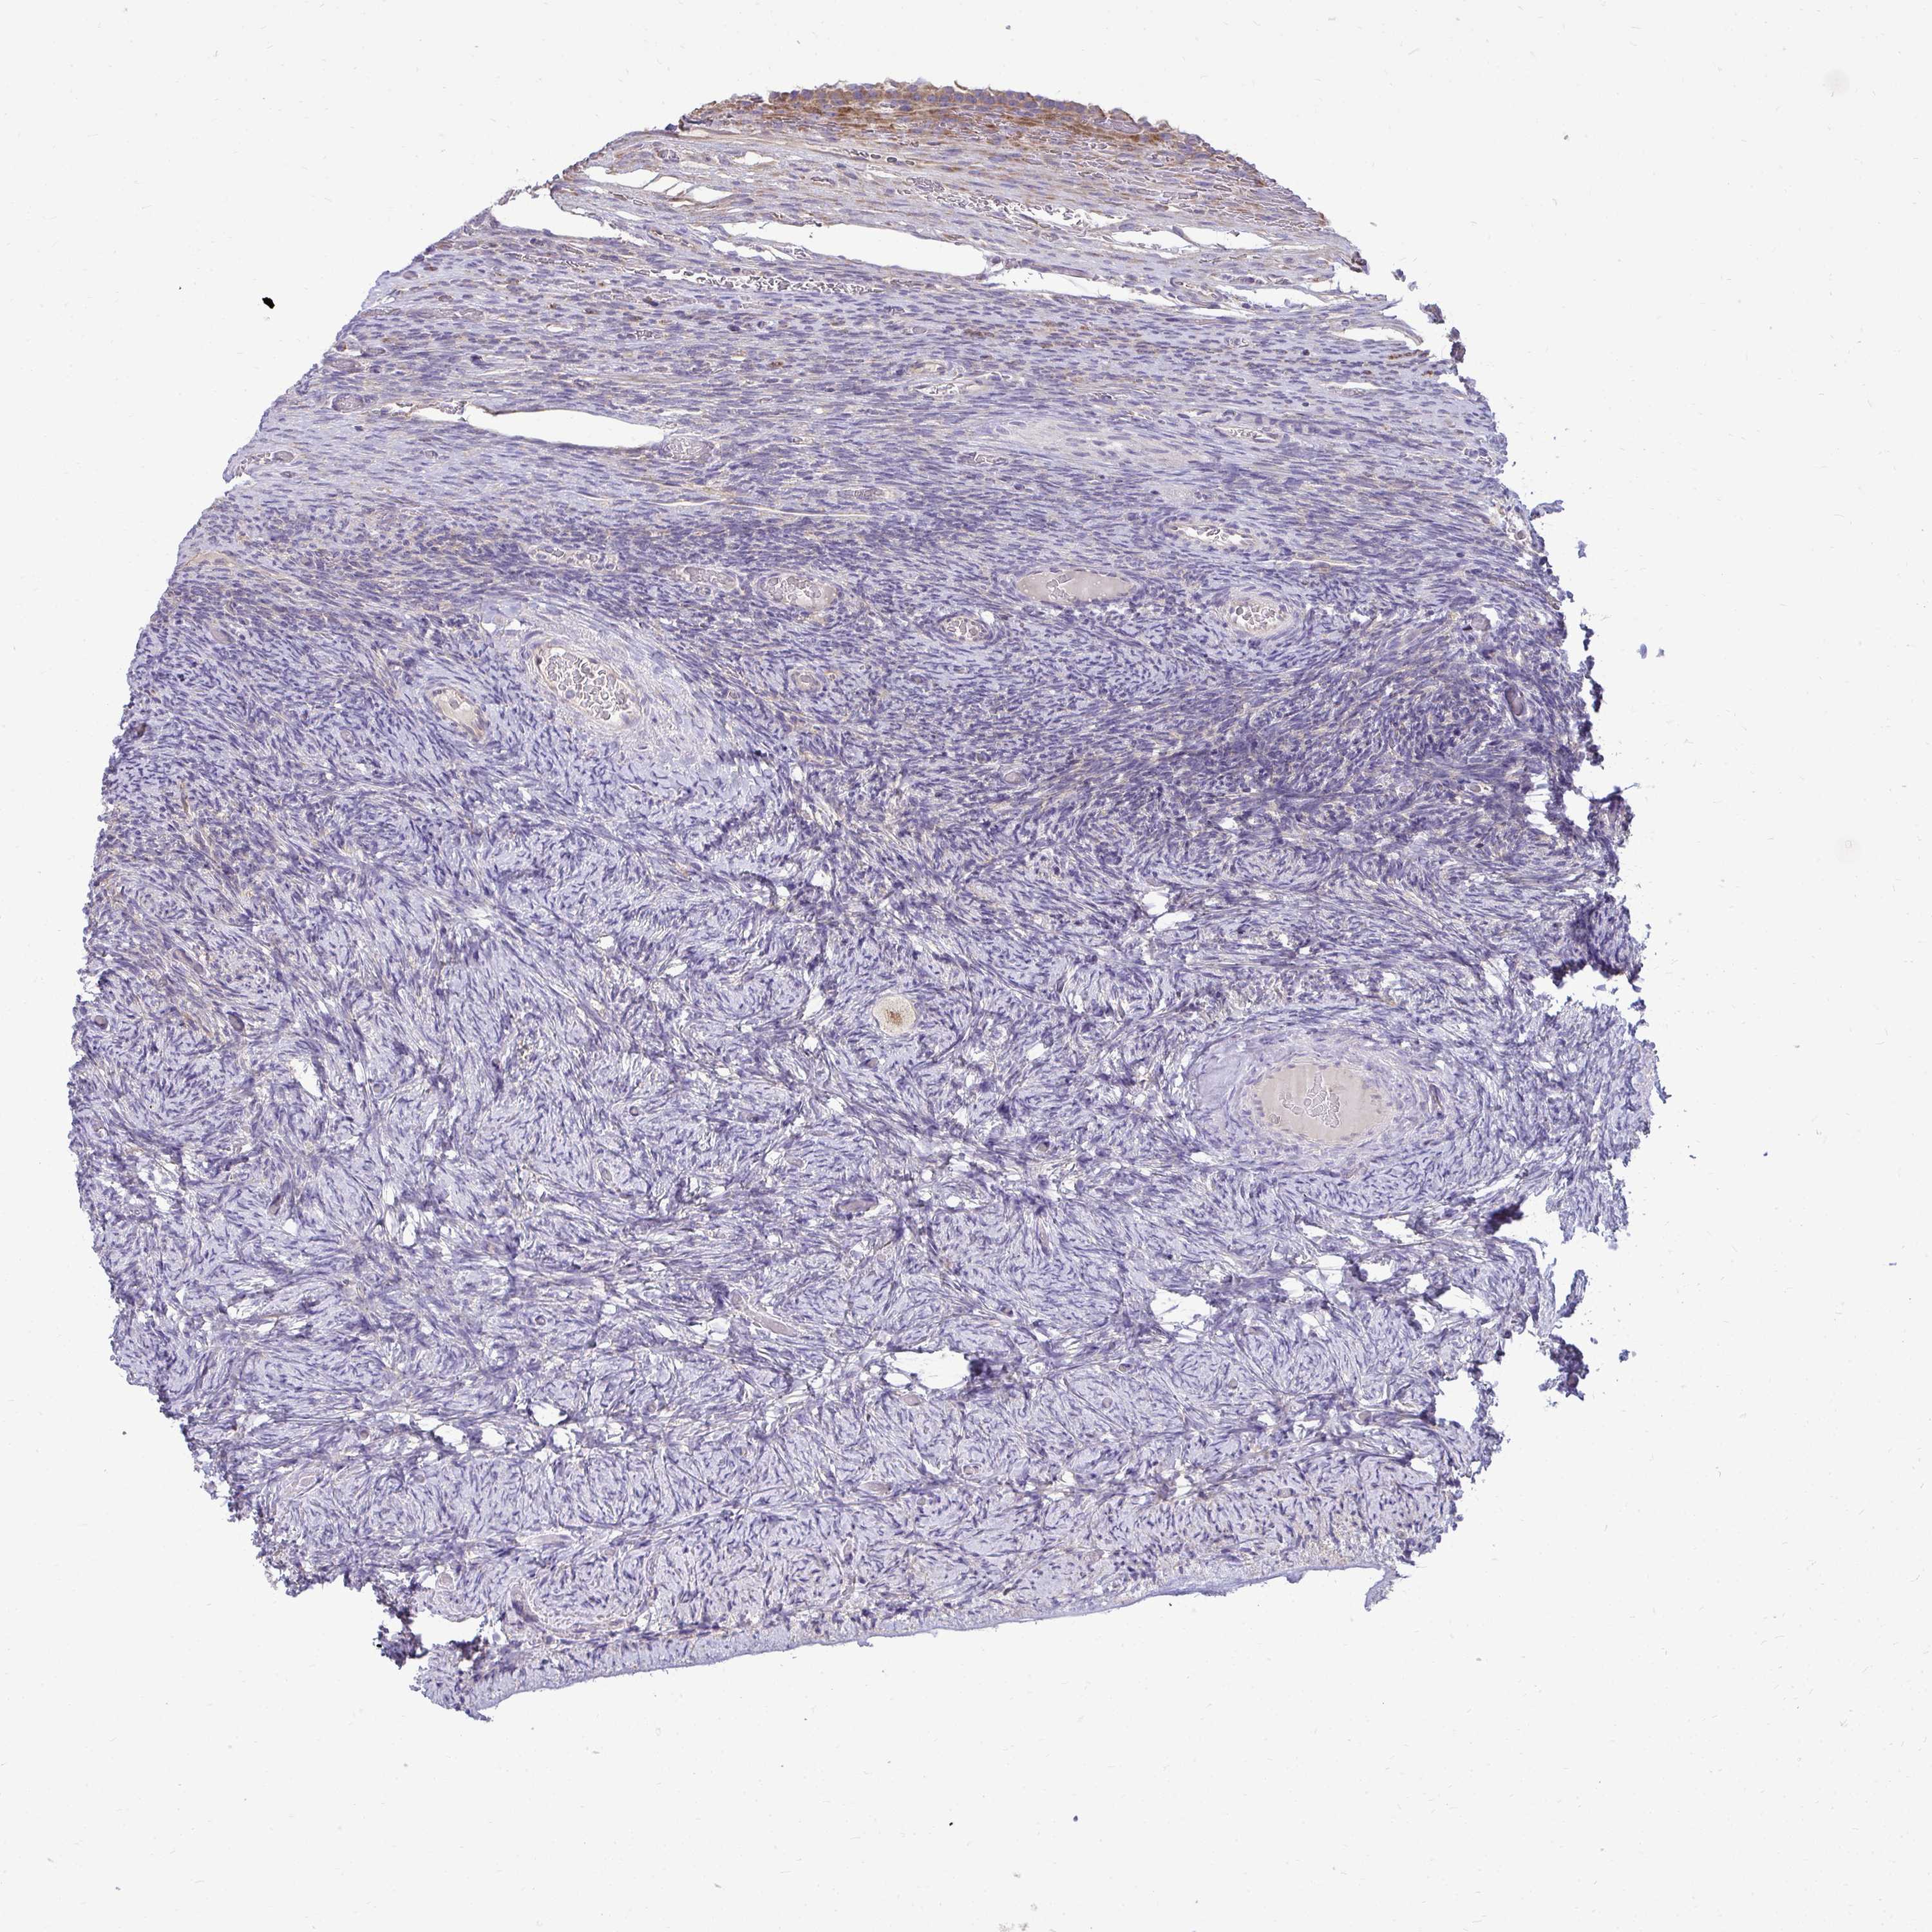
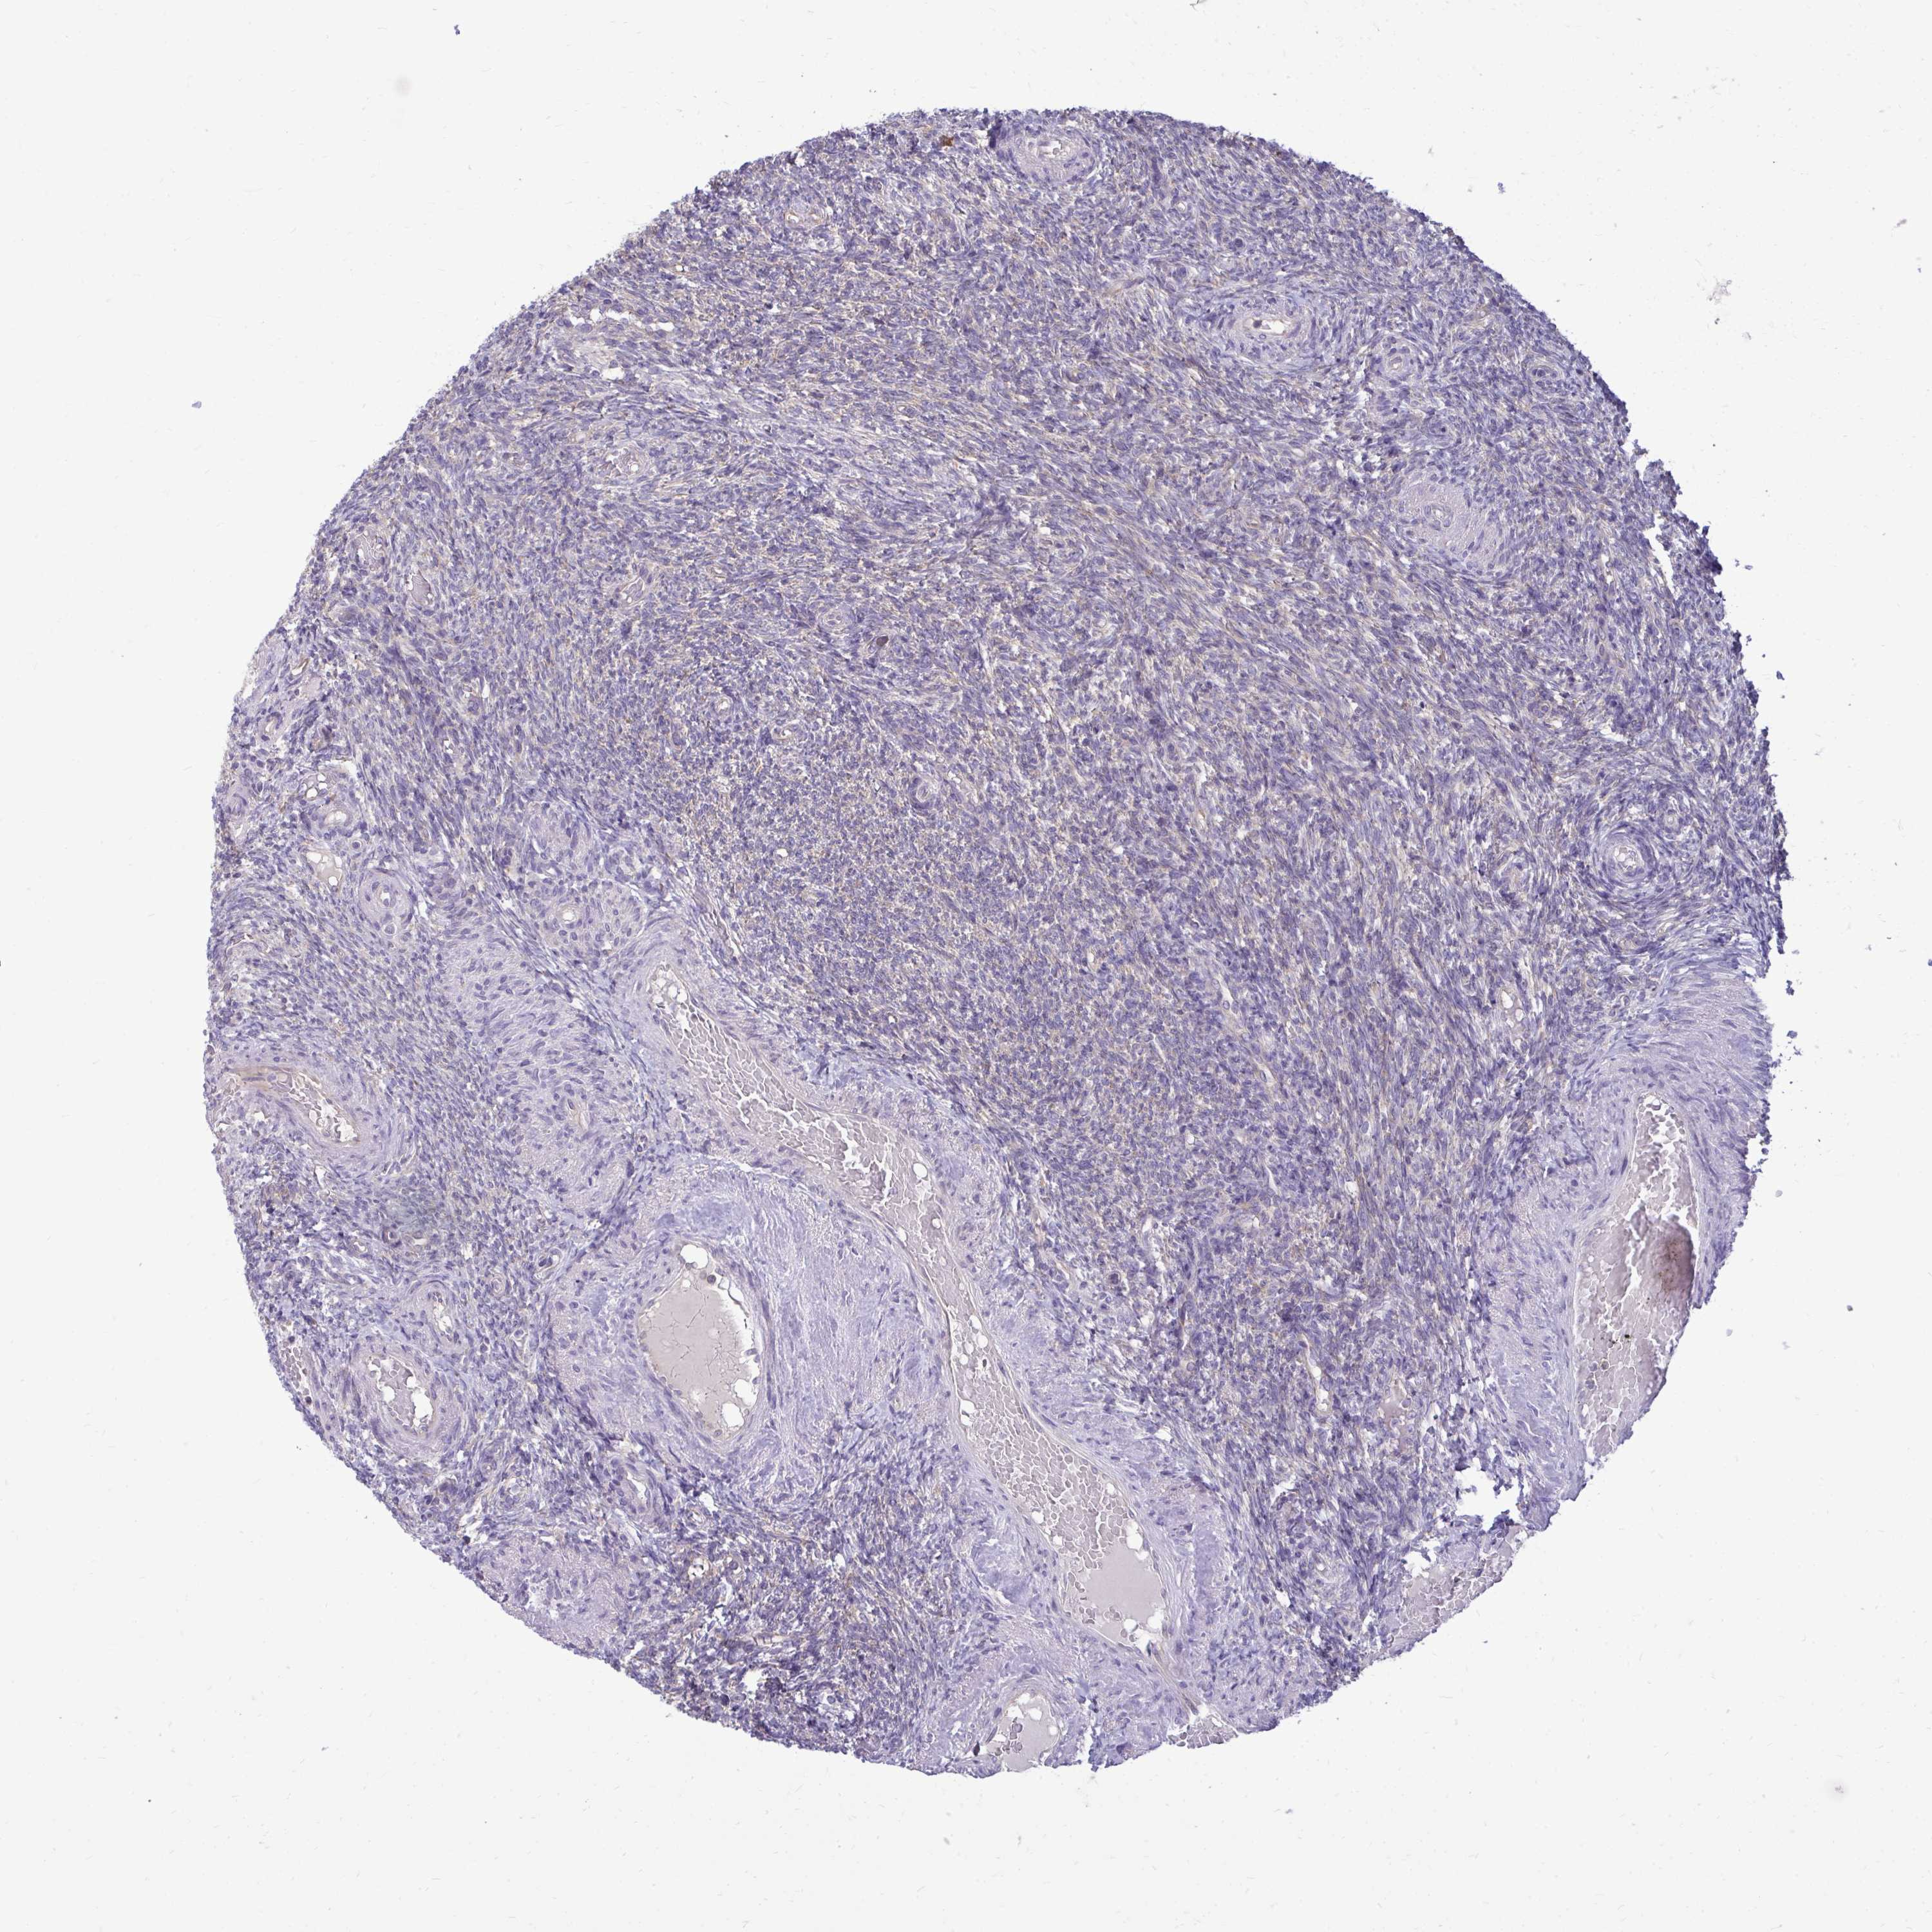
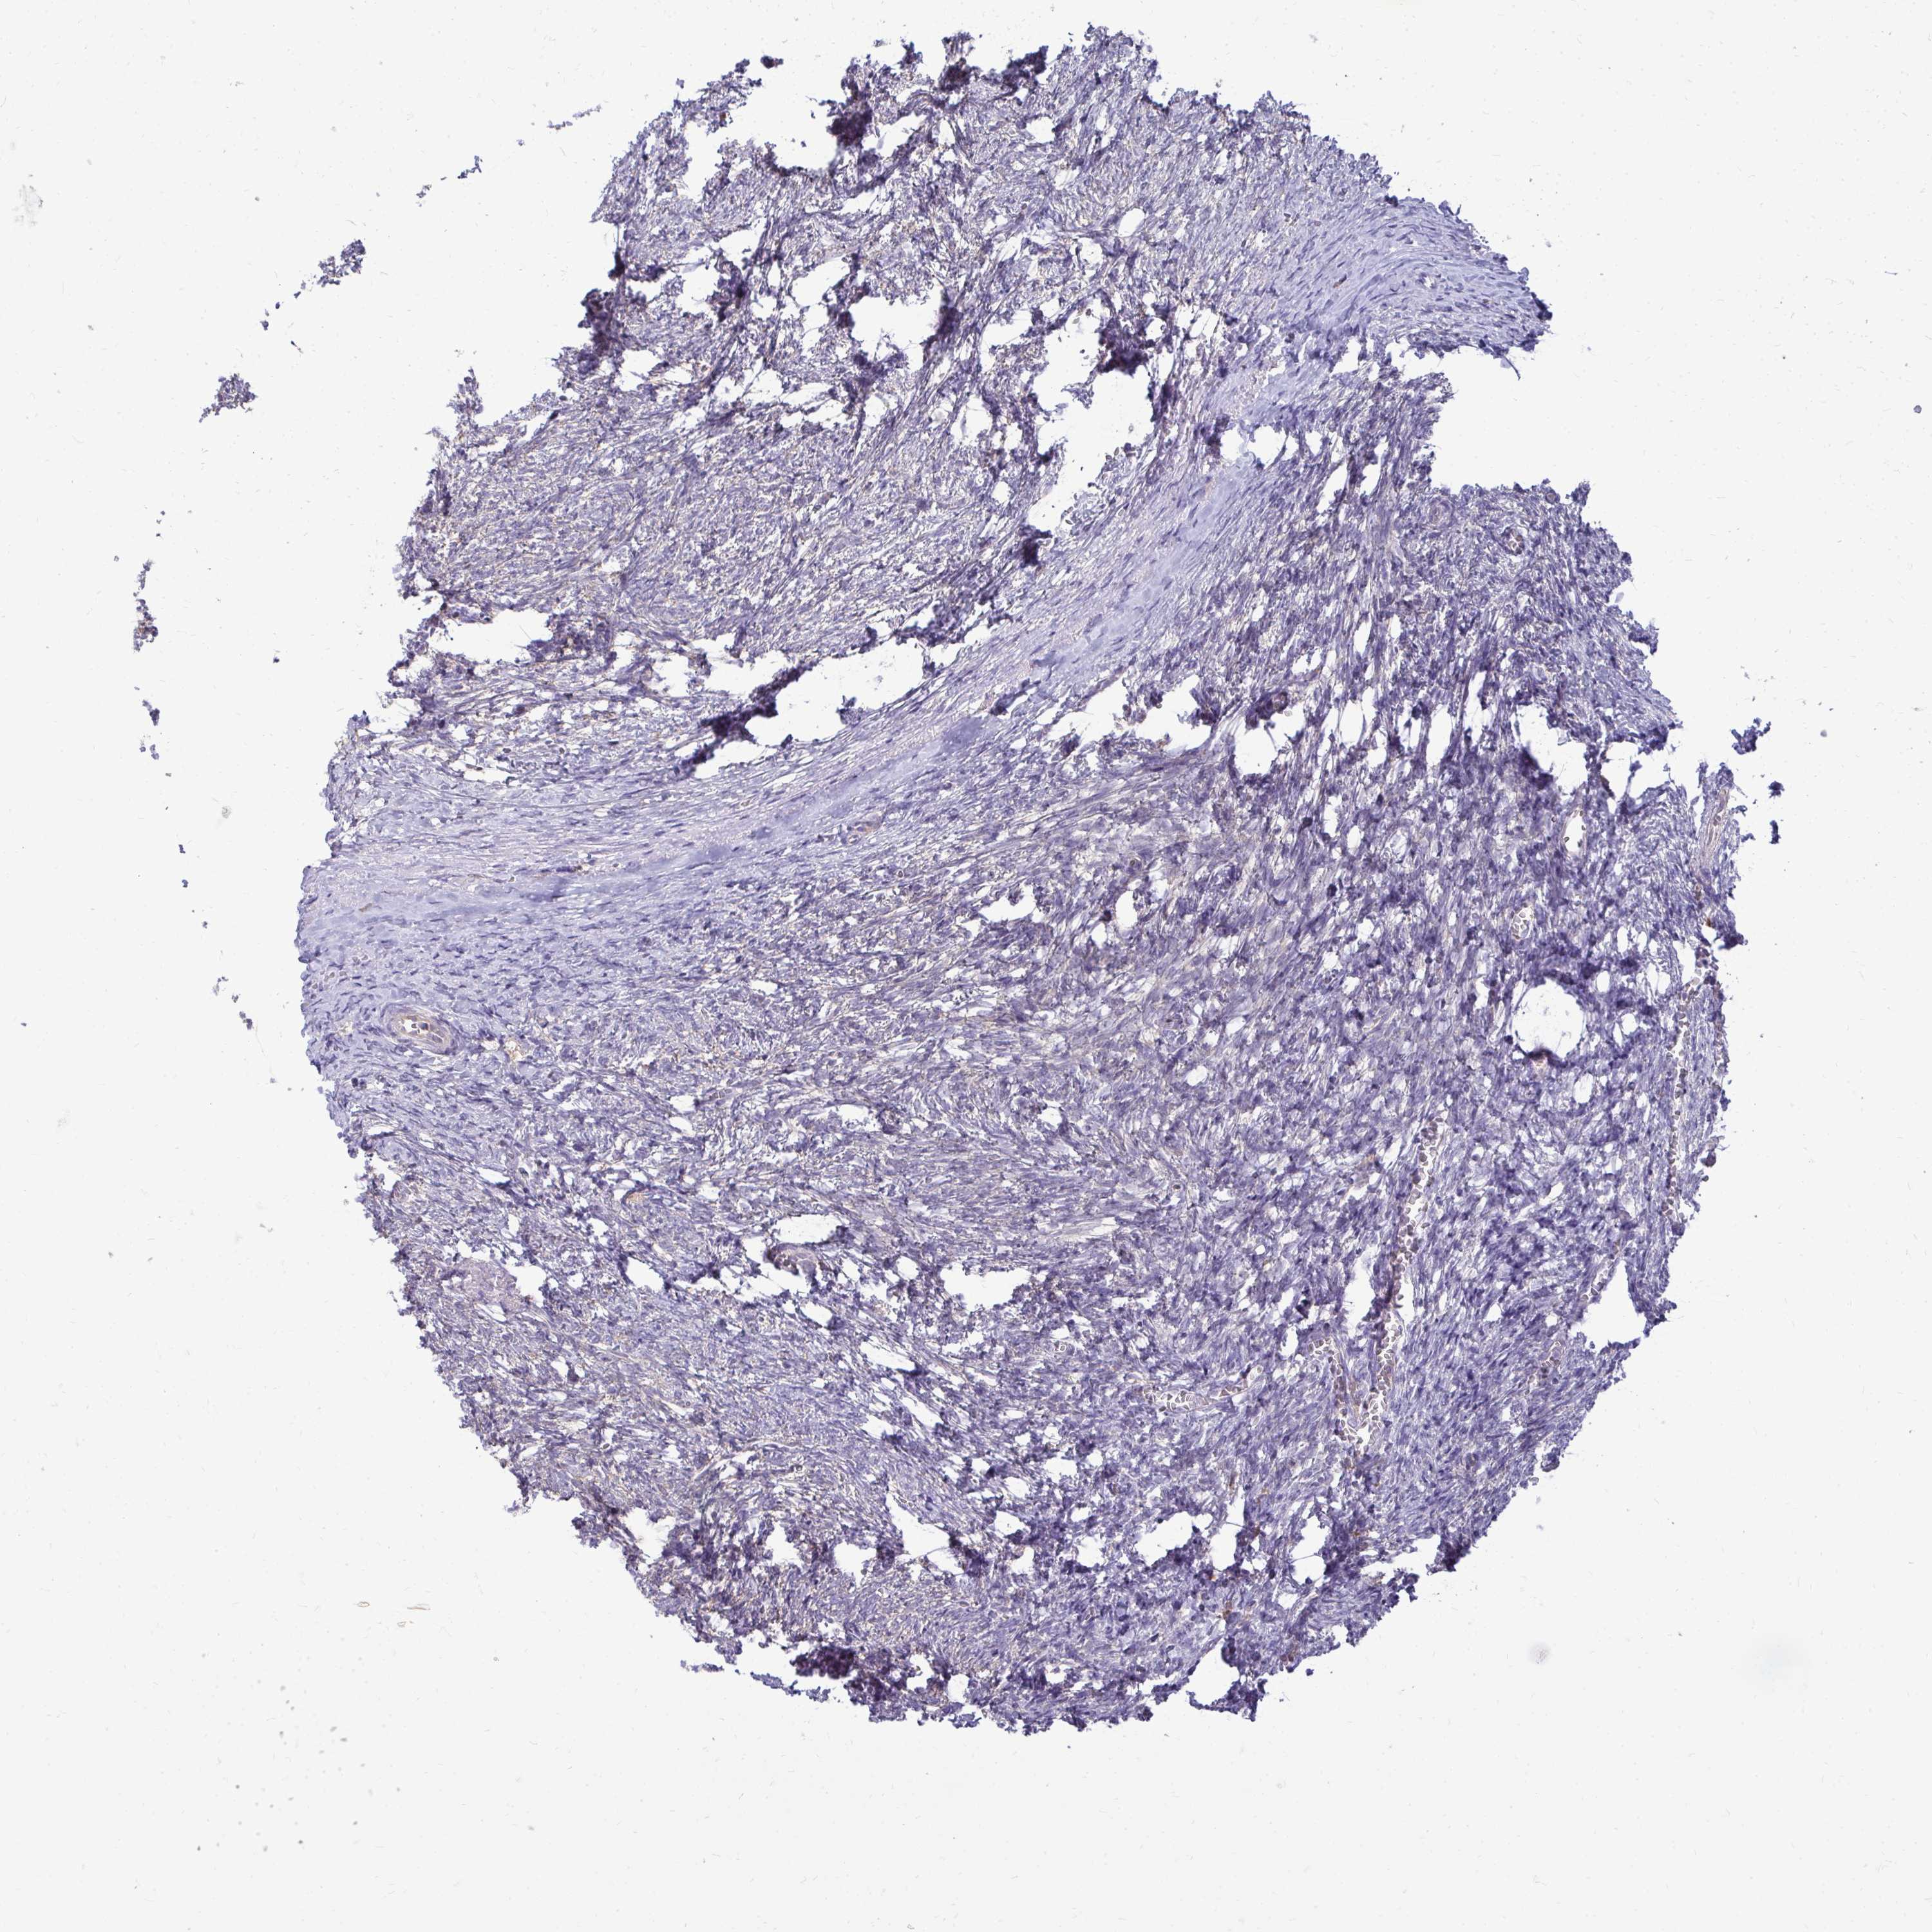
The detailed normal tissue page shows images of the stained tissue, together with antibody staining and expression level of the cell types. A knowledge-based annotated protein expression is provided for each cell type at the top of the page and the staining level of the individual antibodies is given underneath each antibody ID.
Samples from up to three different individuals have been stained for each antibody. The gender, age and tissue characterization are reported for each individual (patient) and are viewable when clicking on the image for magnification.
The images can be clicked for an enlarged view that can be panned. From the enlarged view, all stained images for all antibodies can be browsed (represented by miniature images). The miniature image with an orange overlay is the currently displayed image.
This score describes the level of antibody staining observed in the annotated cell types as not detected, low, medium, or high. It is based on the staining intensity and fraction of stained cells.
The RNA-seq details section shows detailed information about the individual samples used for the transcript profiling and results of the RNA-seq analysis.
Information about each individual sample is listed below, including gender, age, a tissue section image and estimated fractions of cell types. TPM (transcripts per million) values give a quantification of the gene abundance which is comparable between different genes and samples.
RNA-Seq data is reported as average RPKM (reads per kilobase per million mapped reads), generated by the Genotype-Tissue Expression (GTEx) project. More information can be found on the GTEx portal.
Normal distribution across the dataset is visualized with box plots, shown as median and 25th and 75th percentiles. Points are displayed as outliers if they are above or below 1.5 times the interquartile range. RPKM values of the individual samples are presented next to the box plot.
Max RPKM: 1706.7
Min RPKM: 622.2
Std RPKM: 195.6
Median RPKM: 994.2
GTEX-13OVI-0726-SM-5L3DD
60-69 years, female
1706.7
GTEX-XMD3-2326-SM-4AT5H
50-59 years, female
1488.3
GTEX-WWYW-2726-SM-4MVOP
50-59 years, female
1440.8
GTEX-11ZVC-1426-SM-5EGGA
50-59 years, female
1418.8
GTEX-PLZ4-2826-SM-3P617
50-59 years, female
1358.0
GTEX-14AS3-1326-SM-5RQJE
40-49 years, female
1290.9
GTEX-RTLS-2326-SM-46MUH
60-69 years, female
1284.7
GTEX-13X6H-1026-SM-5SIBE
50-59 years, female
1282.4
GTEX-YFC4-2726-SM-5IFJW
40-49 years, female
1271.7
GTEX-11ZTS-1926-SM-5CVLA
60-69 years, female
1236.6
GTEX-ZVT2-0326-SM-5E44G
50-59 years, female
1220.7
GTEX-YJ8O-1026-SM-5CVM5
40-49 years, female
1212.1
GTEX-RU72-2226-SM-46MUE
50-59 years, female
1206.9
GTEX-XUJ4-1326-SM-4BOQ9
60-69 years, female
1191.5
GTEX-12WSB-2226-SM-5GCOS
60-69 years, female
1191.1
GTEX-TSE9-2226-SM-4DXUR
60-69 years, female
1189.4
GTEX-13OVJ-2426-SM-5KM3I
50-59 years, female
1178.6
GTEX-ZAJG-2726-SM-5S2MU
50-59 years, female
1176.8
GTEX-U3ZN-1026-SM-4DXTC
30-39 years, female
1174.3
GTEX-UJHI-1226-SM-4IHLR
50-59 years, female
1160.1
GTEX-11EMC-1726-SM-5H11P
60-69 years, female
1132.0
GTEX-ZYWO-1926-SM-5E456
40-49 years, female
1131.1
GTEX-ZZPU-2126-SM-5EGIU
50-59 years, female
1127.7
GTEX-11XUK-1626-SM-5GU5O
40-49 years, female
1127.6
GTEX-ZPIC-1426-SM-4WWCP
40-49 years, female
1117.1
GTEX-ZP4G-0626-SM-4WWF1
20-29 years, female
1107.1
GTEX-11P81-1526-SM-5P9GS
30-39 years, female
1103.9
GTEX-XUW1-0126-SM-4BOOQ
50-59 years, female
1103.5
GTEX-13U4I-2126-SM-5LU55
40-49 years, female
1100.8
GTEX-11VI4-1026-SM-5EQM1
40-49 years, female
1098.5
GTEX-XV7Q-1426-SM-4BRWA
40-49 years, female
1094.1
GTEX-QVJO-3126-SM-4R1KC
60-69 years, female
1085.7
GTEX-ZC5H-2026-SM-5CVN2
40-49 years, female
1083.8
GTEX-XYKS-1726-SM-4E3IO
60-69 years, female
1082.7
GTEX-S4P3-0926-SM-4AD54
50-59 years, female
1079.7
GTEX-PX3G-2426-SM-48TZZ
20-29 years, female
1078.3
GTEX-P78B-1926-SM-3P616
40-49 years, female
1075.5
GTEX-131YS-2226-SM-5P9G8
60-69 years, female
1073.6
GTEX-12WSJ-1226-SM-5LU91
40-49 years, female
1071.3
GTEX-11I78-1926-SM-59878
50-59 years, female
1055.1
GTEX-S341-0726-SM-4AD5R
40-49 years, female
1053.2
GTEX-TMMY-1726-SM-4DXTD
40-49 years, female
1051.9
GTEX-1269C-1826-SM-5N9E1
60-69 years, female
1049.7
GTEX-PWCY-1326-SM-48TCU
20-29 years, female
1028.1
GTEX-145ME-1226-SM-5SIB6
40-49 years, female
1018.0
GTEX-12ZZX-2026-SM-5LZV9
40-49 years, female
1016.4
GTEX-13QBU-1526-SM-5LU3W
40-49 years, female
1015.4
GTEX-ZYY3-2726-SM-5EGH4
60-69 years, female
999.5
GTEX-T2IS-2026-SM-4DM6W
20-29 years, female
994.2
GTEX-12WSG-1426-SM-5FQUK
50-59 years, female
985.9
GTEX-139D8-2426-SM-5KM3A
30-39 years, female
980.8
GTEX-13N11-0526-SM-5IJFI
50-59 years, female
977.3
GTEX-ZLWG-0926-SM-4WWC3
50-59 years, female
966.6
GTEX-RWS6-1026-SM-47JXD
60-69 years, female
965.4
GTEX-S32W-1226-SM-4AD67
50-59 years, female
963.8
GTEX-OHPL-2426-SM-48TDN
60-69 years, female
954.4
GTEX-Y3IK-2026-SM-4YCDG
50-59 years, female
949.9
GTEX-X15G-1726-SM-4PQZN
50-59 years, female
944.7
GTEX-PWN1-2426-SM-48TDD
40-49 years, female
935.3
GTEX-OHPK-2426-SM-3MJGH
50-59 years, female
915.1
GTEX-12WSD-2726-SM-59HLR
60-69 years, female
914.2
GTEX-11GSP-0226-SM-5A5KV
60-69 years, female
912.8
GTEX-Q734-0726-SM-48TZP
40-49 years, female
911.2
GTEX-13PL7-2326-SM-5L3FY
60-69 years, female
904.4
GTEX-QCQG-1426-SM-48U22
50-59 years, female
901.0
GTEX-13VXT-1526-SM-5LU3J
20-29 years, female
899.2
GTEX-Y114-1726-SM-4TT7U
50-59 years, female
898.1
GTEX-13PVR-1226-SM-5RQJ2
60-69 years, female
890.9
GTEX-132AR-1426-SM-5IFF1
50-59 years, female
890.6
GTEX-P4PP-2426-SM-3P61L
30-39 years, female
882.5
GTEX-W5WG-0926-SM-4RTX9
50-59 years, female
880.0
GTEX-ZVT3-2626-SM-5GU5L
60-69 years, female
858.5
GTEX-11DXX-1426-SM-5GIDU
60-69 years, female
856.9
GTEX-11EM3-1726-SM-5N9D1
20-29 years, female
854.0
GTEX-13D11-1126-SM-5KLYS
50-59 years, female
852.4
GTEX-ZYFG-1726-SM-5GZZB
60-69 years, female
846.2
GTEX-1313W-2726-SM-5P9IX
50-59 years, female
839.2
GTEX-12WSK-1926-SM-5LZVK
40-49 years, female
823.8
GTEX-T6MO-1126-SM-4DM5D
40-49 years, female
815.9
GTEX-T5JW-0426-SM-4DM7M
20-29 years, female
812.3
GTEX-X8HC-2726-SM-46MUA
50-59 years, female
801.2
GTEX-XUZC-1026-SM-4BOPY
30-39 years, female
801.1
GTEX-11ZTT-1826-SM-5CVLN
60-69 years, female
799.6
GTEX-P4QT-2426-SM-3NMCL
50-59 years, female
791.0
GTEX-1399S-2126-SM-5J2MH
30-39 years, female
779.6
GTEX-133LE-1226-SM-5IFGC
20-29 years, female
779.2
GTEX-POMQ-1426-SM-3P61D
20-29 years, female
769.5
GTEX-S7SF-1326-SM-4AD4P
20-29 years, female
758.9
GTEX-RU1J-0826-SM-46MUU
20-29 years, female
749.0
GTEX-13QIC-1526-SM-5IJFL
60-69 years, female
742.1
GTEX-TML8-0926-SM-4DXSJ
40-49 years, female
741.9
GTEX-146FH-2526-SM-5Q5BP
50-59 years, female
727.5
GTEX-13O3O-2726-SM-5KM35
60-69 years, female
724.2
GTEX-WI4N-2526-SM-4OOSE
40-49 years, female
715.8
GTEX-13W3W-1526-SM-5LU5I
60-69 years, female
679.8
GTEX-X4EO-2426-SM-4QASD
60-69 years, female
655.5
GTEX-13FTX-0926-SM-5IFF7
20-29 years, female
622.2
Show all
OVARY - FANTOM5 CAGEi
Tissue data obtained through Cap Analysis of Gene Expression (CAGE) are reported as Tags Per Million, generated by the FANTOM5 project. More information can be found here.
 The Human Protein Atlas project is funded


 MENU
MENU