We use cookies to enhance the usability of our website. If you continue, we'll assume that you are happy to receive all cookies. More information. Don't show this again.
The protein expression bar, with the units not detected (n), low (l), medium (m) and high (h), is based on a best estimate of the true protein expression for proteins where the antibody staining pattern has been analyzed by knowledge-based annotation. For genes where more than one antibody has been used, a collective score is set. For details, see Assays & annotation.
h
m
l
n
RNA expressioni
RNA expression shows average values based on RNA-seq data generated by HPA, the Genotype-Tissue Expression (GTEx) consortium or the FANTOM5 consortium.
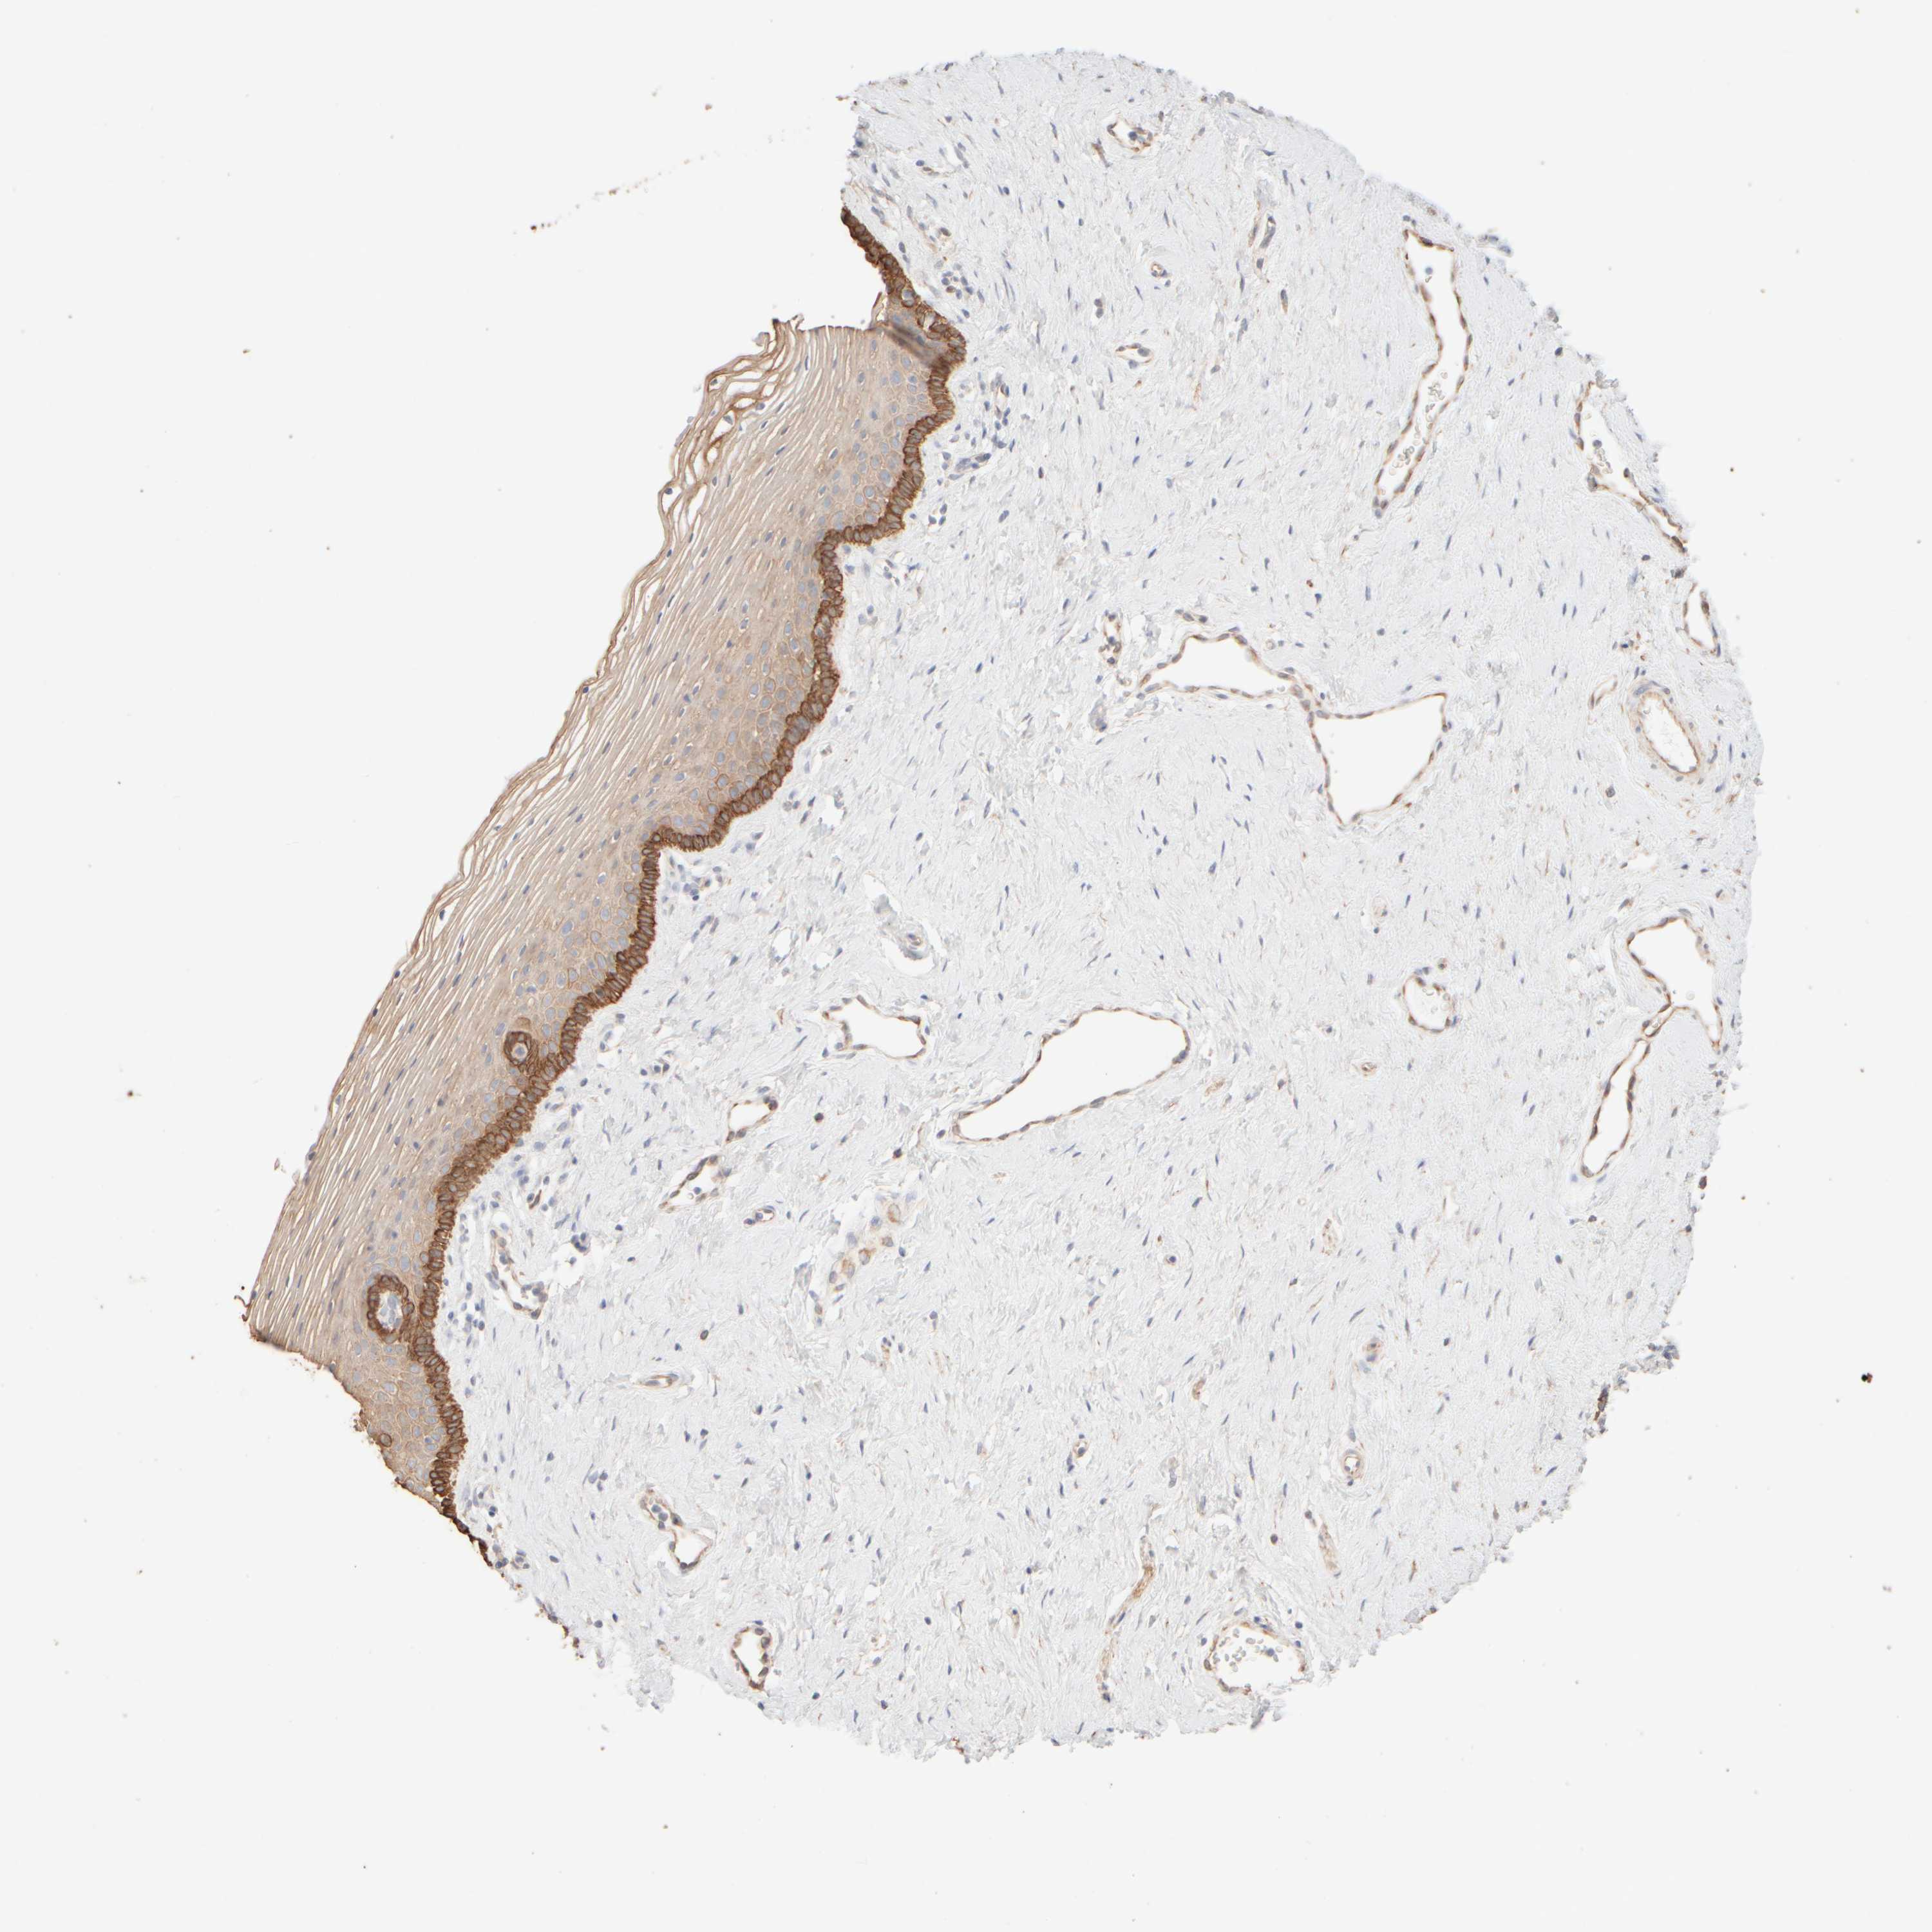
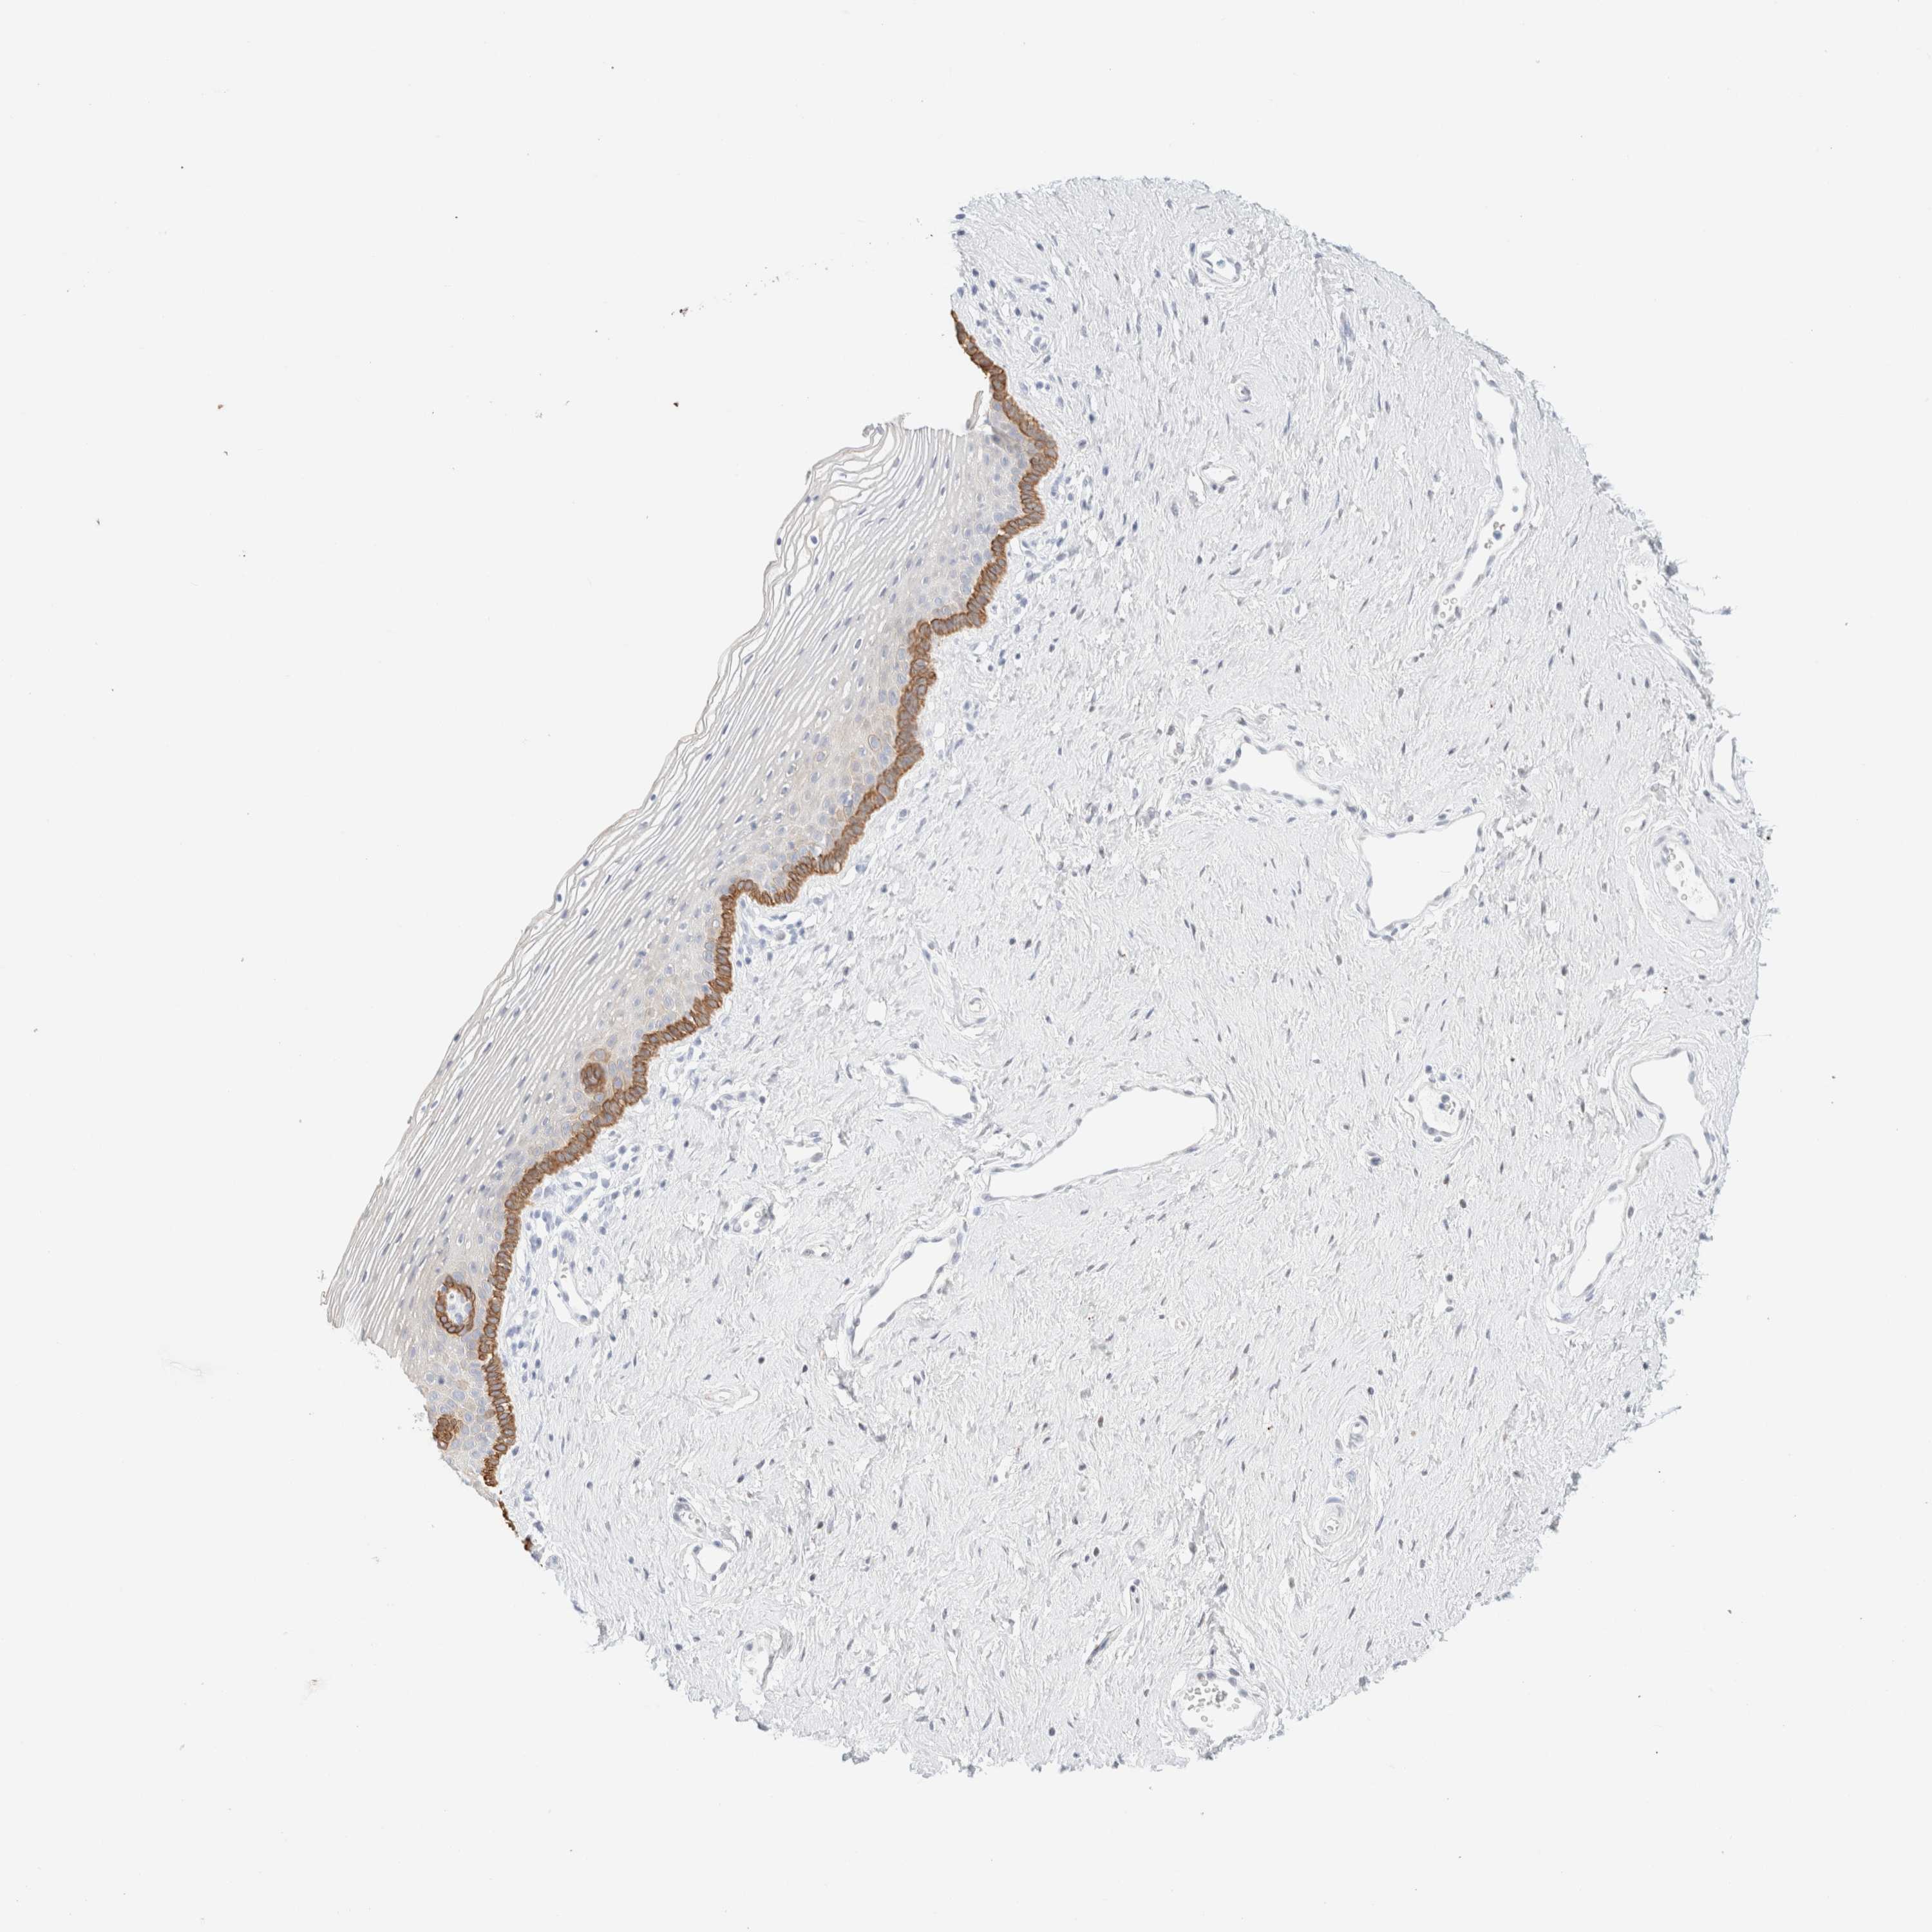
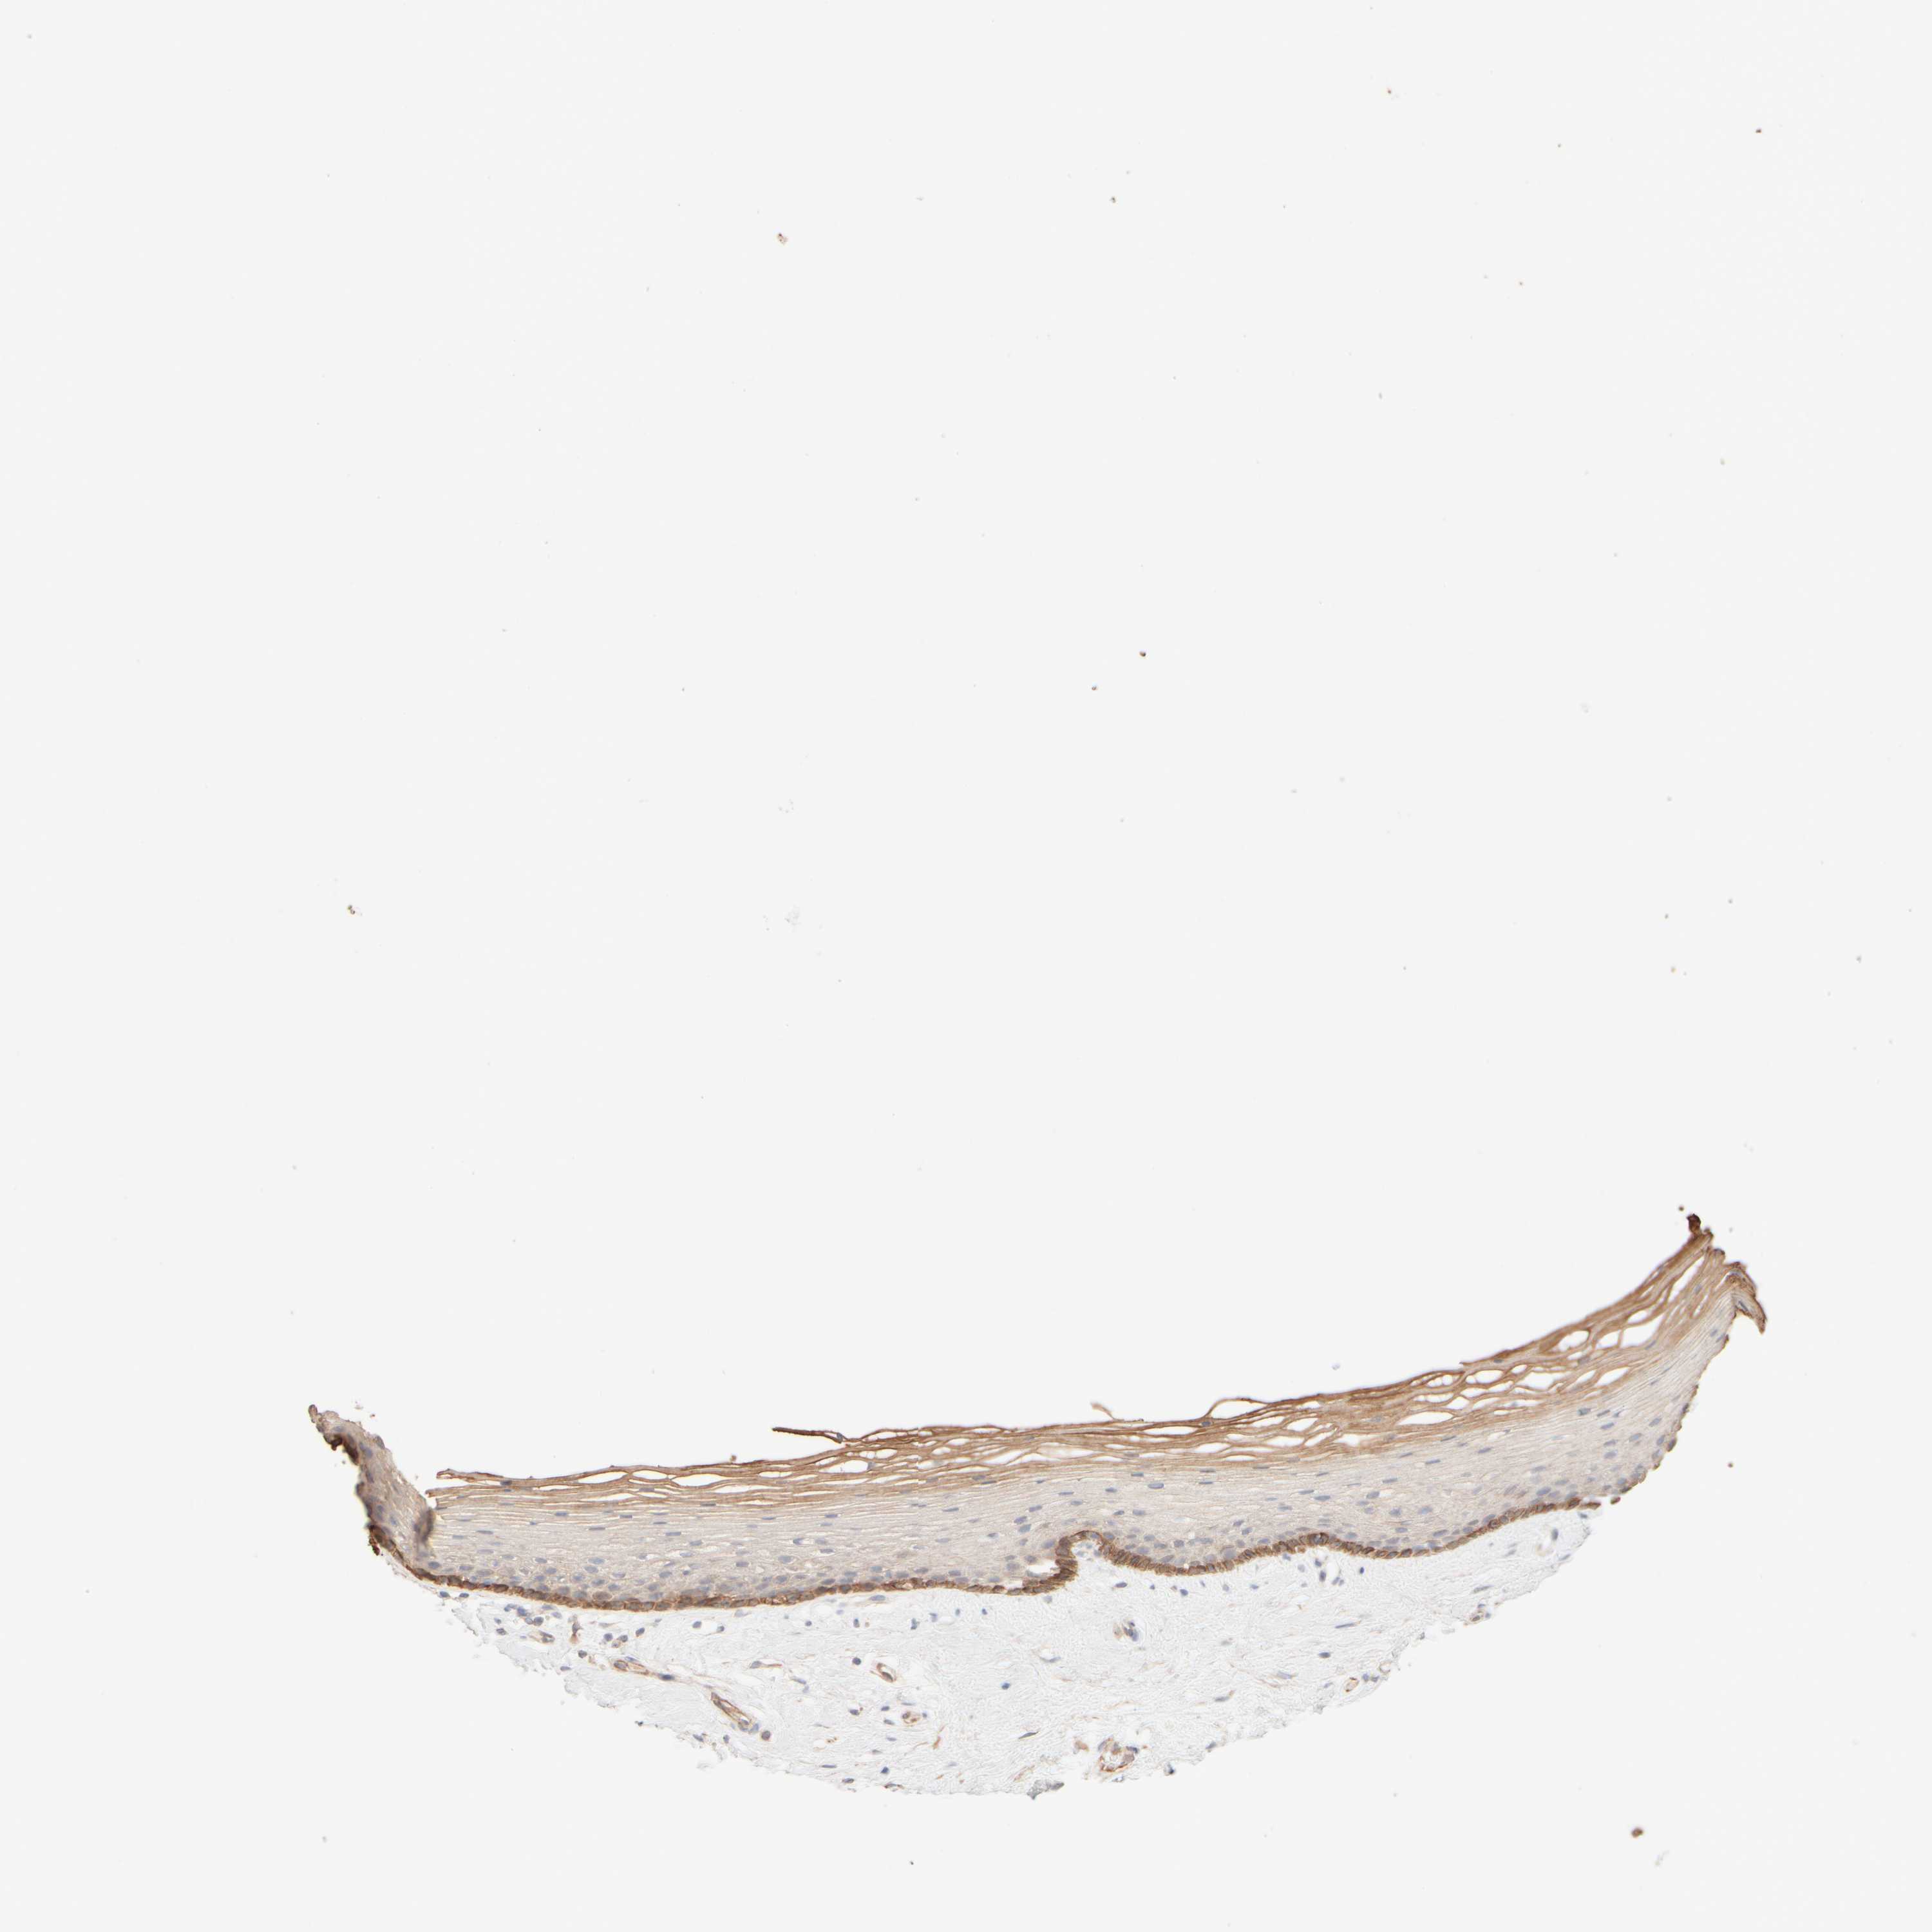
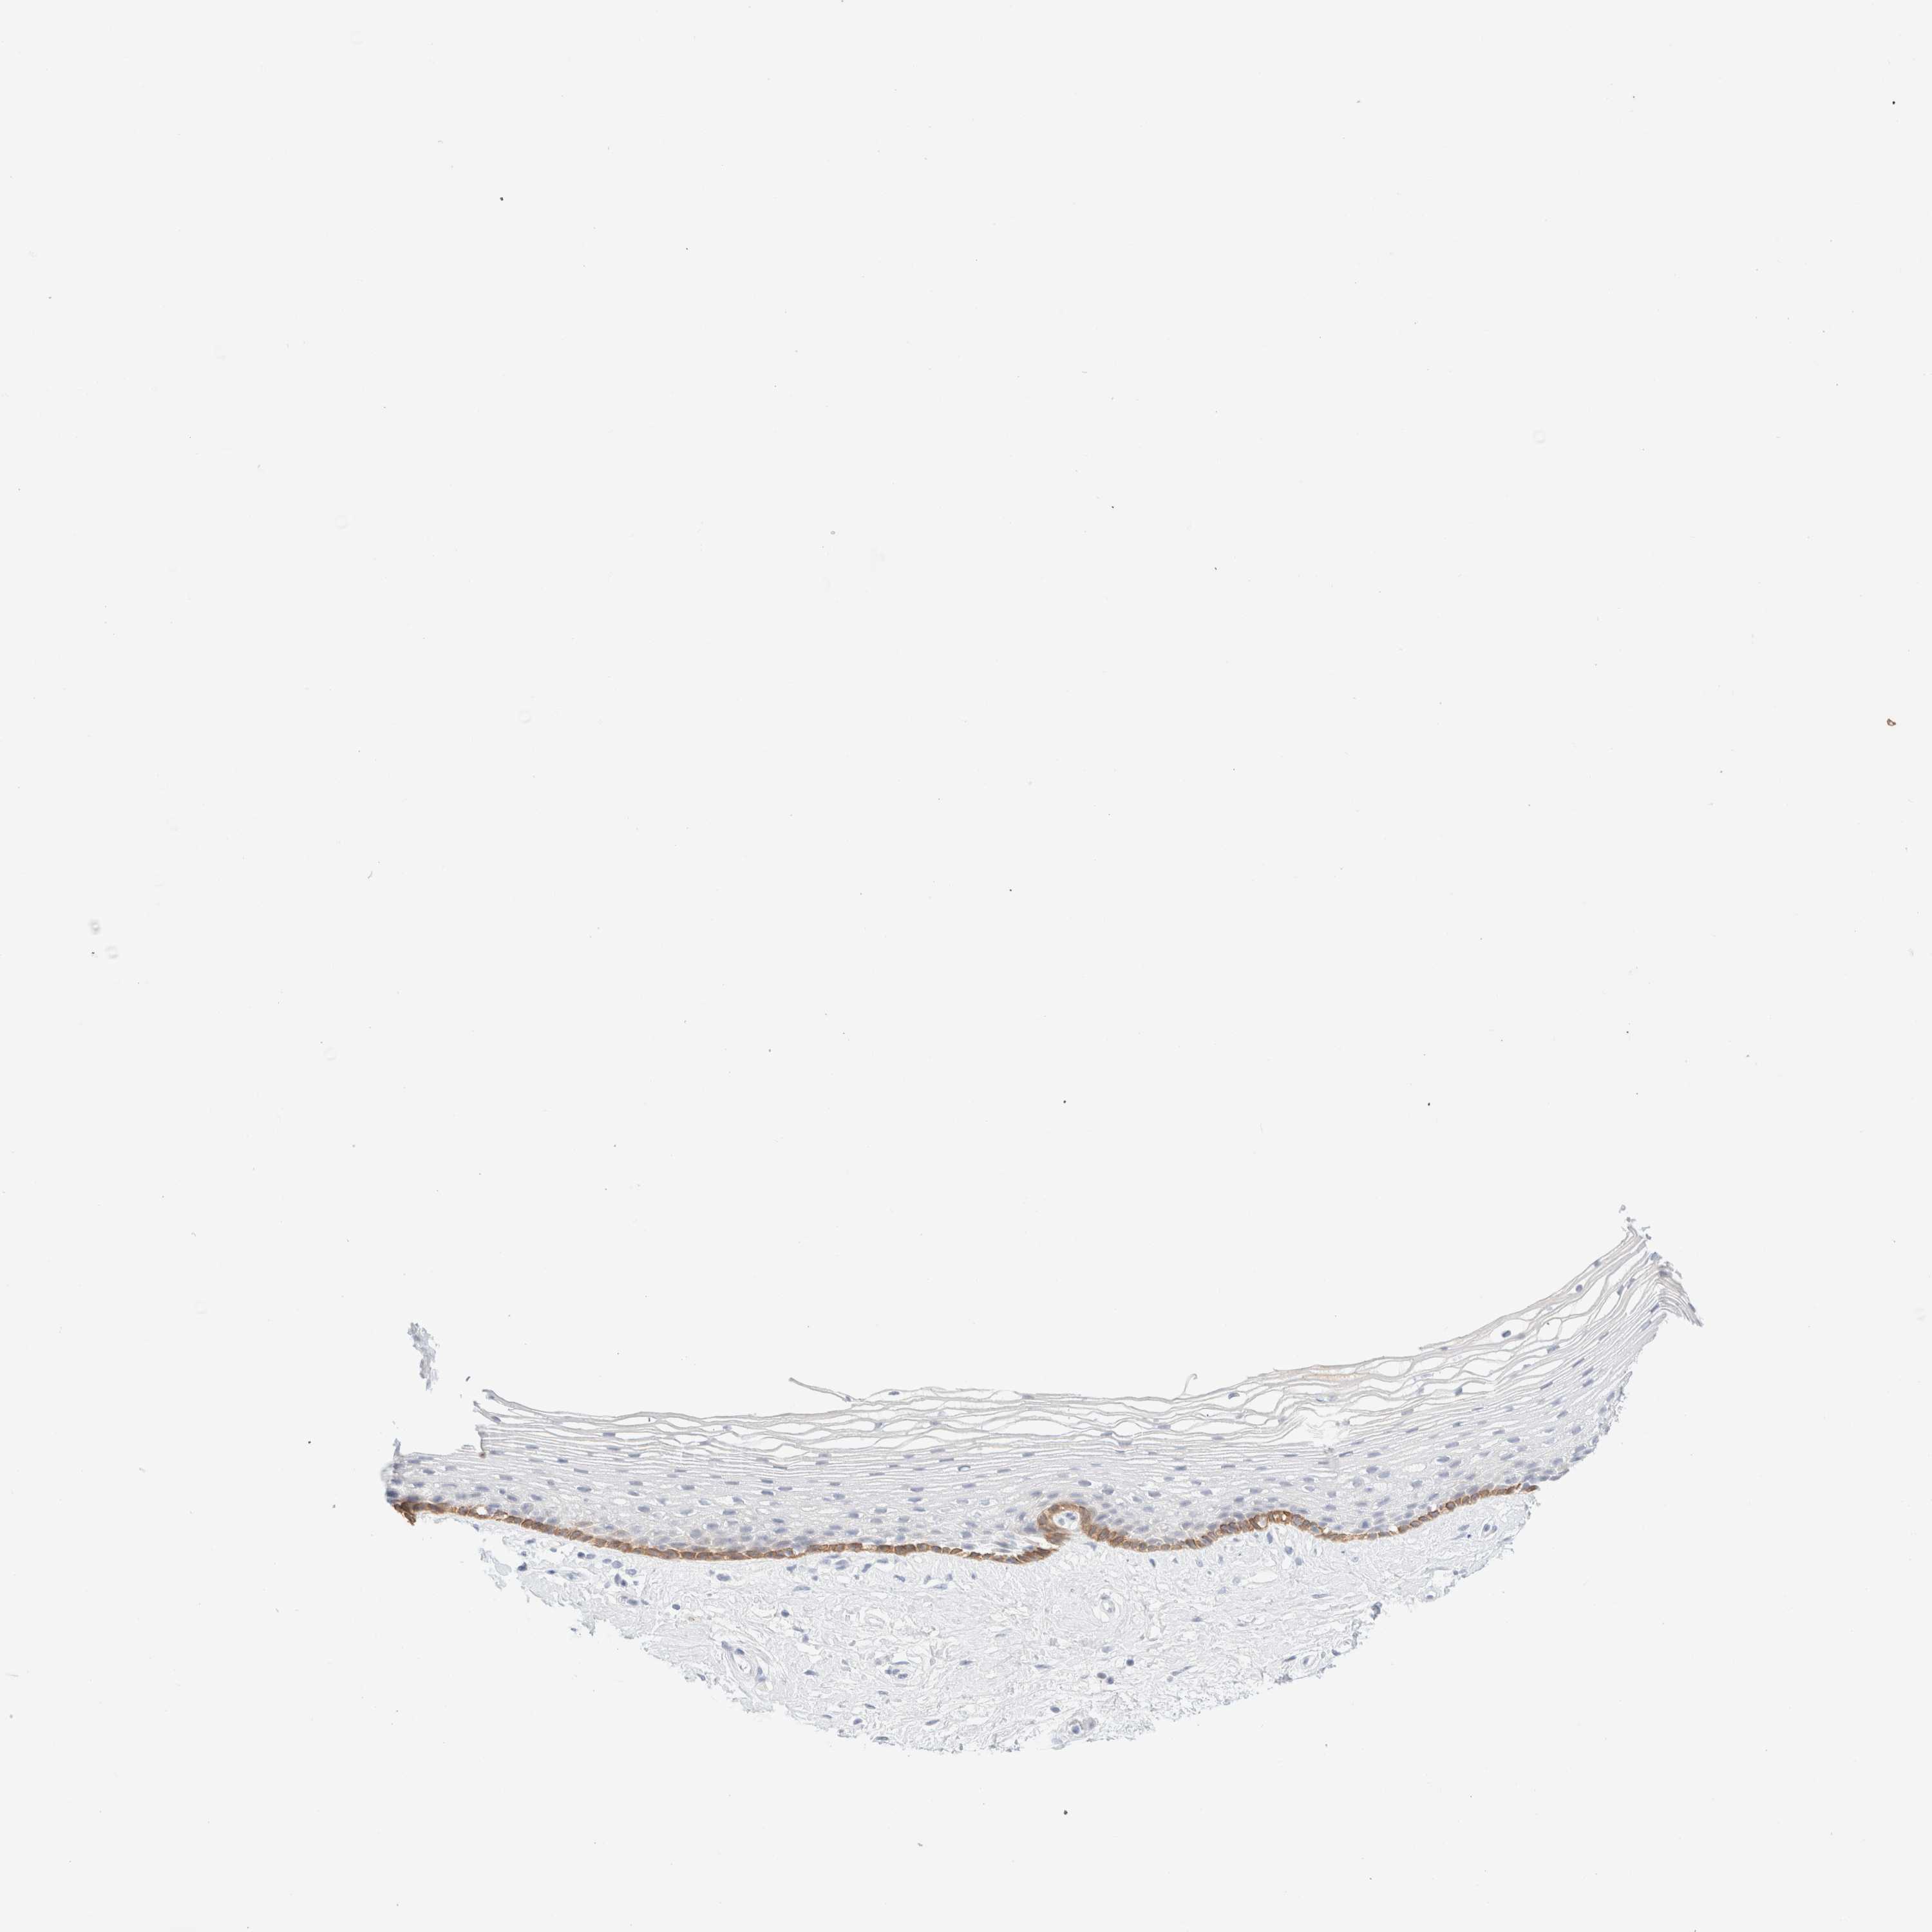
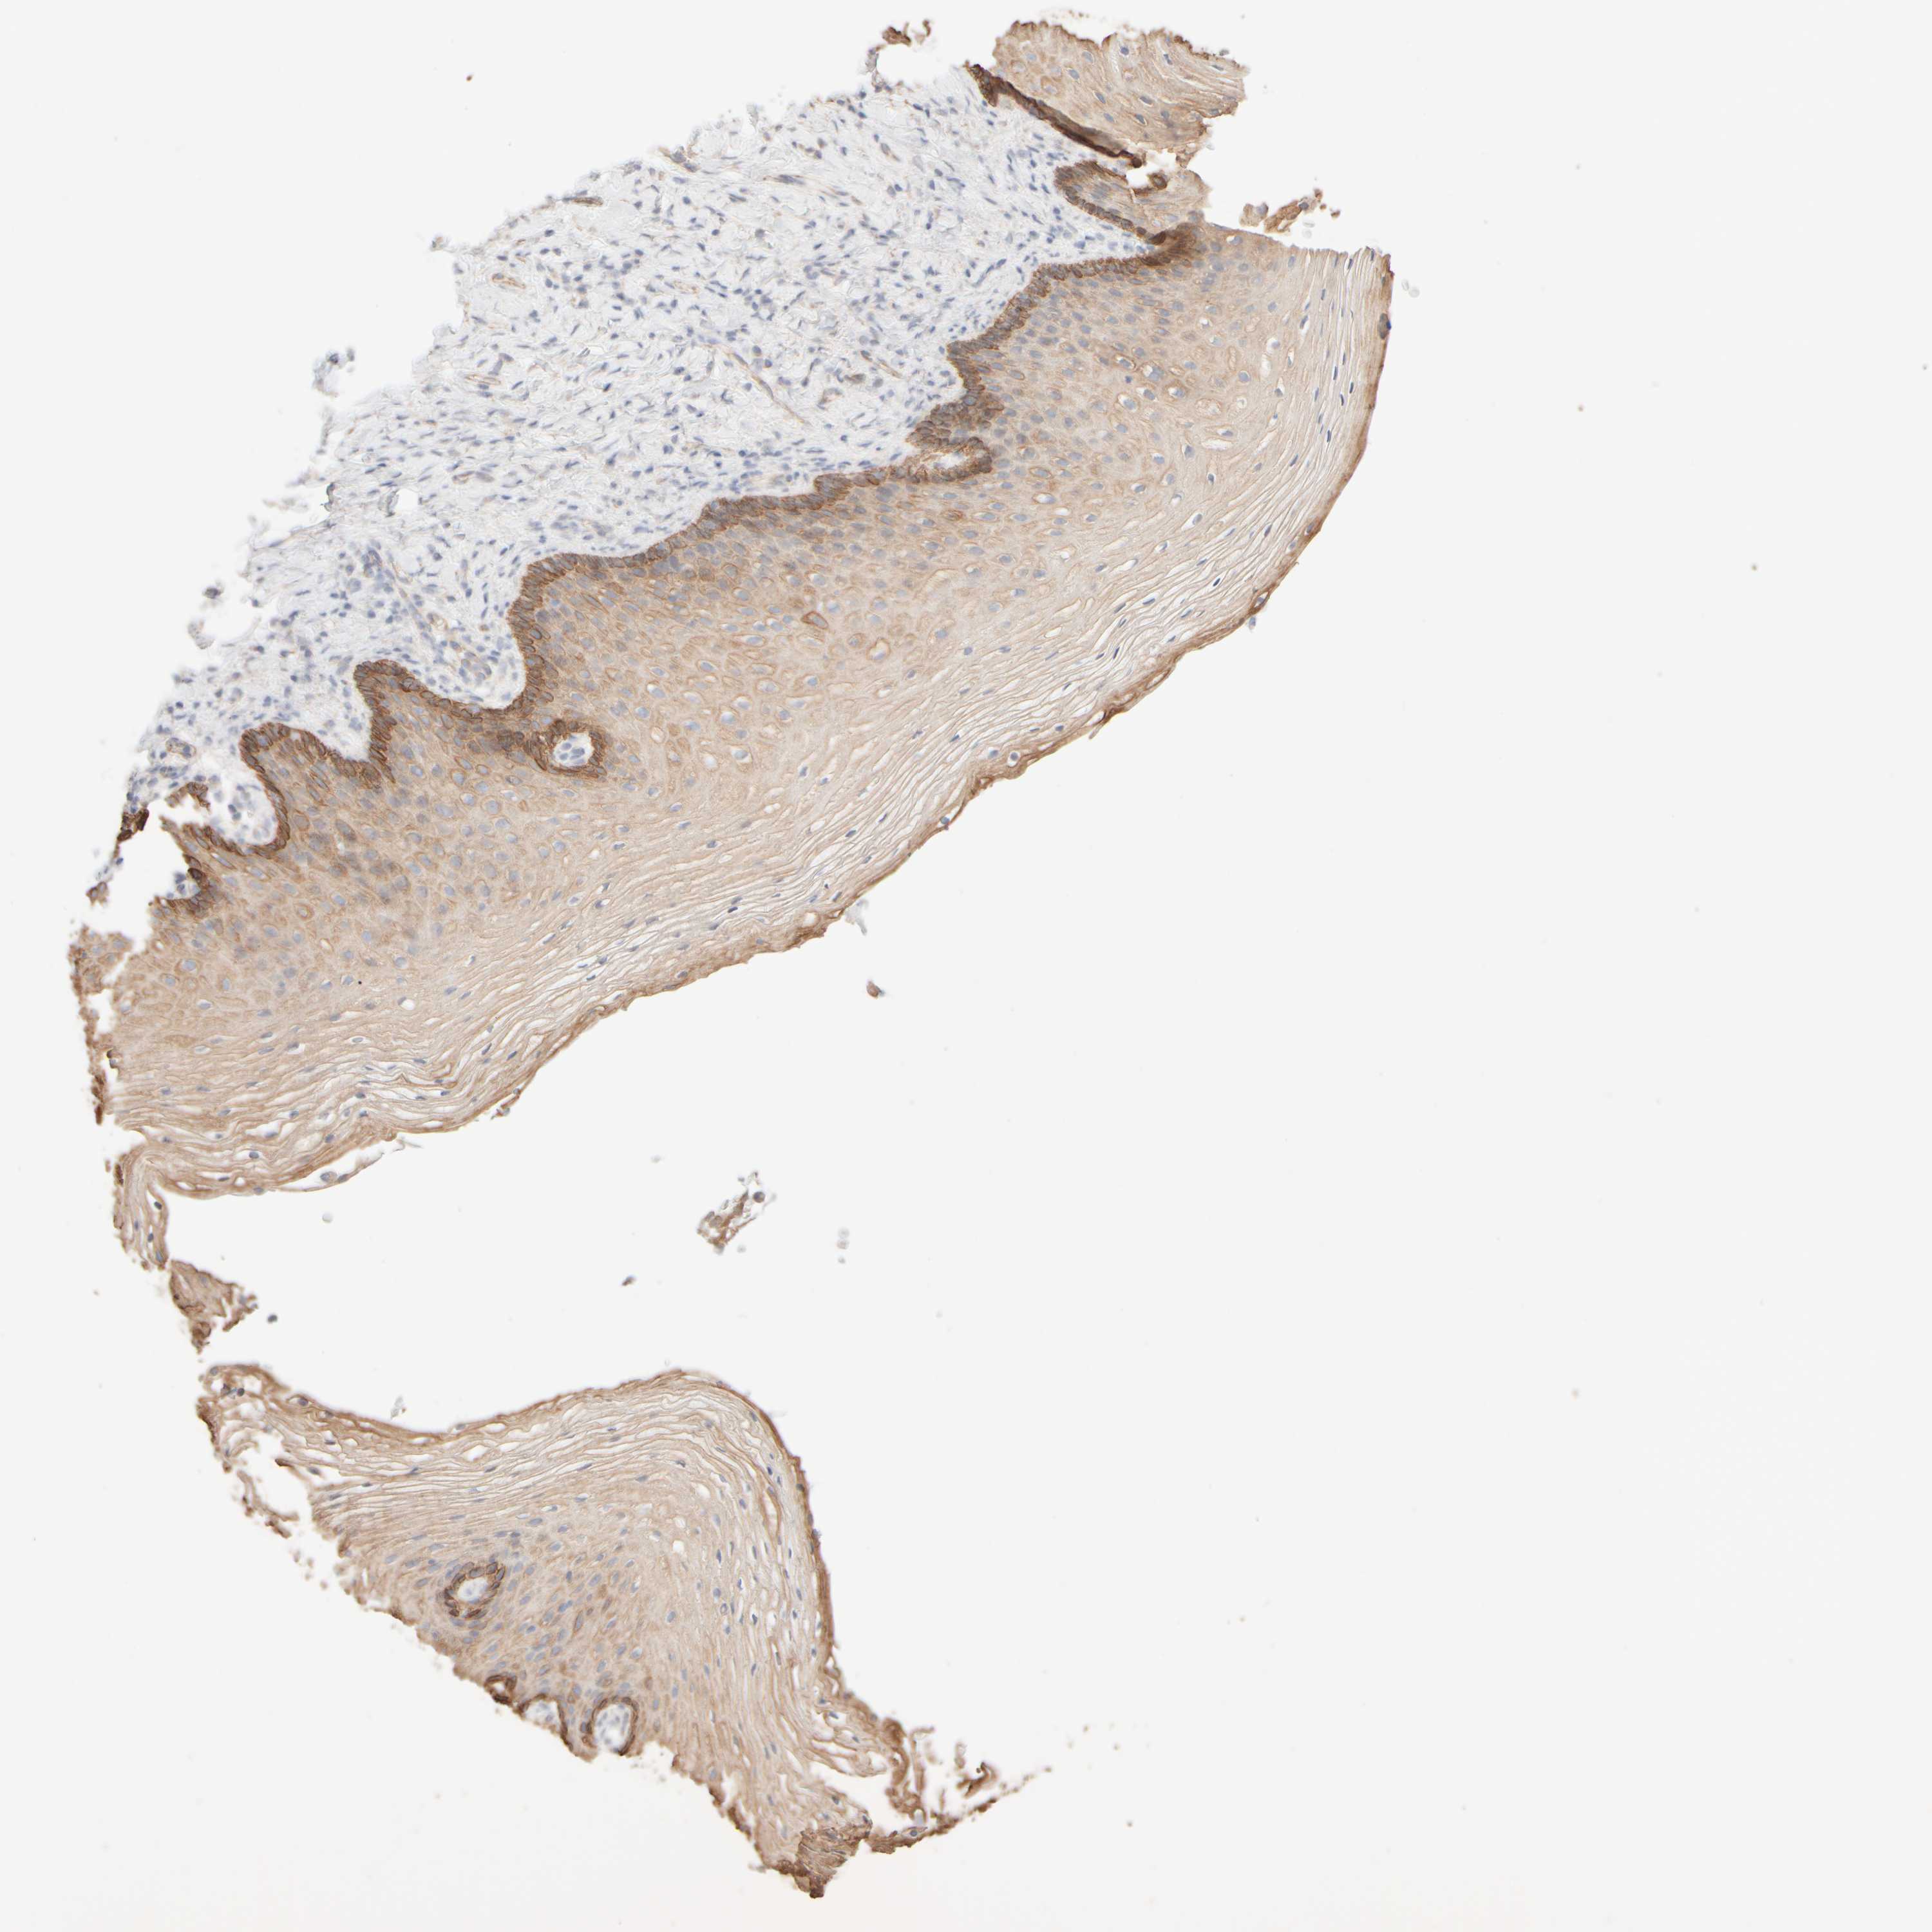
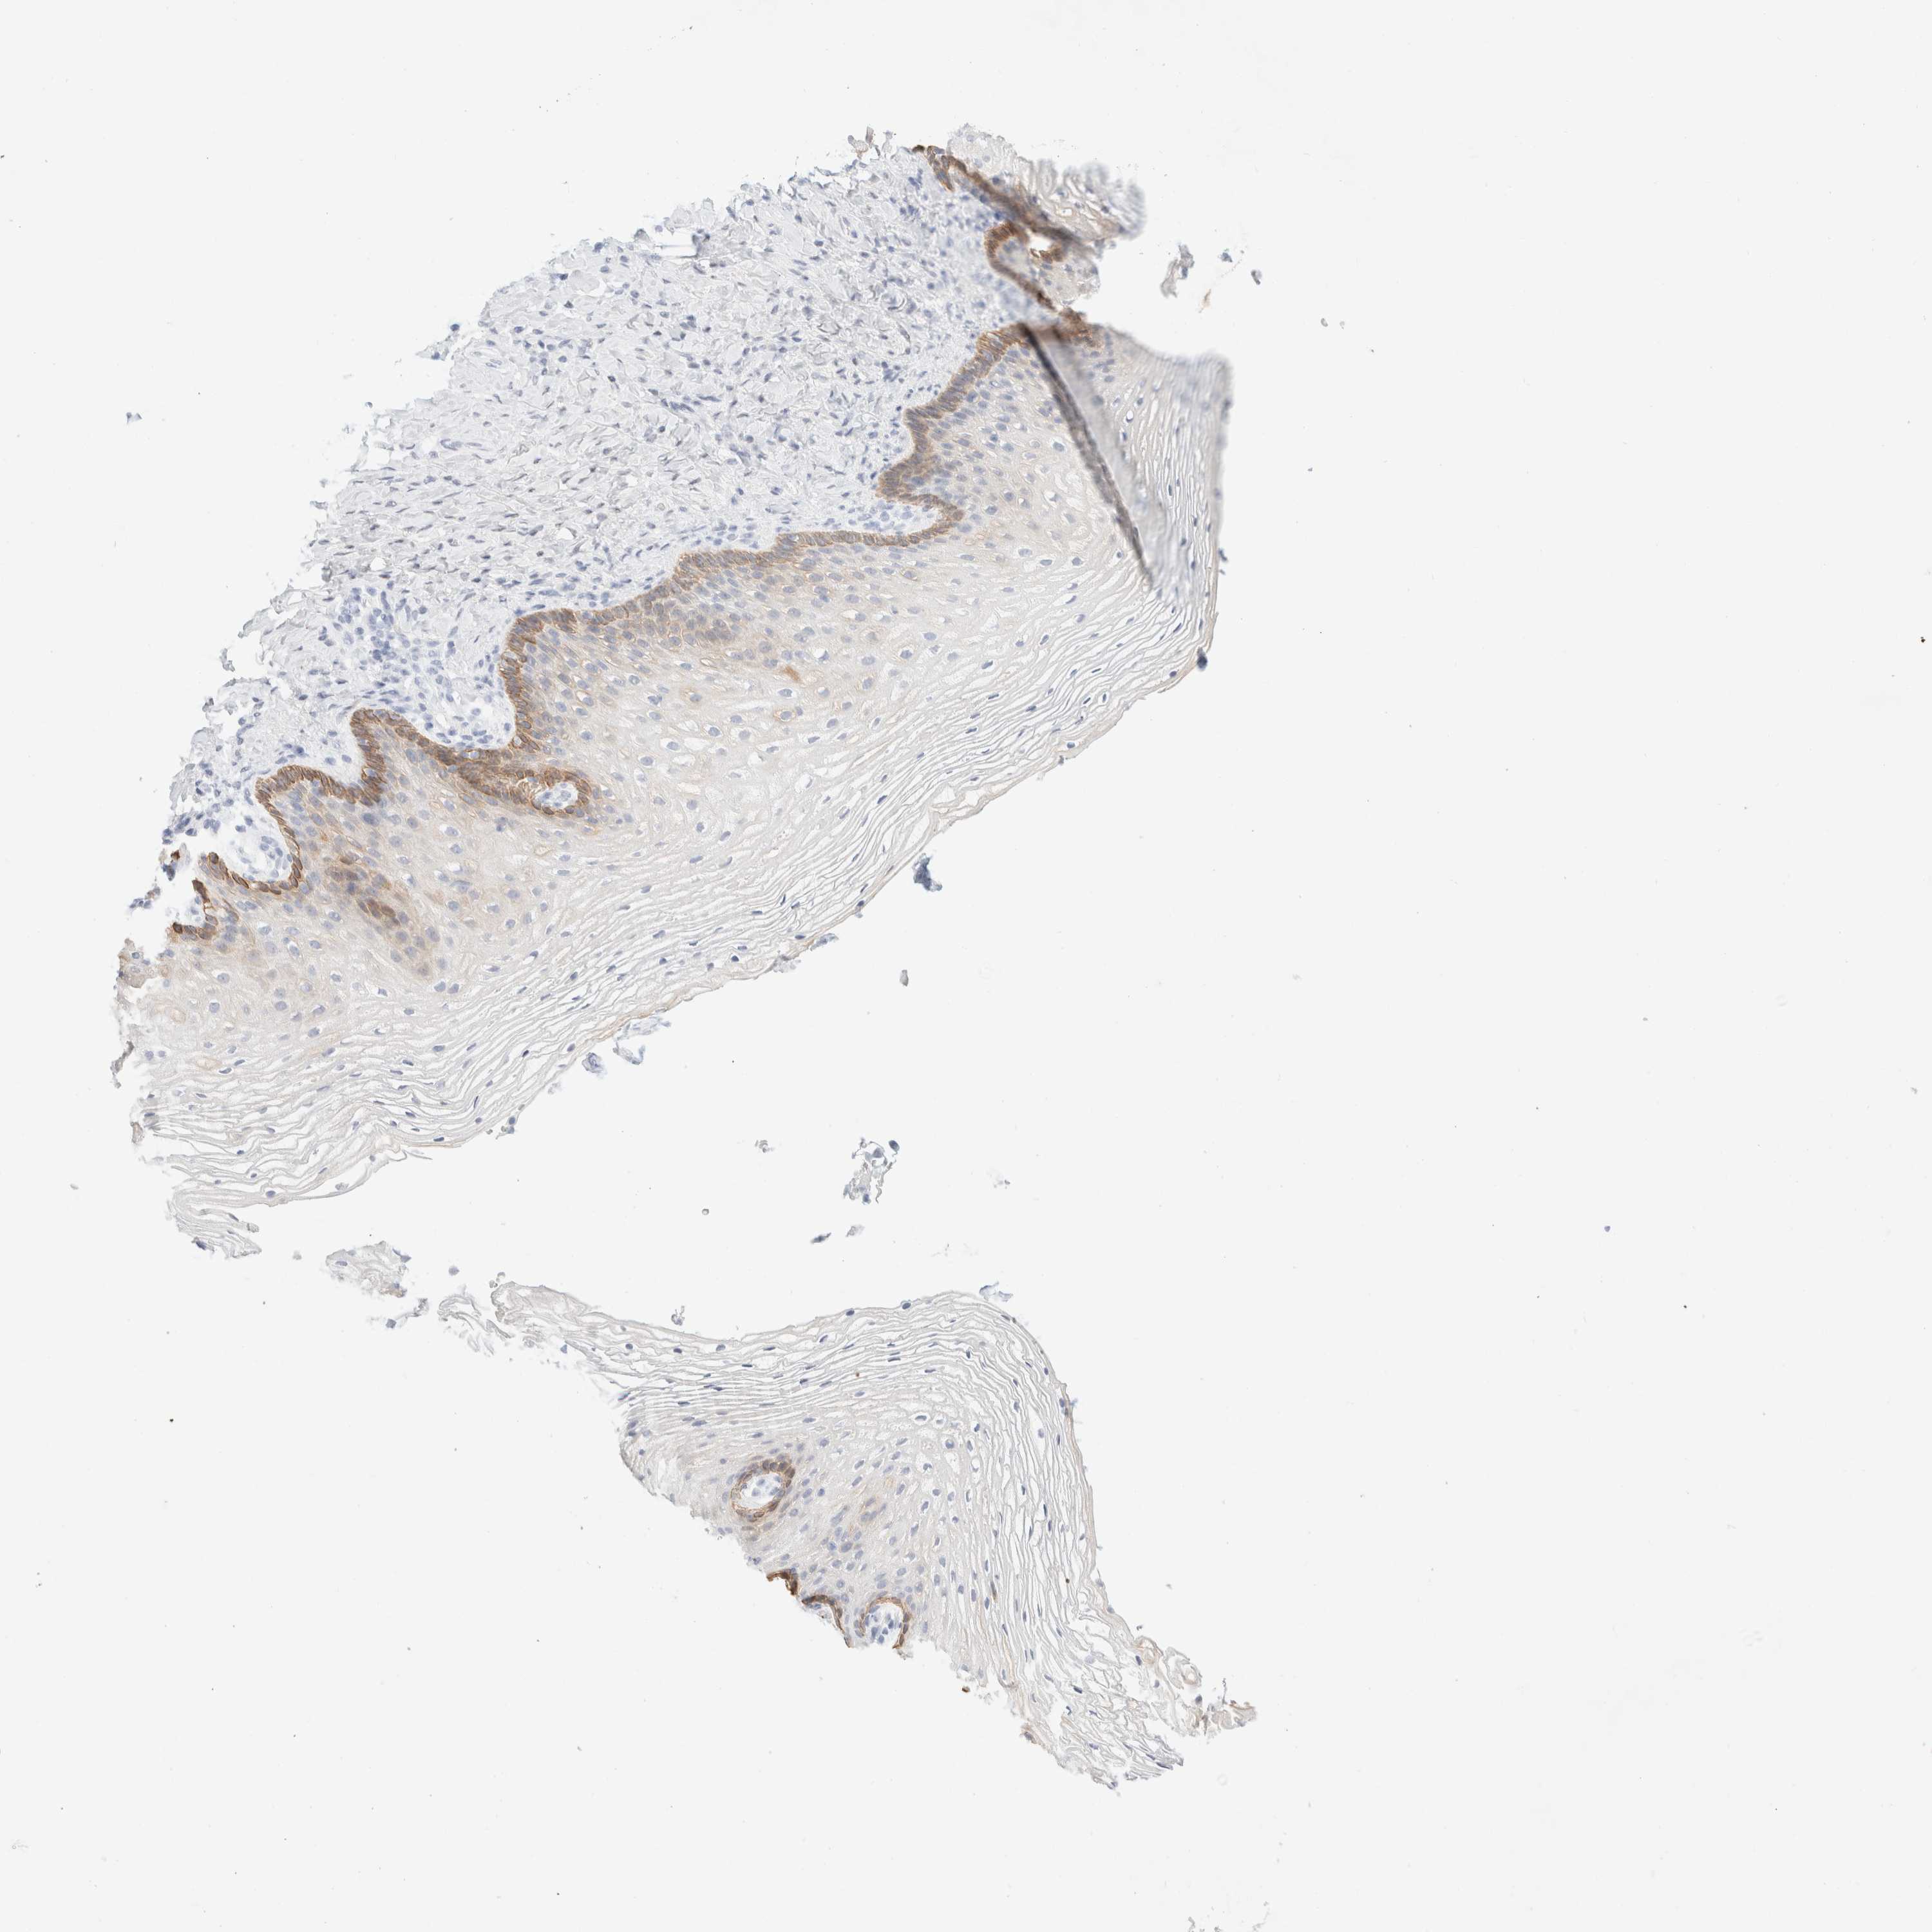
The detailed normal tissue page shows images of the stained tissue, together with antibody staining and expression level of the cell types. A knowledge-based annotated protein expression is provided for each cell type at the top of the page and the staining level of the individual antibodies is given underneath each antibody ID.
Samples from up to three different individuals have been stained for each antibody. The gender, age and tissue characterization are reported for each individual (patient) and are viewable when clicking on the image for magnification.
The images can be clicked for an enlarged view that can be panned. From the enlarged view, all stained images for all antibodies can be browsed (represented by miniature images). The miniature image with an orange overlay is the currently displayed image.
This score describes the level of antibody staining observed in the annotated cell types as not detected, low, medium, or high. It is based on the staining intensity and fraction of stained cells.
The RNA-seq details section shows detailed information about the individual samples used for the transcript profiling and results of the RNA-seq analysis.
Information about each individual sample is listed below, including gender, age, a tissue section image and estimated fractions of cell types. TPM (transcripts per million) values give a quantification of the gene abundance which is comparable between different genes and samples.
RNA-Seq data is reported as average RPKM (reads per kilobase per million mapped reads), generated by the Genotype-Tissue Expression (GTEx) project. More information can be found on the GTEx portal.
Normal distribution across the dataset is visualized with box plots, shown as median and 25th and 75th percentiles. Points are displayed as outliers if they are above or below 1.5 times the interquartile range. RPKM values of the individual samples are presented next to the box plot.
Max RPKM: 650.2
Min RPKM: 0.0
Std RPKM: 135.7
Median RPKM: 139.7
GTEX-ZE7O-2426-SM-57WD7
50-59 years, female
650.2
GTEX-11TTK-2726-SM-5GU58
60-69 years, female
619.1
GTEX-ZC5H-2226-SM-4WAWS
40-49 years, female
587.2
GTEX-ZVT2-0626-SM-5GICR
50-59 years, female
388.6
GTEX-1117F-2526-SM-5GZY6
60-69 years, female
387.0
GTEX-SE5C-1126-SM-4BRWZ
40-49 years, female
344.7
GTEX-12WSB-2426-SM-5EGJC
60-69 years, female
336.4
GTEX-ZZPU-2226-SM-5EGIV
50-59 years, female
322.2
GTEX-11DXX-1726-SM-5H11T
60-69 years, female
310.7
GTEX-13PVR-1426-SM-5S2PW
60-69 years, female
306.8
GTEX-T2IS-1926-SM-4DM74
20-29 years, female
298.9
GTEX-S7SF-1426-SM-4AT5A
20-29 years, female
288.0
GTEX-QCQG-1226-SM-48U23
50-59 years, female
286.1
GTEX-YJ8O-1226-SM-5P9JE
40-49 years, female
277.6
GTEX-N7MT-1926-SM-3LK5N
60-69 years, female
271.8
GTEX-XUJ4-1626-SM-4BONV
60-69 years, female
264.0
GTEX-11P81-2126-SM-5HL6N
30-39 years, female
263.9
GTEX-QVJO-2526-SM-4R1KB
60-69 years, female
258.1
GTEX-11VI4-0726-SM-5GU5B
40-49 years, female
253.0
GTEX-ZLWG-1126-SM-4WWFQ
50-59 years, female
241.5
GTEX-UPIC-1426-SM-4IHLQ
20-29 years, female
237.5
GTEX-13PL7-2726-SM-5L3GB
60-69 years, female
234.5
GTEX-X15G-1926-SM-4PQZQ
50-59 years, female
234.3
GTEX-OHPK-2526-SM-3MJH9
50-59 years, female
228.6
GTEX-Y3IK-2226-SM-4YCD4
50-59 years, female
227.9
GTEX-S341-1226-SM-4AD5S
40-49 years, female
227.4
GTEX-XUW1-0326-SM-4BOOR
50-59 years, female
220.9
GTEX-P4PP-2526-SM-3P61P
30-39 years, female
218.4
GTEX-TML8-1126-SM-4DXSS
40-49 years, female
215.8
GTEX-PWCY-1726-SM-48TD3
20-29 years, female
213.6
GTEX-11I78-2026-SM-5987C
50-59 years, female
210.4
GTEX-14AS3-1726-SM-5RQJV
40-49 years, female
207.7
GTEX-PX3G-2526-SM-48TZV
20-29 years, female
206.9
GTEX-XV7Q-1626-SM-4BRWC
40-49 years, female
206.1
GTEX-Y8LW-1426-SM-5RQJJ
50-59 years, female
203.5
GTEX-RWS6-1726-SM-47JXP
60-69 years, female
198.0
GTEX-ZYY3-2626-SM-5N9DH
60-69 years, female
194.3
GTEX-13QBU-1726-SM-5IJFQ
40-49 years, female
192.4
GTEX-1399S-2326-SM-5K7YV
30-39 years, female
189.6
GTEX-131YS-2426-SM-5J2OD
60-69 years, female
188.4
GTEX-OHPL-2526-SM-3MJGT
60-69 years, female
182.9
GTEX-1399U-1526-SM-5J2N7
50-59 years, female
179.7
GTEX-TMMY-1926-SM-4DXUU
40-49 years, female
173.4
GTEX-P78B-2226-SM-3P5ZZ
40-49 years, female
171.8
GTEX-13D11-1326-SM-5IJFY
50-59 years, female
158.4
GTEX-145ME-1426-SM-5RQJS
40-49 years, female
149.1
GTEX-11XUK-1326-SM-5EQM4
40-49 years, female
143.0
GTEX-ZXES-0626-SM-5E45P
30-39 years, female
141.5
GTEX-146FH-2626-SM-5Q5E1
50-59 years, female
138.0
GTEX-T6MO-1226-SM-4DM5S
40-49 years, female
137.3
GTEX-146FR-2426-SM-5NQAU
60-69 years, female
136.7
GTEX-11EMC-1926-SM-5A5JU
60-69 years, female
133.6
GTEX-U3ZN-0926-SM-4DXTU
30-39 years, female
129.2
GTEX-13U4I-2026-SM-5LU3L
40-49 years, female
124.7
GTEX-ZAJG-2926-SM-5HL8P
50-59 years, female
123.1
GTEX-131XG-2126-SM-5DUXG
50-59 years, female
121.8
GTEX-TSE9-2526-SM-4DXUS
60-69 years, female
115.1
GTEX-14A5I-2726-SM-5SIB3
50-59 years, female
100.1
GTEX-14BMU-1926-SM-5S2QC
20-29 years, female
97.9
GTEX-ZP4G-0826-SM-4WWF3
20-29 years, female
95.6
GTEX-ZTPG-2226-SM-57WF9
20-29 years, female
92.5
GTEX-NL3G-2526-SM-4SOIE
60-69 years, female
91.3
GTEX-S4P3-1126-SM-4AD52
50-59 years, female
89.4
GTEX-ZGAY-2226-SM-4YCCX
40-49 years, female
87.3
GTEX-14DAQ-2326-SM-5S2QX
60-69 years, female
78.7
GTEX-132AR-1626-SM-5EGHP
50-59 years, female
68.3
GTEX-PWOO-2026-SM-48TDE
40-49 years, female
62.3
GTEX-QDT8-2526-SM-48TYX
30-39 years, female
62.1
GTEX-PWN1-2526-SM-48TDS
40-49 years, female
61.6
GTEX-ZVT3-2726-SM-5GU5X
60-69 years, female
58.6
GTEX-113JC-1926-SM-5N9GE
50-59 years, female
52.9
GTEX-X8HC-2826-SM-46MWJ
50-59 years, female
42.8
GTEX-PLZ4-2726-SM-3P61A
50-59 years, female
26.0
GTEX-13QIC-1826-SM-5J1MY
60-69 years, female
15.6
GTEX-S4UY-1326-SM-4AD4X
40-49 years, female
15.6
GTEX-ZYVF-0326-SM-5GIES
50-59 years, female
5.9
GTEX-WEY5-0826-SM-4LMIH
40-49 years, female
3.7
GTEX-147F3-1526-SM-5SIAK
50-59 years, female
2.6
GTEX-UJHI-1326-SM-4IHJO
50-59 years, female
1.8
GTEX-Q734-1426-SM-48TZQ
40-49 years, female
1.7
GTEX-ZYWO-2026-SM-5GIDA
40-49 years, female
1.7
GTEX-W5WG-1026-SM-4LMIF
50-59 years, female
1.0
GTEX-12WSD-2926-SM-5LZUH
60-69 years, female
0.7
GTEX-ZV6S-1326-SM-59HJA
40-49 years, female
0.7
GTEX-11GSP-2226-SM-5HL5Q
60-69 years, female
0.4
GTEX-13W3W-2326-SM-5LU4Y
60-69 years, female
0.3
GTEX-12ZZX-1926-SM-5EGKC
40-49 years, female
0.2
GTEX-13OVI-0926-SM-5J1MI
60-69 years, female
0.2
GTEX-YFC4-2926-SM-5IFJ8
40-49 years, female
0.2
GTEX-11EM3-1826-SM-5A5KO
20-29 years, female
0.1
GTEX-13N11-1526-SM-5L3FL
50-59 years, female
0.1
GTEX-RU1J-1426-SM-46MUV
20-29 years, female
0.1
GTEX-WRHU-2926-SM-4MVNQ
50-59 years, female
0.1
GTEX-ZQG8-1126-SM-51MRL
60-69 years, female
0.1
GTEX-12WSJ-1326-SM-5GCOB
40-49 years, female
0.0
GTEX-Y114-1926-SM-4TT8J
50-59 years, female
0.0
Show all
VAGINA - FANTOM5 CAGEi
Tissue data obtained through Cap Analysis of Gene Expression (CAGE) are reported as Tags Per Million, generated by the FANTOM5 project. More information can be found here.
 The Human Protein Atlas project is funded


 MENU
MENU