We use cookies to enhance the usability of our website. If you continue, we'll assume that you are happy to receive all cookies. More information. Don't show this again.
The protein expression bar, with the units not detected (n), low (l), medium (m) and high (h), is based on a best estimate of the true protein expression for proteins where the antibody staining pattern has been analyzed by knowledge-based annotation. For genes where more than one antibody has been used, a collective score is set. For details, see Assays & annotation.
h
m
l
n
RNA expressioni
RNA expression shows average values based on RNA-seq data generated by HPA, the Genotype-Tissue Expression (GTEx) consortium or the FANTOM5 consortium.
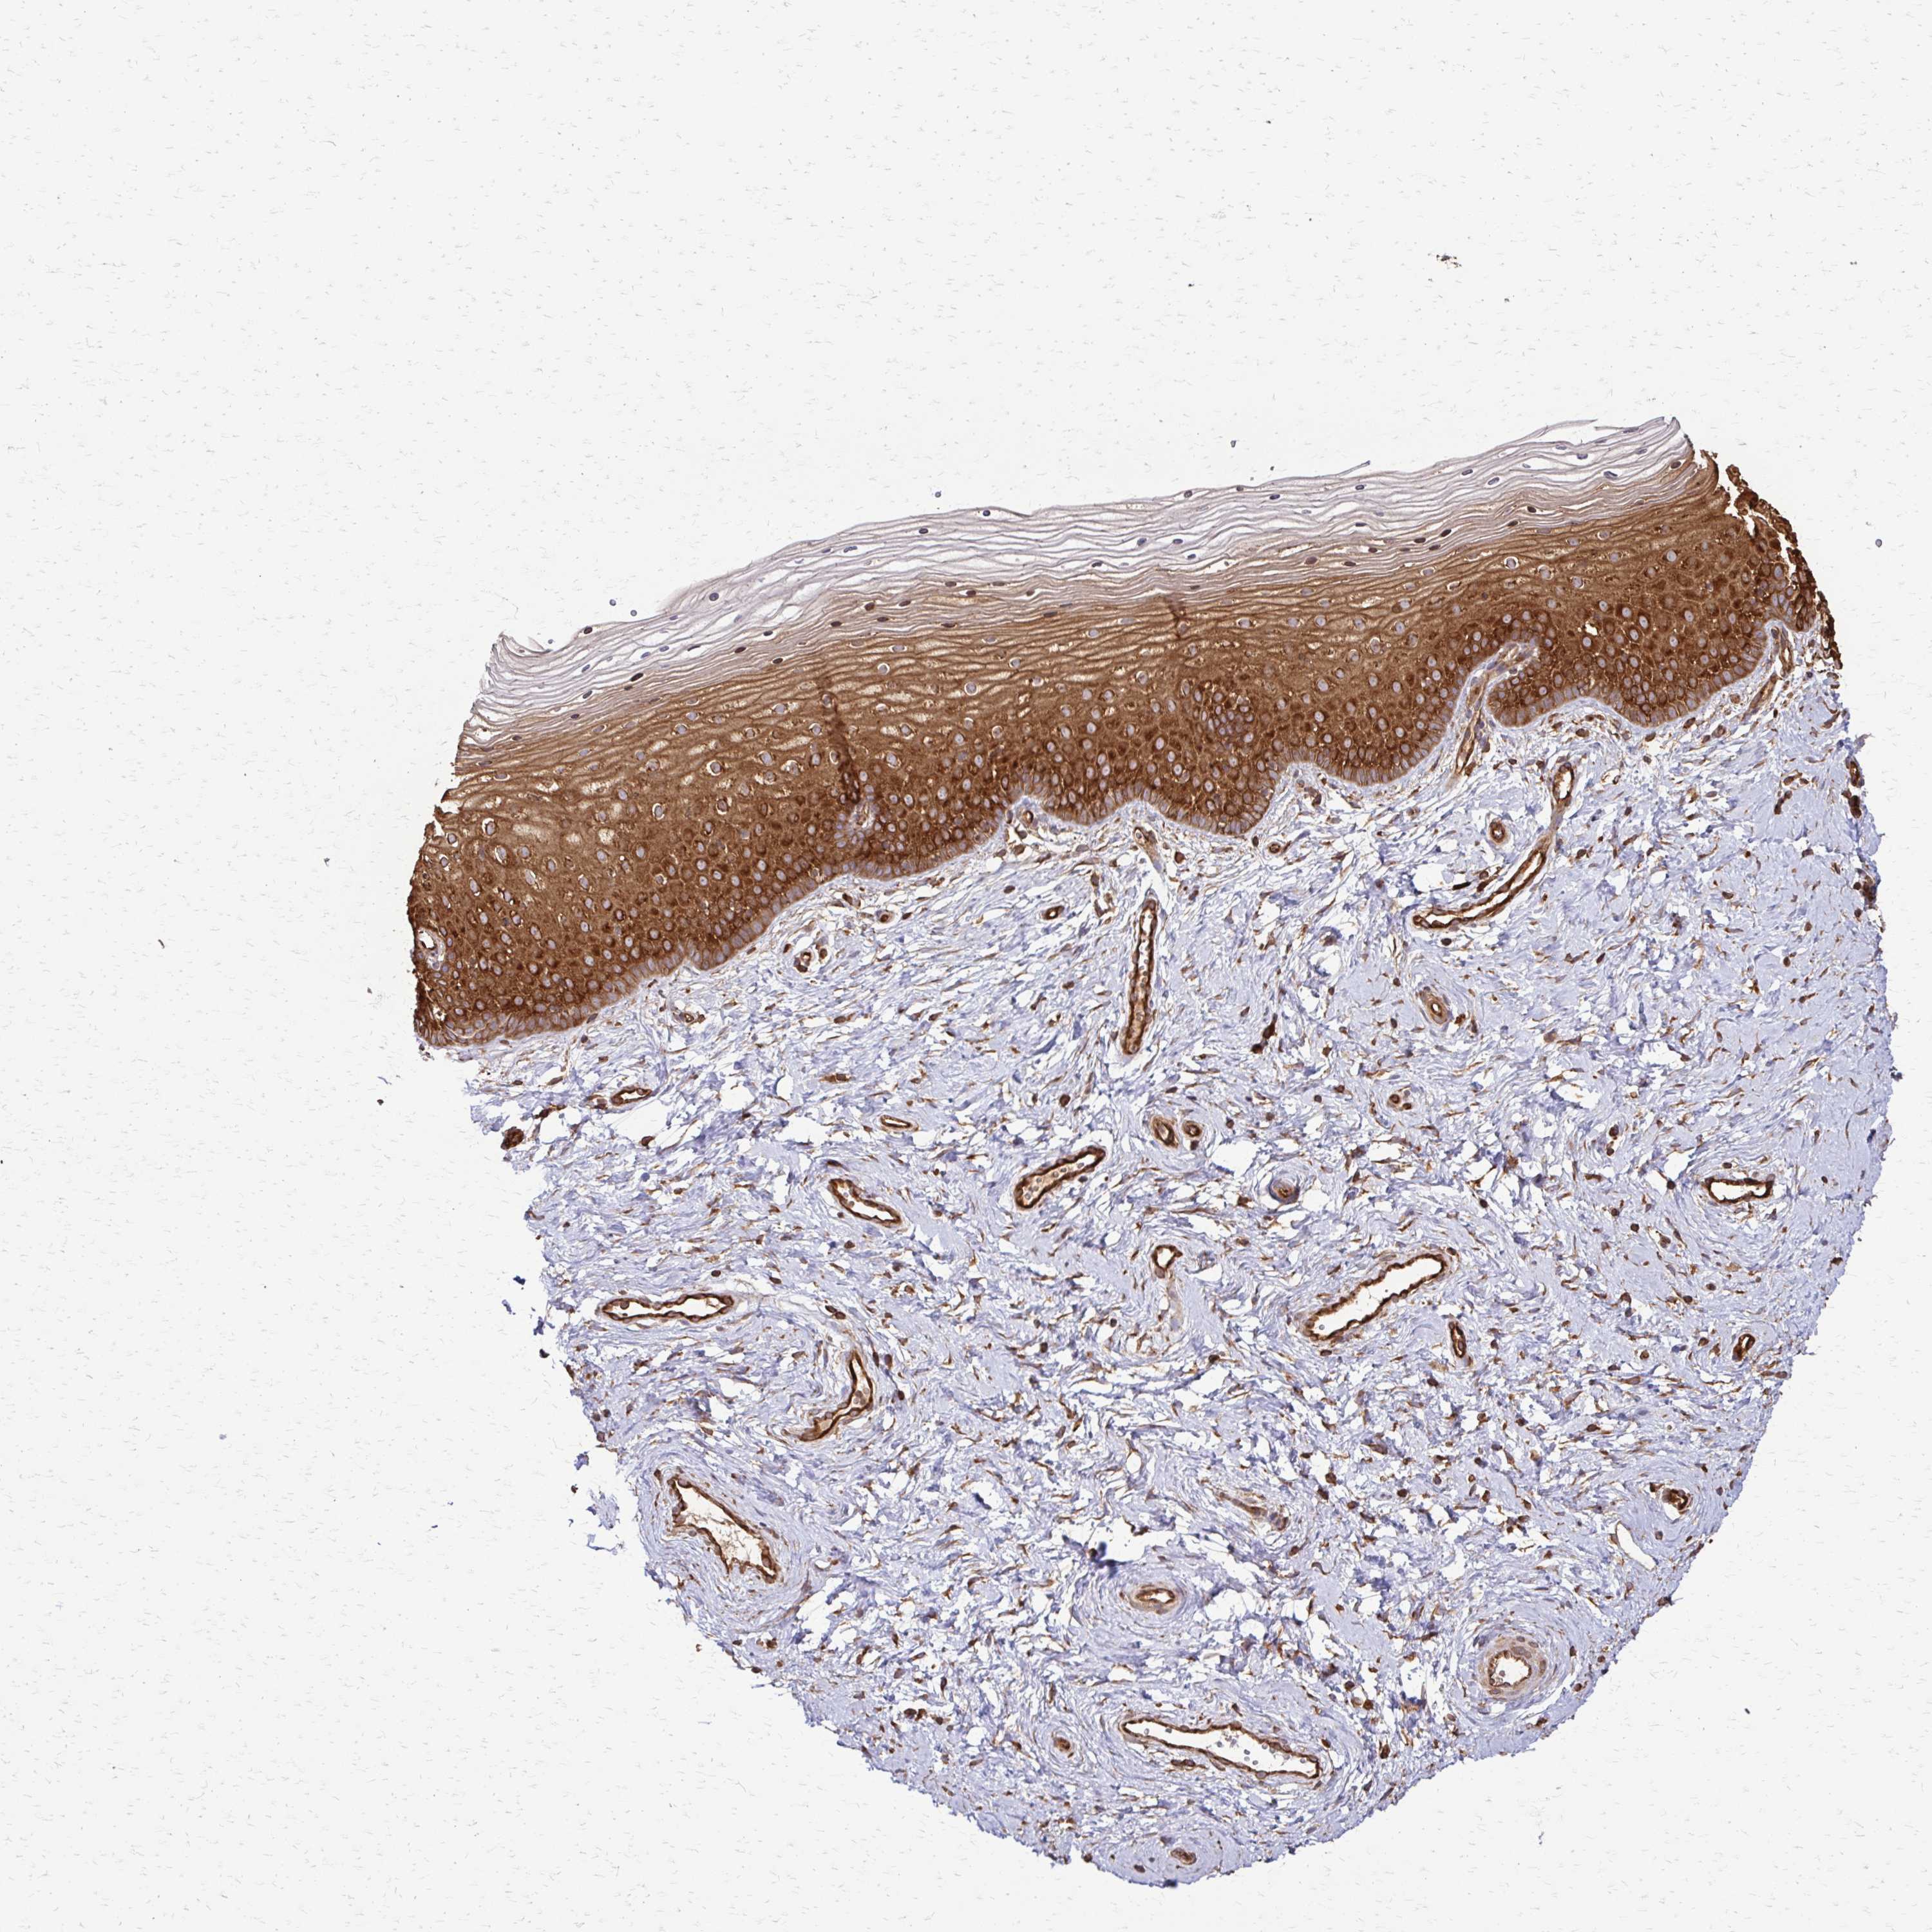
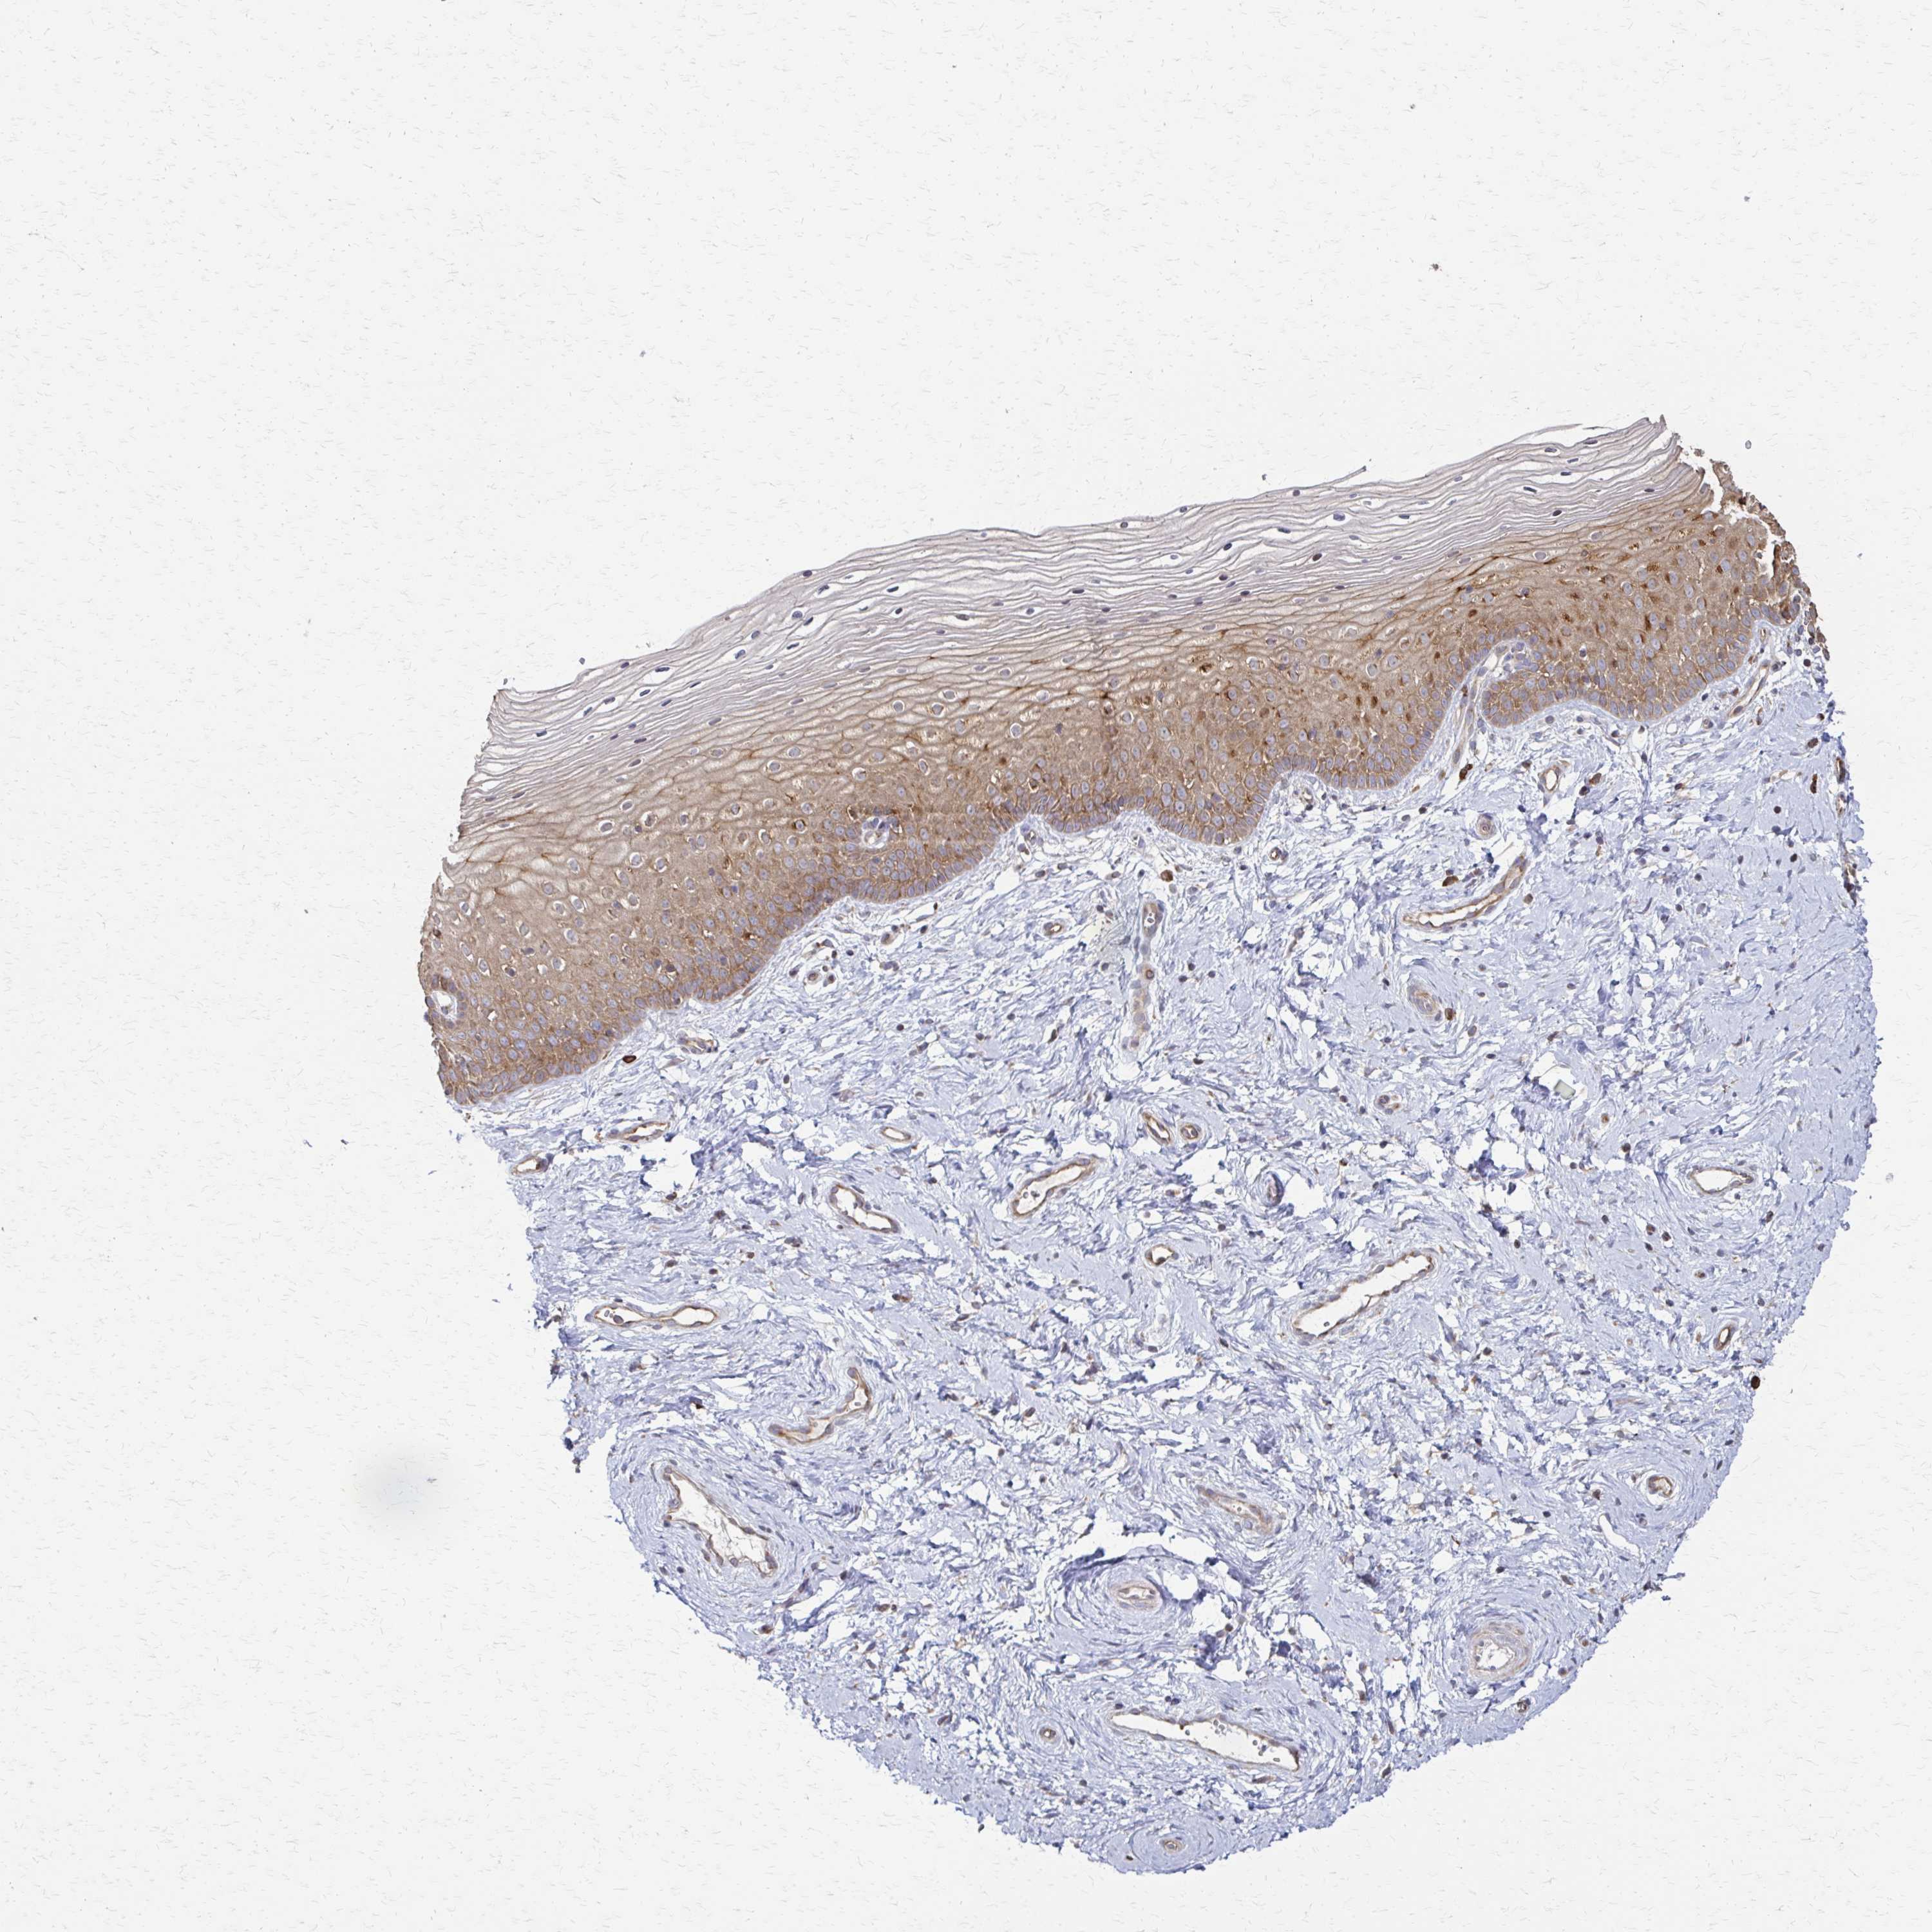
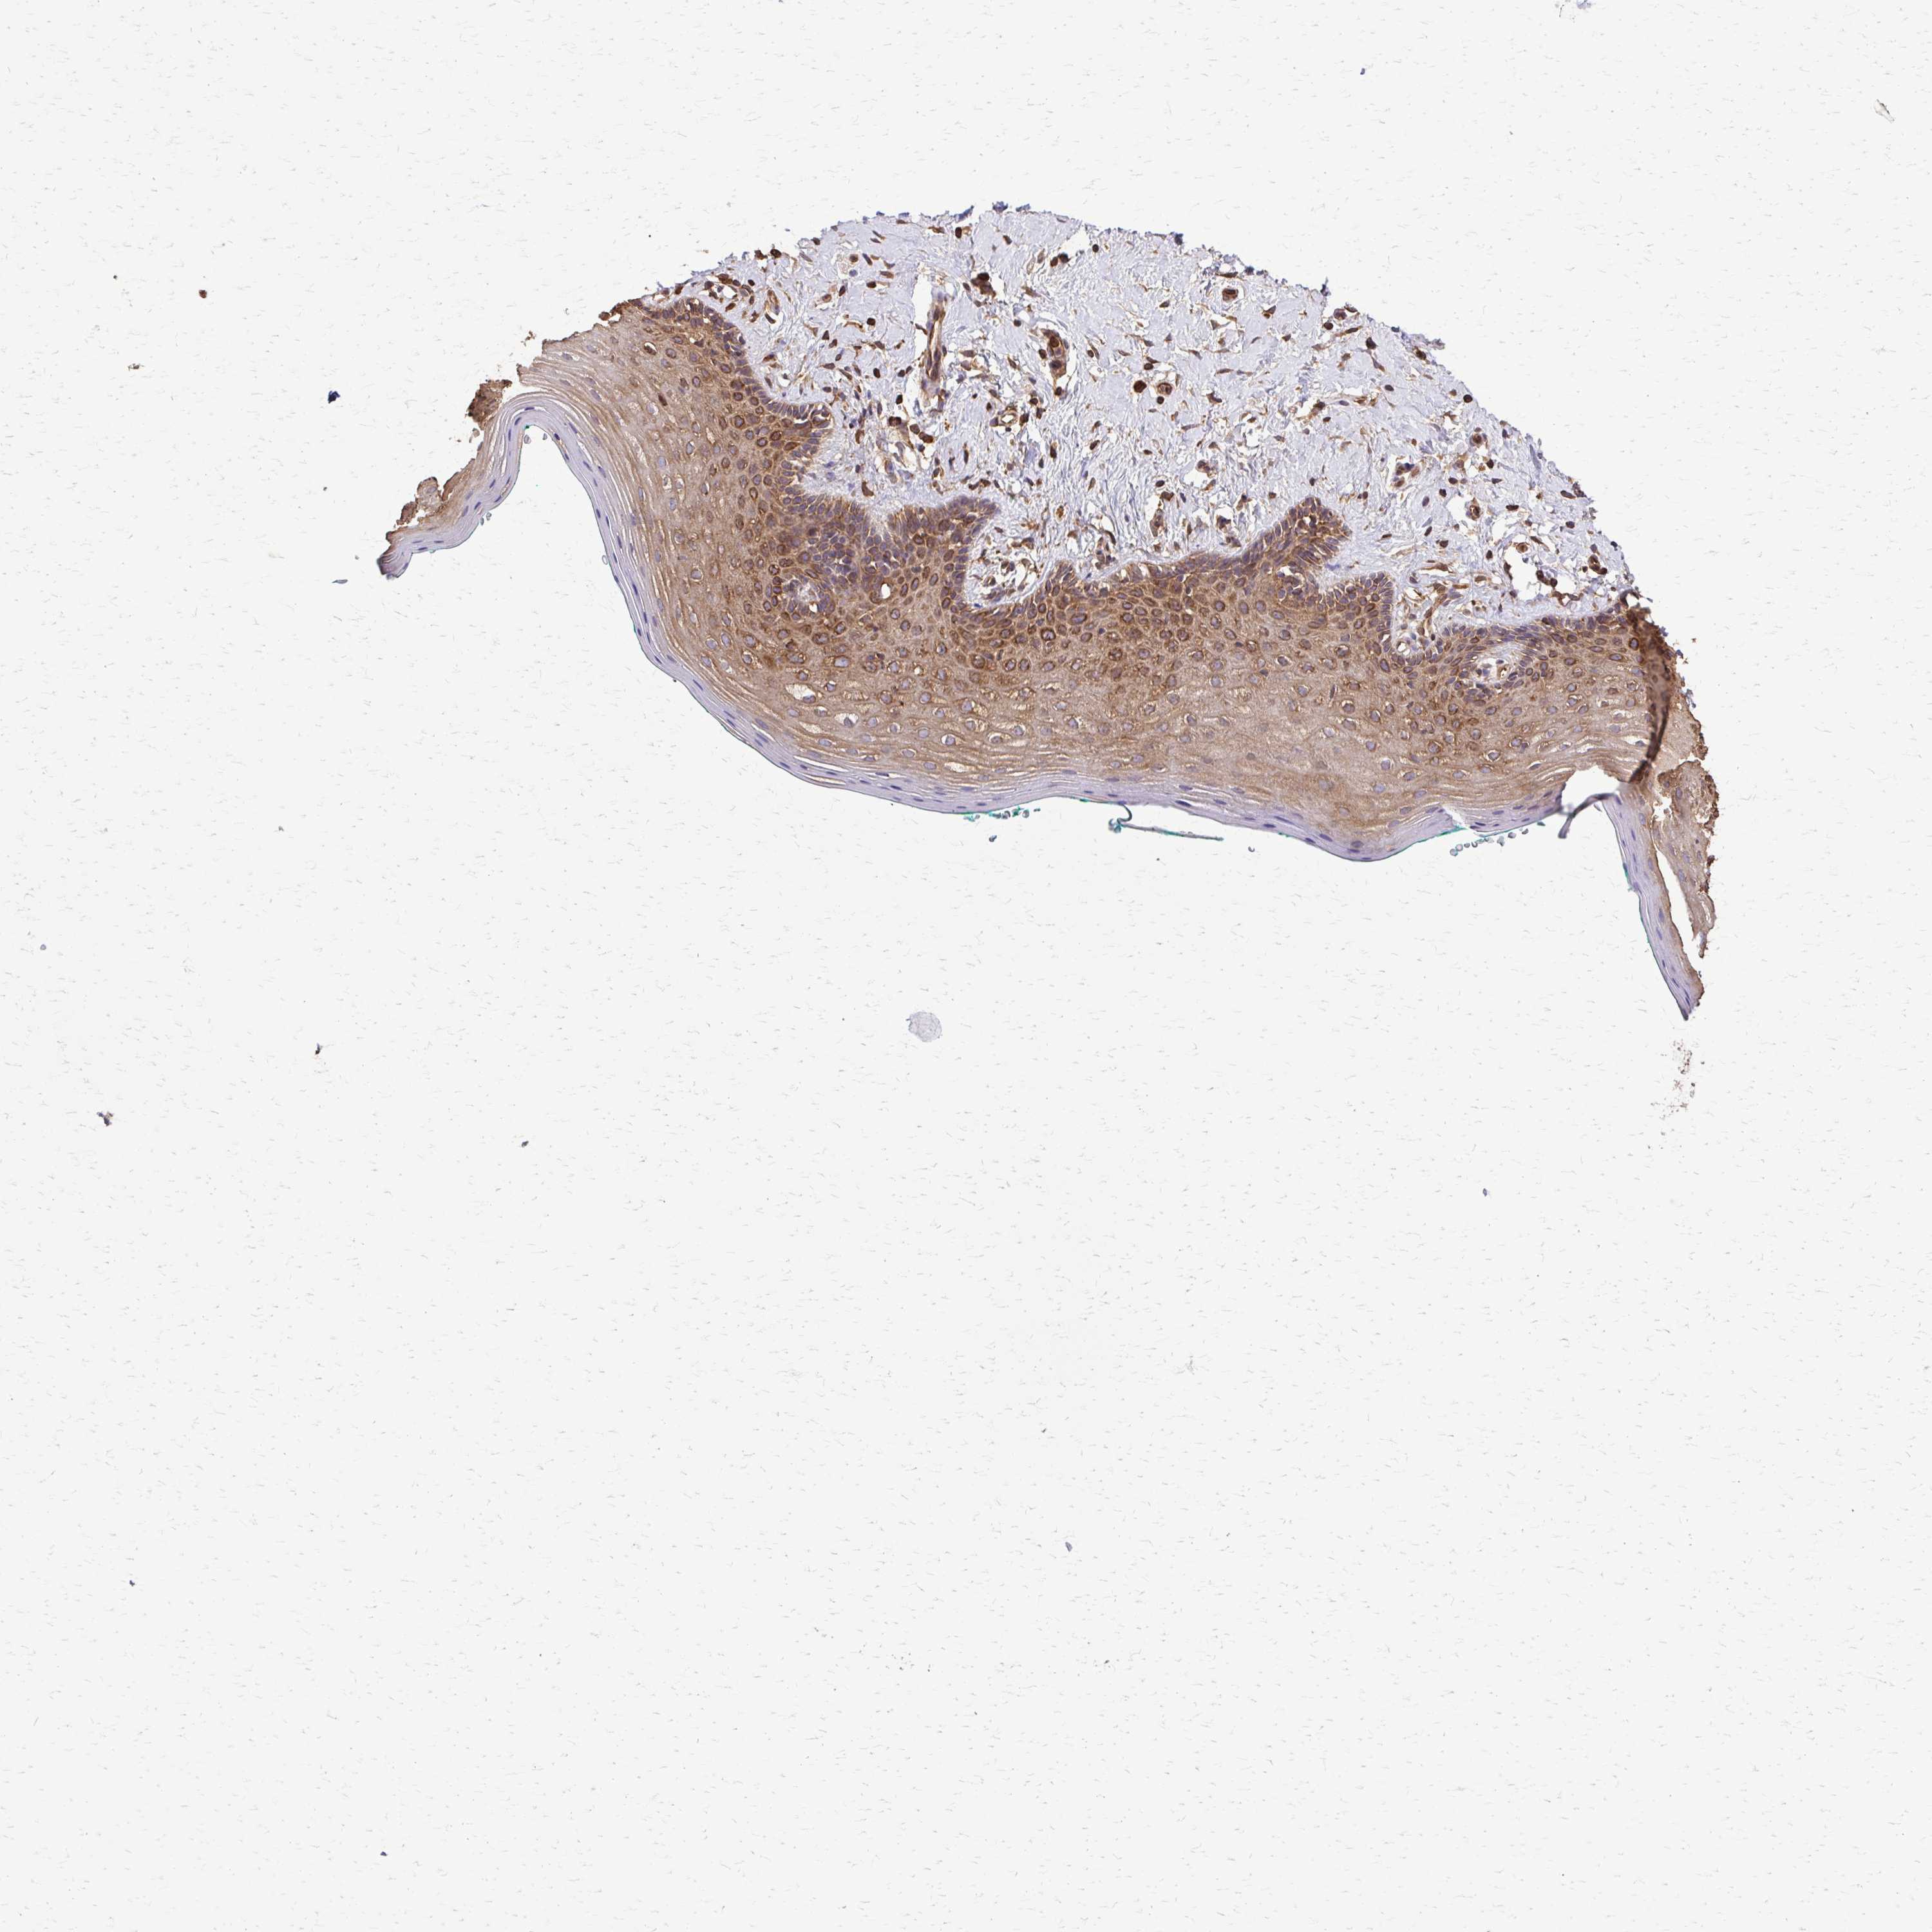
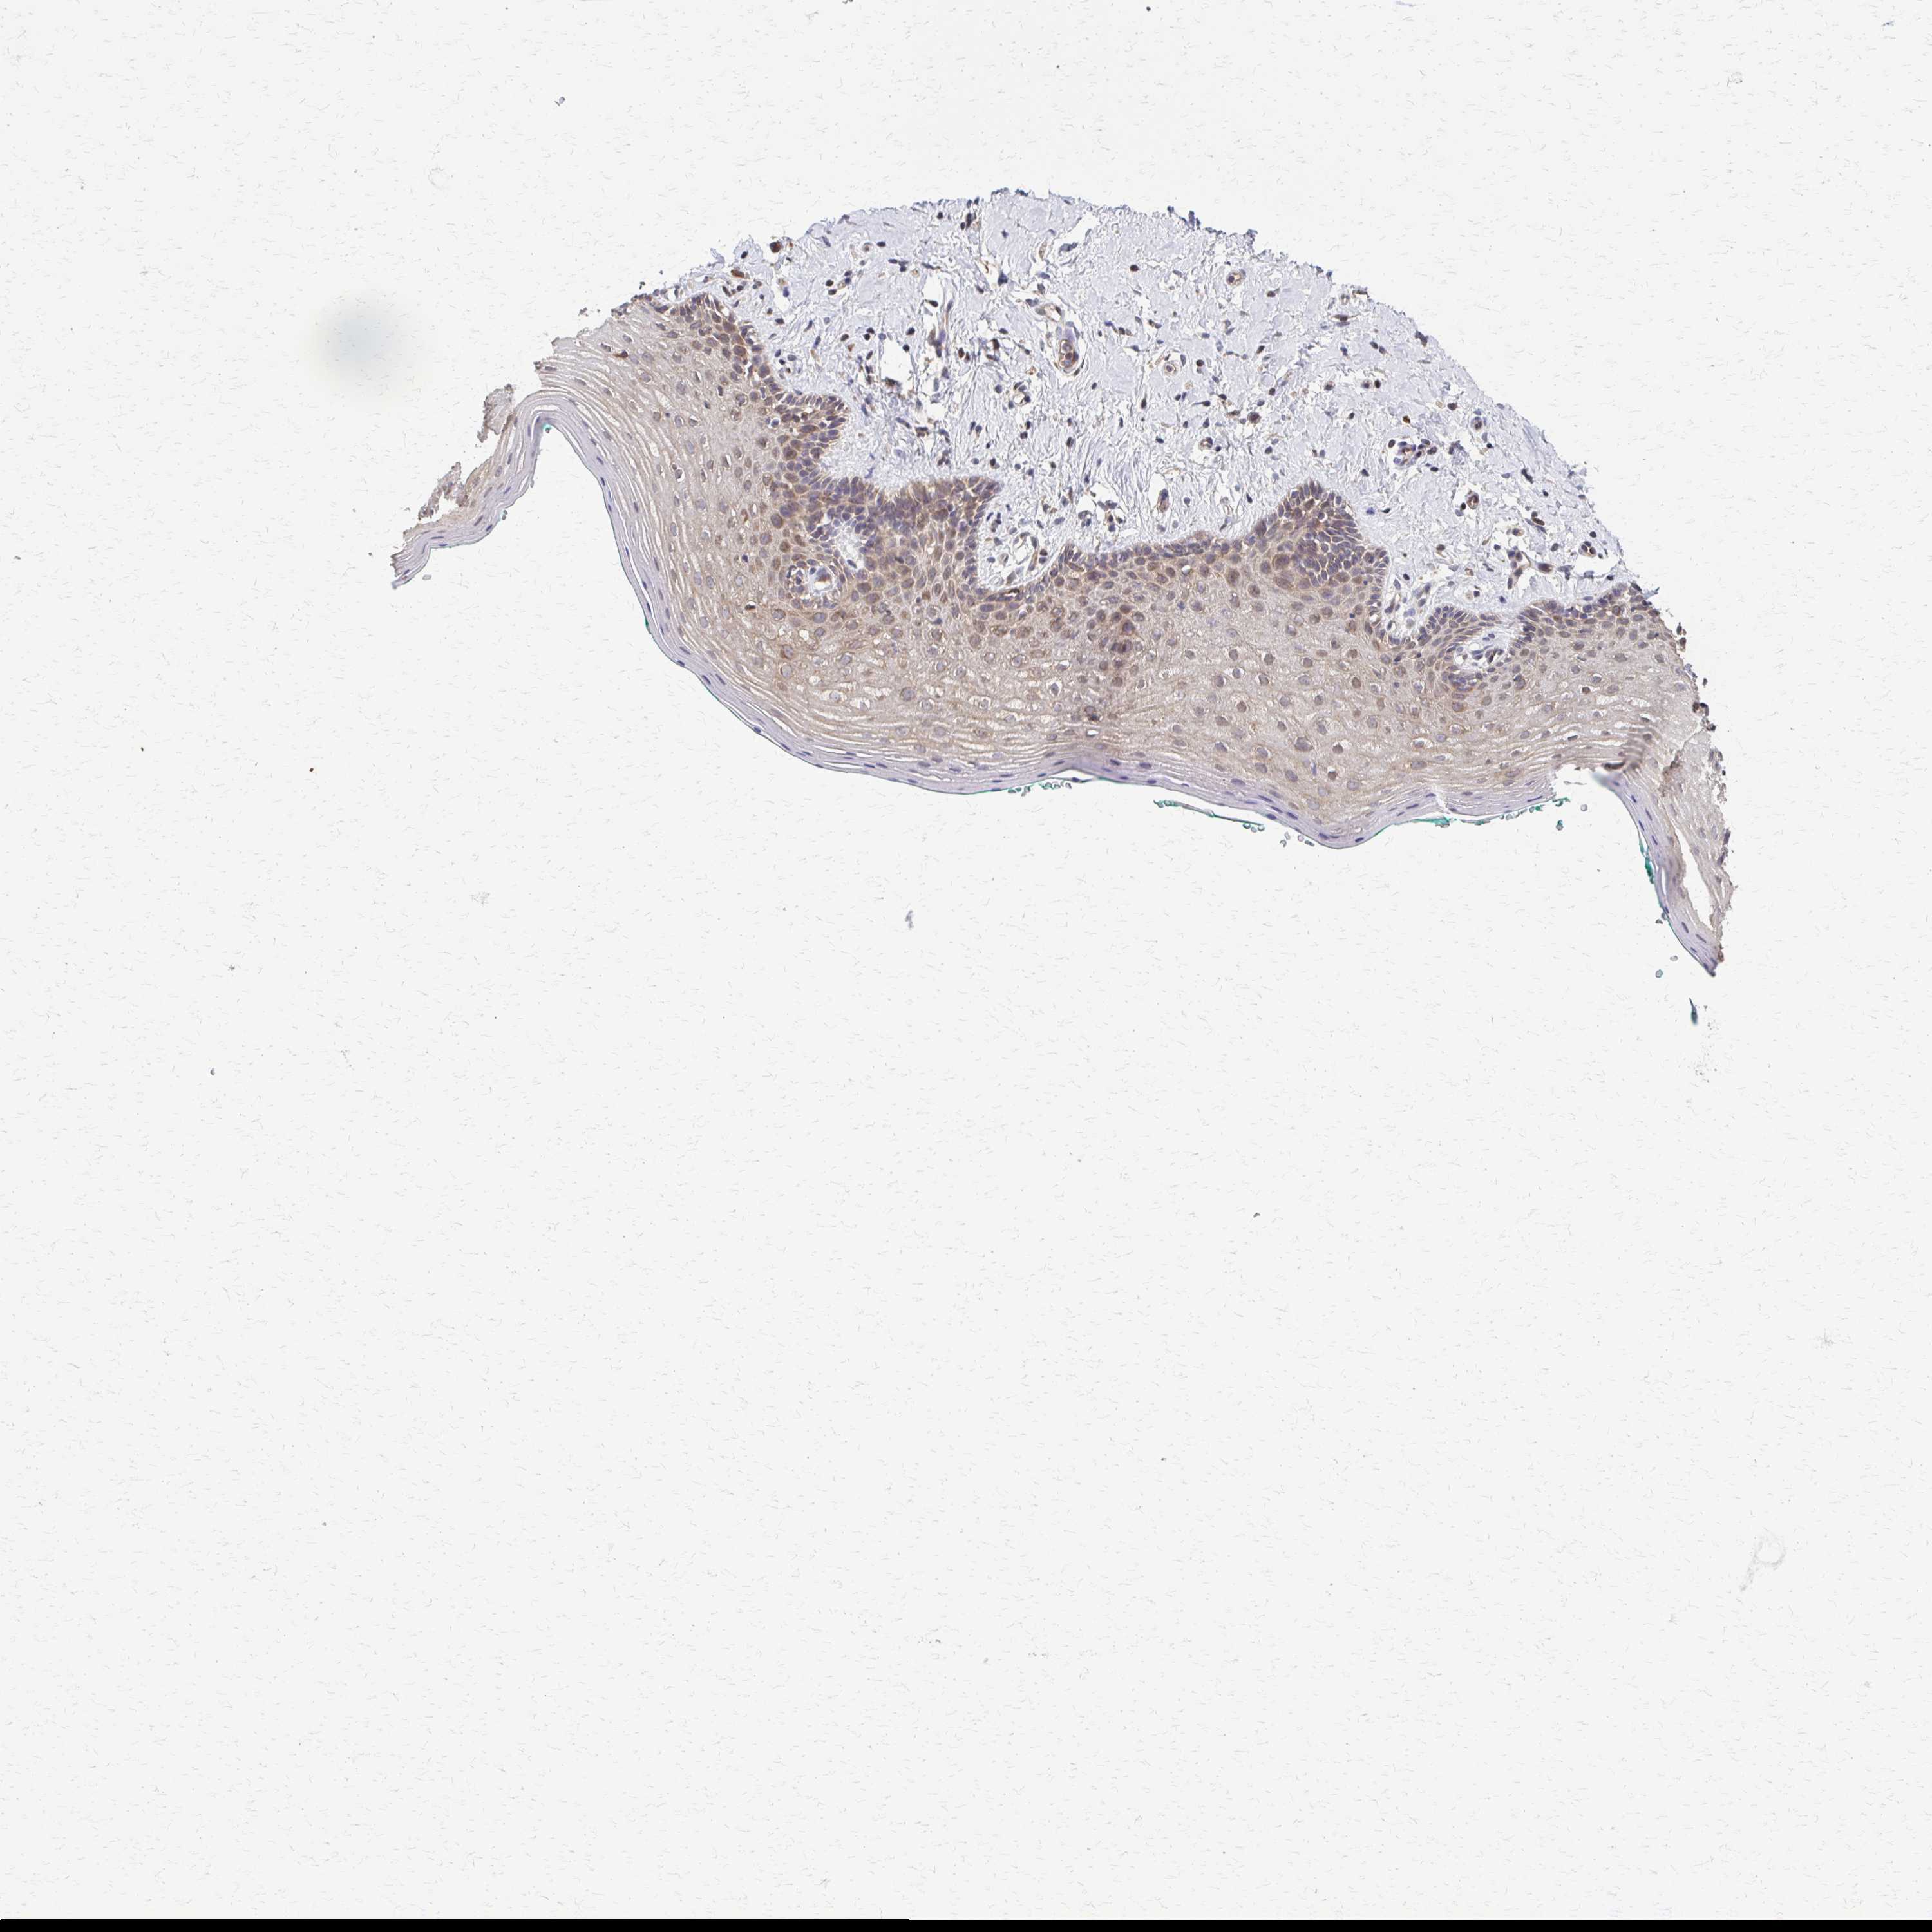
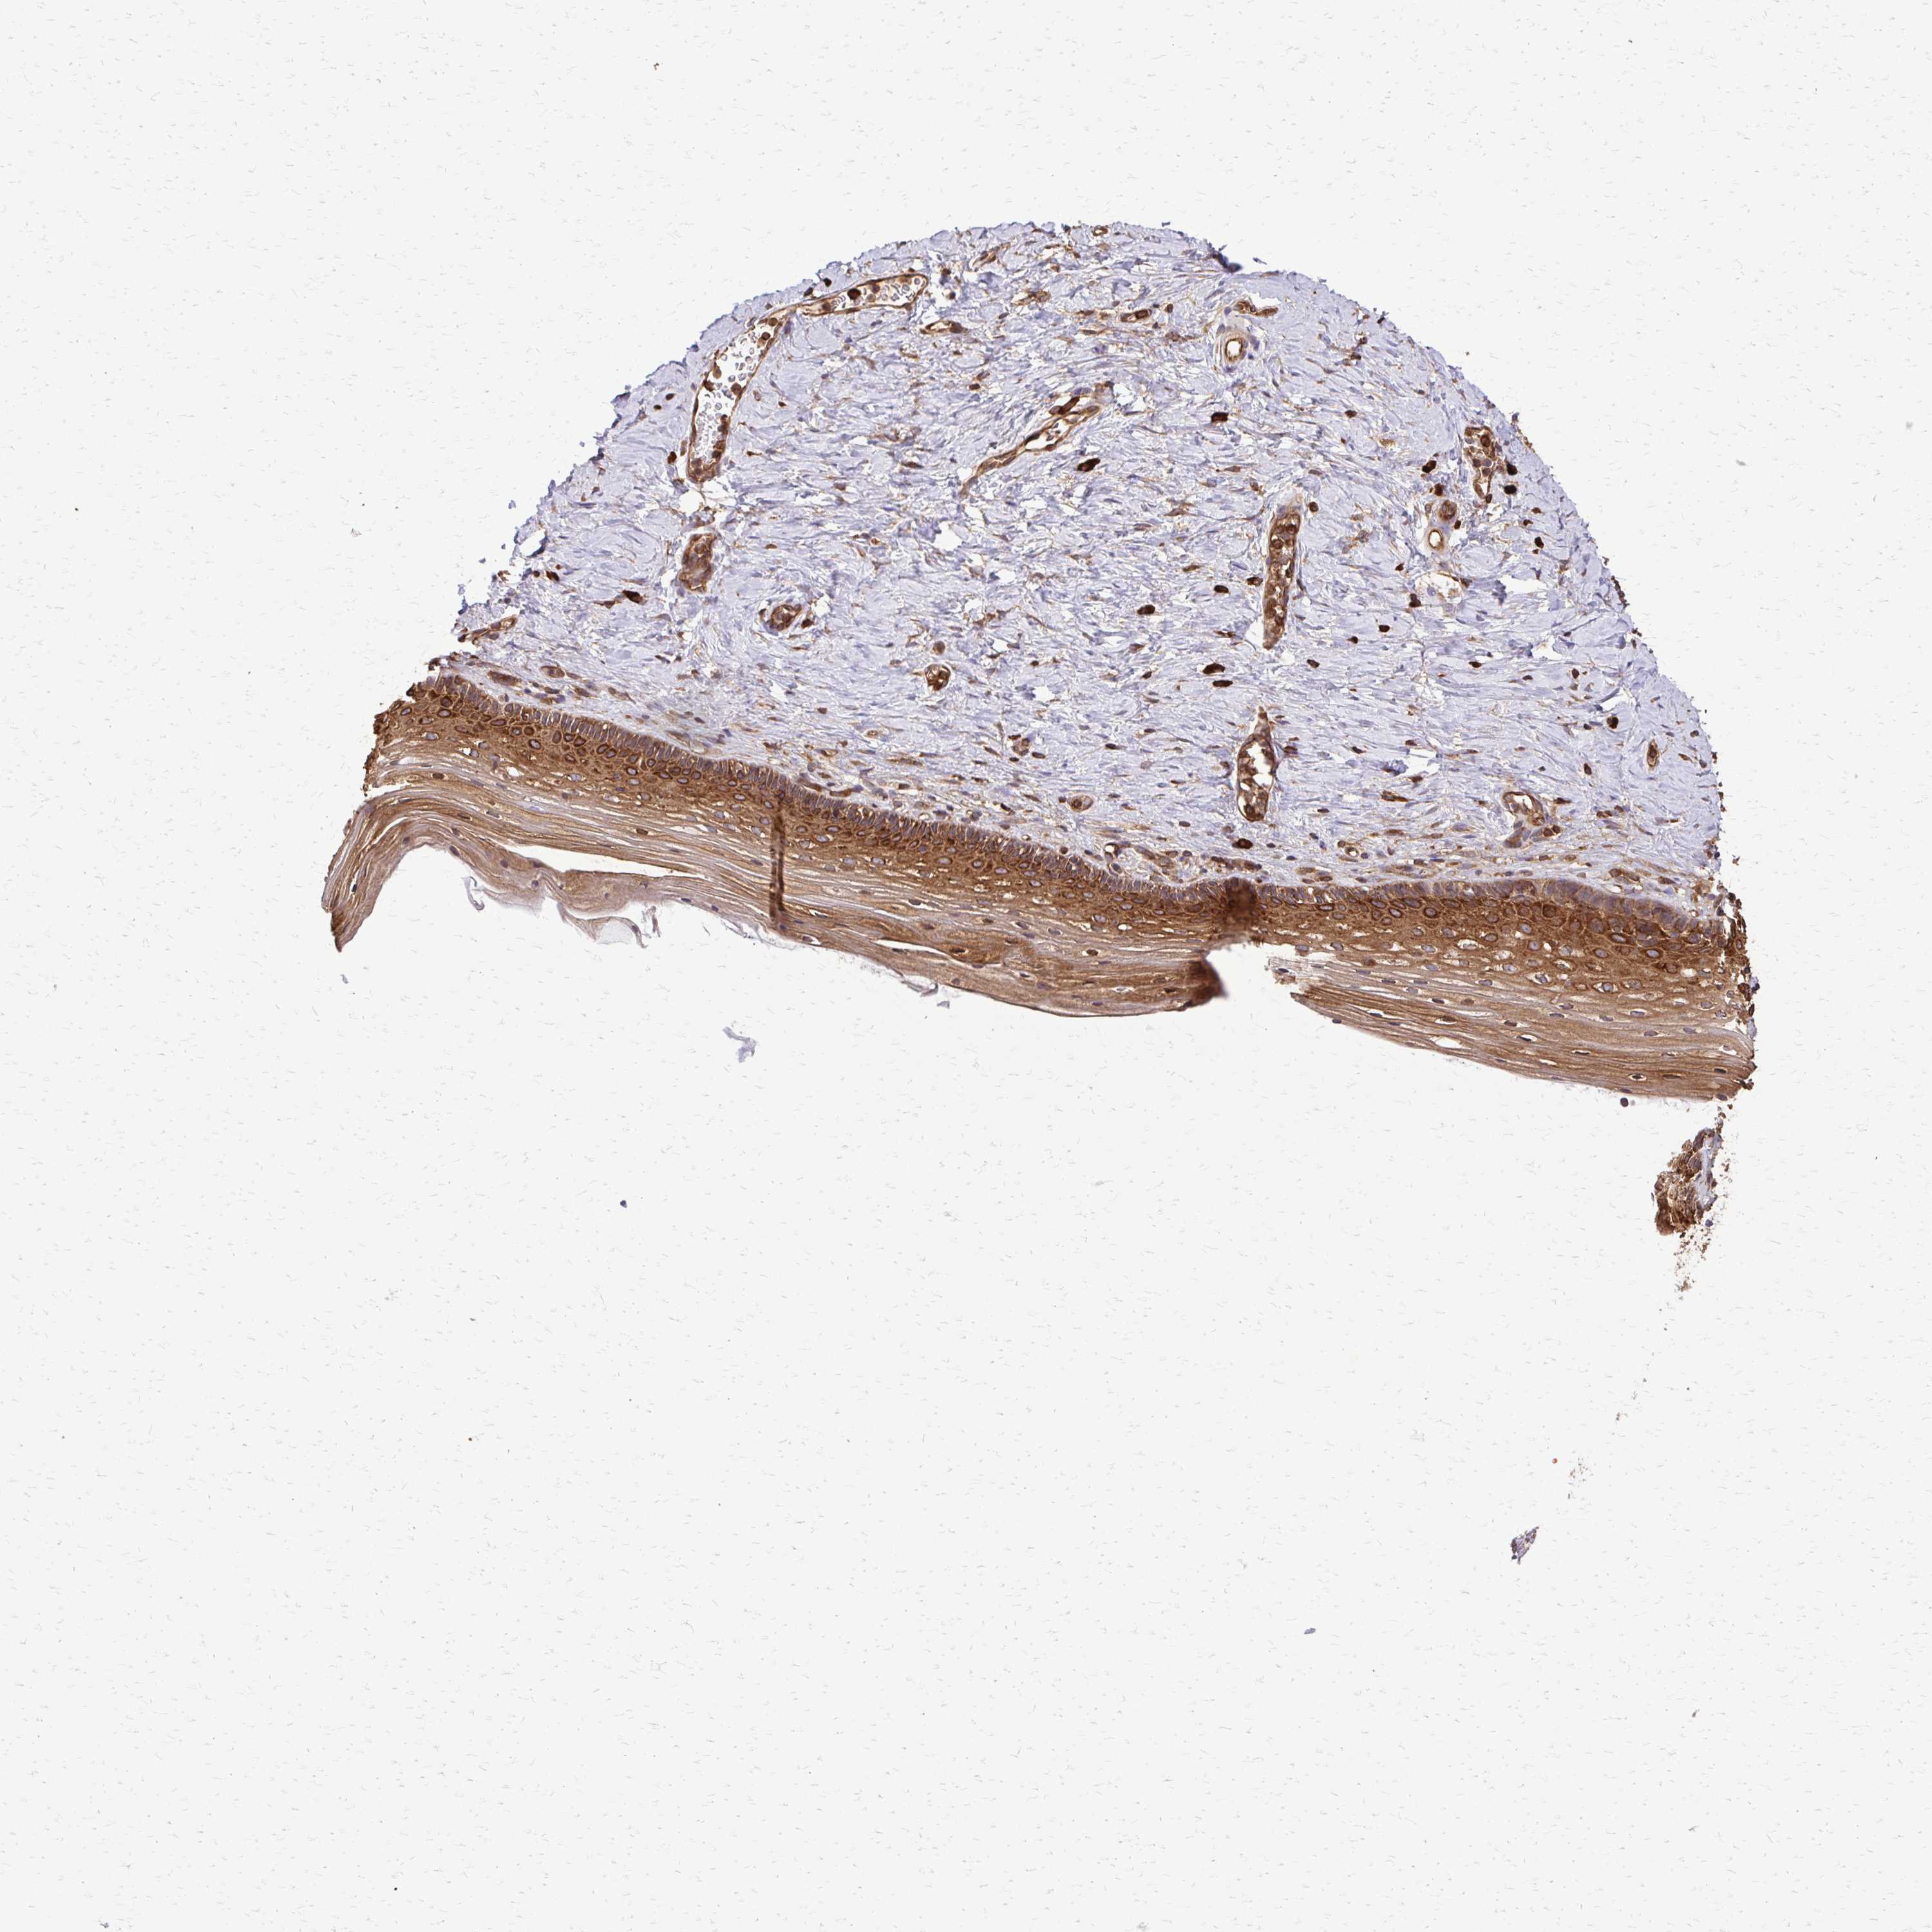
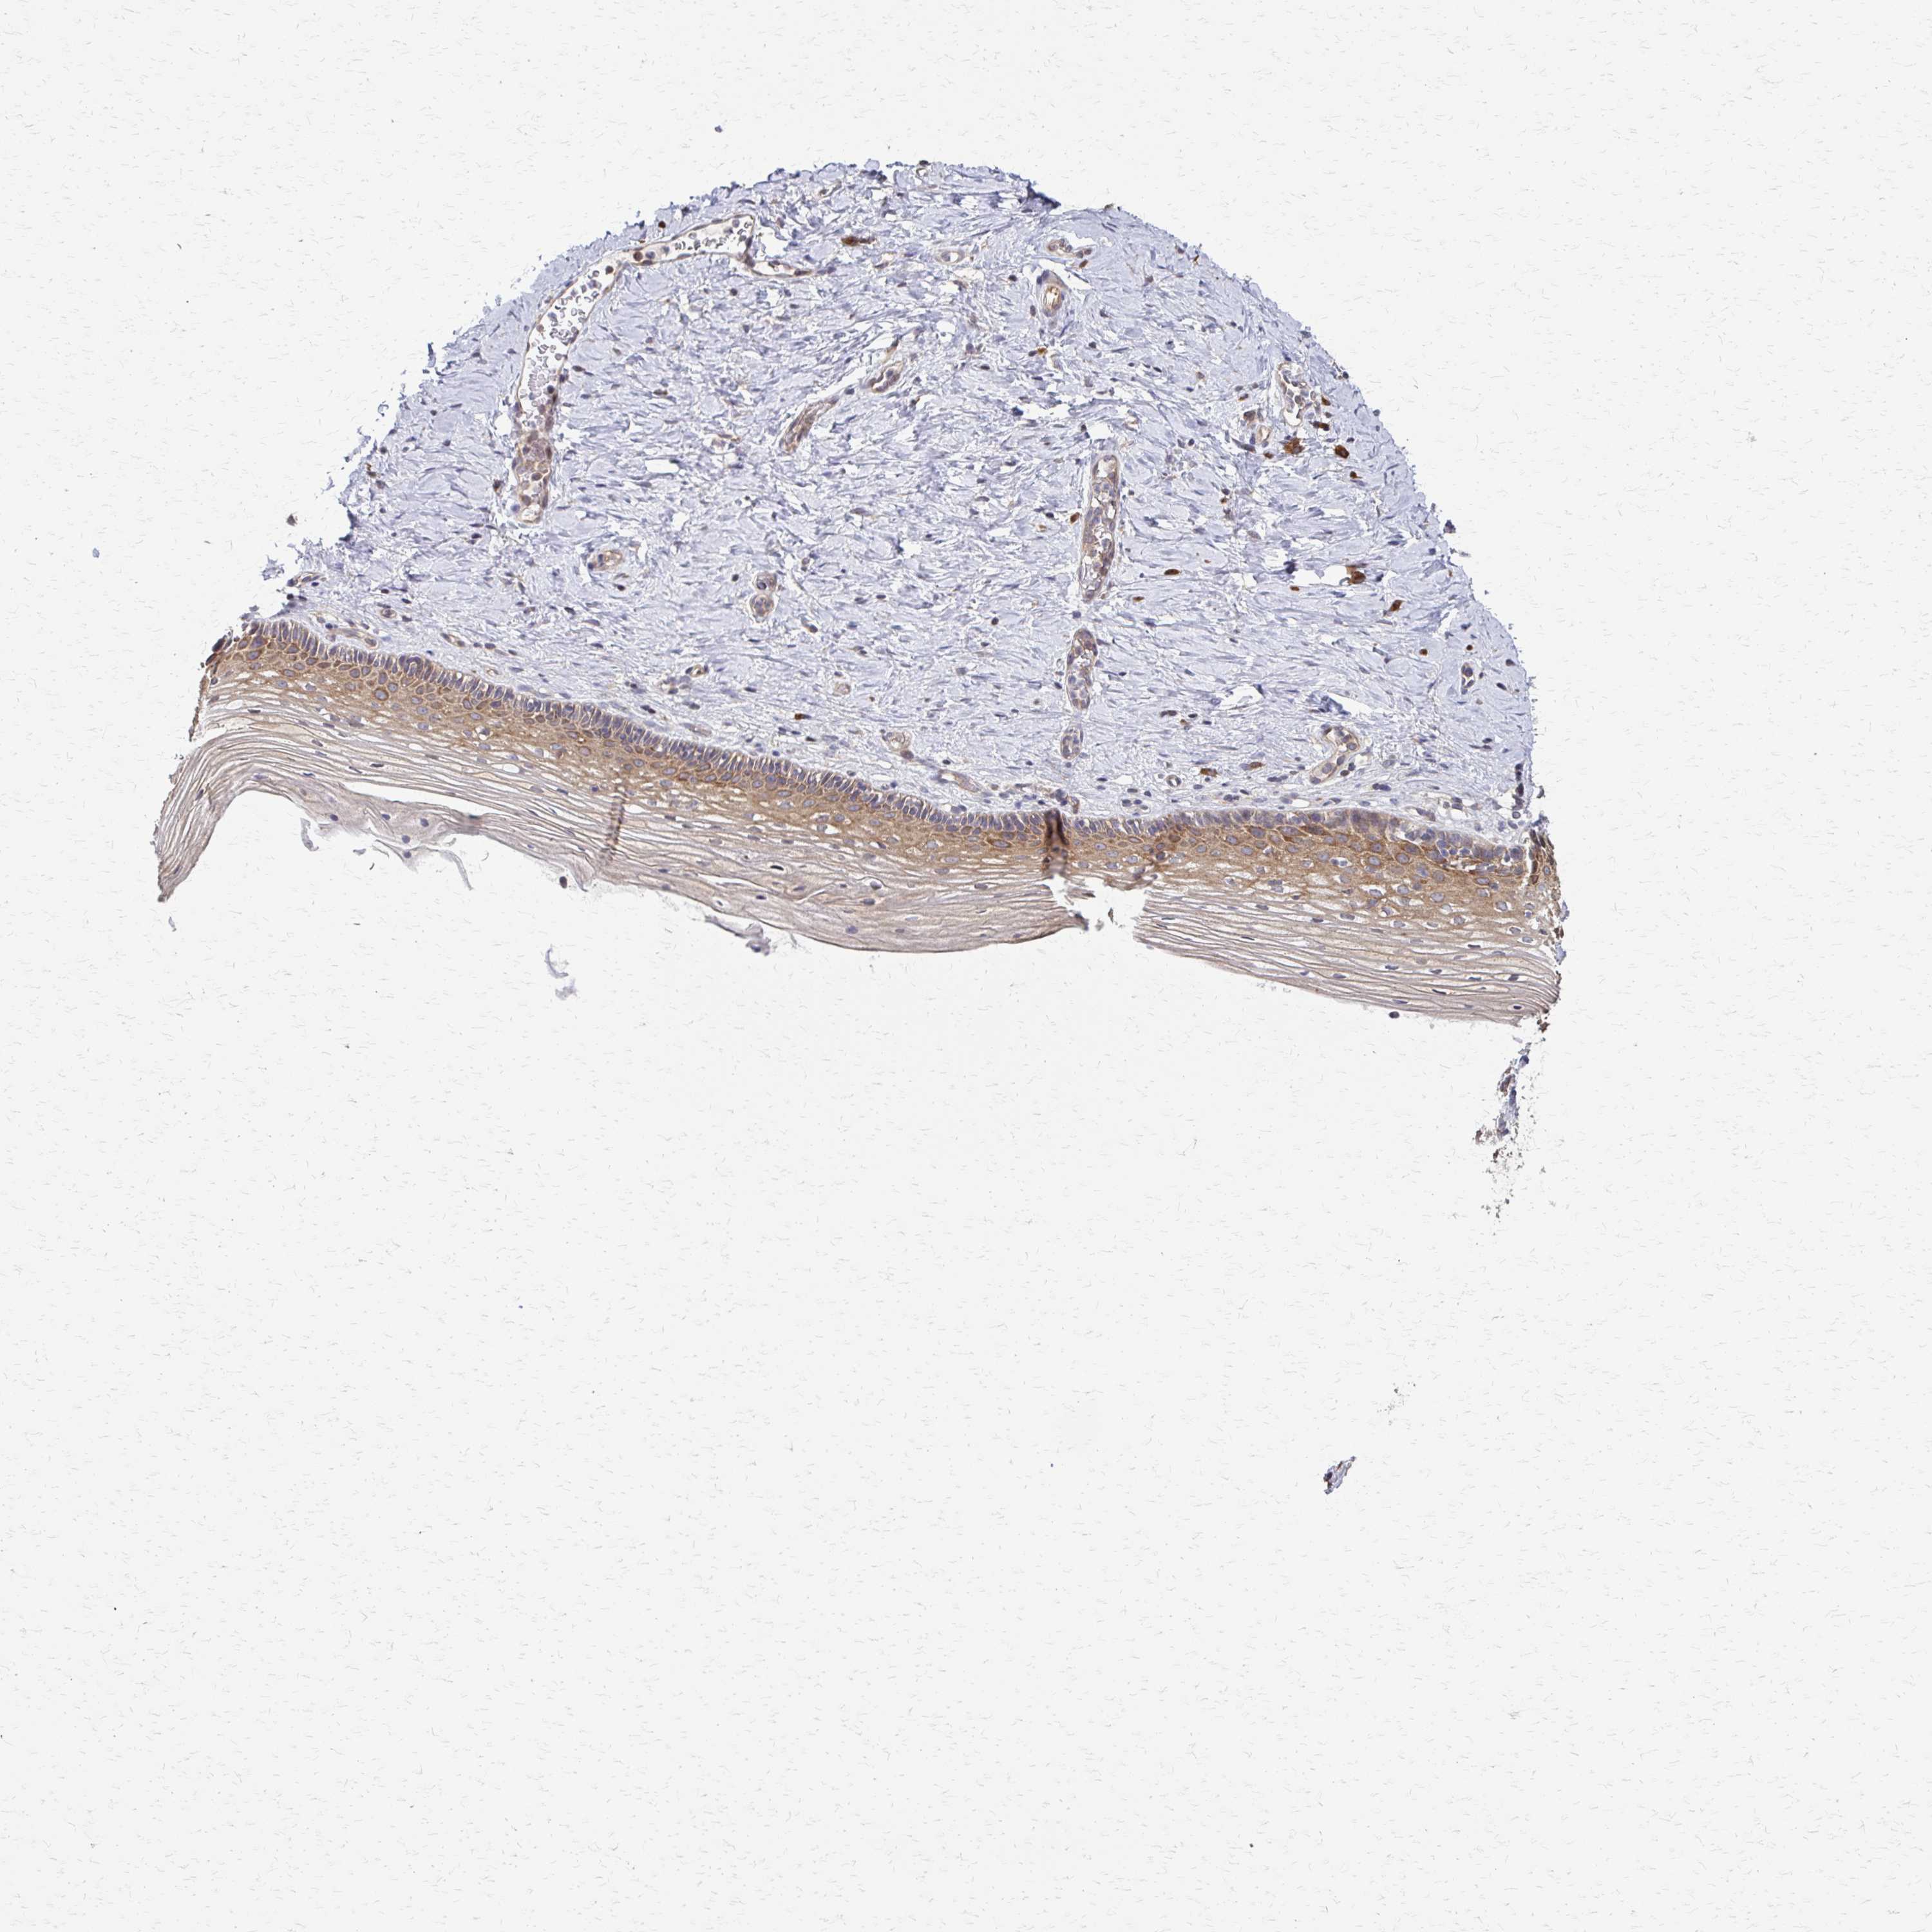
The detailed normal tissue page shows images of the stained tissue, together with antibody staining and expression level of the cell types. A knowledge-based annotated protein expression is provided for each cell type at the top of the page and the staining level of the individual antibodies is given underneath each antibody ID.
Samples from up to three different individuals have been stained for each antibody. The gender, age and tissue characterization are reported for each individual (patient) and are viewable when clicking on the image for magnification.
The images can be clicked for an enlarged view that can be panned. From the enlarged view, all stained images for all antibodies can be browsed (represented by miniature images). The miniature image with an orange overlay is the currently displayed image.
This score describes the level of antibody staining observed in the annotated cell types as not detected, low, medium, or high. It is based on the staining intensity and fraction of stained cells.
The RNA-seq details section shows detailed information about the individual samples used for the transcript profiling and results of the RNA-seq analysis.
Information about each individual sample is listed below, including gender, age, a tissue section image and estimated fractions of cell types. TPM (transcripts per million) values give a quantification of the gene abundance which is comparable between different genes and samples.
RNA-Seq data is reported as average RPKM (reads per kilobase per million mapped reads), generated by the Genotype-Tissue Expression (GTEx) project. More information can be found on the GTEx portal.
Normal distribution across the dataset is visualized with box plots, shown as median and 25th and 75th percentiles. Points are displayed as outliers if they are above or below 1.5 times the interquartile range. RPKM values of the individual samples are presented next to the box plot.
Max RPKM: 960.6
Min RPKM: 320.5
Std RPKM: 100.6
Median RPKM: 496.8
GTEX-PLZ4-2726-SM-3P61A
50-59 years, female
960.6
GTEX-Y114-1926-SM-4TT8J
50-59 years, female
770.3
GTEX-131XG-2126-SM-5DUXG
50-59 years, female
728.9
GTEX-TSE9-2526-SM-4DXUS
60-69 years, female
688.3
GTEX-ZXES-0626-SM-5E45P
30-39 years, female
660.6
GTEX-11P81-2126-SM-5HL6N
30-39 years, female
654.8
GTEX-ZYY3-2626-SM-5N9DH
60-69 years, female
650.1
GTEX-11TTK-2726-SM-5GU58
60-69 years, female
629.5
GTEX-OHPK-2526-SM-3MJH9
50-59 years, female
628.6
GTEX-S4UY-1326-SM-4AD4X
40-49 years, female
624.6
GTEX-ZAJG-2926-SM-5HL8P
50-59 years, female
622.9
GTEX-NL3G-2526-SM-4SOIE
60-69 years, female
621.0
GTEX-T2IS-1926-SM-4DM74
20-29 years, female
618.1
GTEX-X8HC-2826-SM-46MWJ
50-59 years, female
616.8
GTEX-ZTPG-2226-SM-57WF9
20-29 years, female
616.1
GTEX-P4PP-2526-SM-3P61P
30-39 years, female
614.2
GTEX-ZC5H-2226-SM-4WAWS
40-49 years, female
611.1
GTEX-13OVI-0926-SM-5J1MI
60-69 years, female
609.5
GTEX-Y8LW-1426-SM-5RQJJ
50-59 years, female
606.0
GTEX-14AS3-1726-SM-5RQJV
40-49 years, female
603.0
GTEX-T6MO-1226-SM-4DM5S
40-49 years, female
603.0
GTEX-ZVT3-2726-SM-5GU5X
60-69 years, female
601.3
GTEX-1117F-2526-SM-5GZY6
60-69 years, female
594.8
GTEX-ZQG8-1126-SM-51MRL
60-69 years, female
590.0
GTEX-RWS6-1726-SM-47JXP
60-69 years, female
585.3
GTEX-SE5C-1126-SM-4BRWZ
40-49 years, female
572.0
GTEX-13W3W-2326-SM-5LU4Y
60-69 years, female
571.8
GTEX-146FR-2426-SM-5NQAU
60-69 years, female
569.3
GTEX-Q734-1426-SM-48TZQ
40-49 years, female
568.9
GTEX-PWN1-2526-SM-48TDS
40-49 years, female
563.6
GTEX-12WSB-2426-SM-5EGJC
60-69 years, female
550.3
GTEX-ZYVF-0326-SM-5GIES
50-59 years, female
543.8
GTEX-PWOO-2026-SM-48TDE
40-49 years, female
539.0
GTEX-1399U-1526-SM-5J2N7
50-59 years, female
538.1
GTEX-ZE7O-2426-SM-57WD7
50-59 years, female
537.1
GTEX-13D11-1326-SM-5IJFY
50-59 years, female
535.9
GTEX-11EM3-1826-SM-5A5KO
20-29 years, female
528.1
GTEX-12ZZX-1926-SM-5EGKC
40-49 years, female
525.9
GTEX-13QBU-1726-SM-5IJFQ
40-49 years, female
524.9
GTEX-132AR-1626-SM-5EGHP
50-59 years, female
522.7
GTEX-131YS-2426-SM-5J2OD
60-69 years, female
519.6
GTEX-14A5I-2726-SM-5SIB3
50-59 years, female
515.8
GTEX-14BMU-1926-SM-5S2QC
20-29 years, female
509.4
GTEX-TMMY-1926-SM-4DXUU
40-49 years, female
506.4
GTEX-11DXX-1726-SM-5H11T
60-69 years, female
503.6
GTEX-13PVR-1426-SM-5S2PW
60-69 years, female
500.8
GTEX-11XUK-1326-SM-5EQM4
40-49 years, female
500.4
GTEX-ZP4G-0826-SM-4WWF3
20-29 years, female
500.4
GTEX-1399S-2326-SM-5K7YV
30-39 years, female
493.2
GTEX-12WSJ-1326-SM-5GCOB
40-49 years, female
490.6
GTEX-YFC4-2926-SM-5IFJ8
40-49 years, female
490.5
GTEX-ZV6S-1326-SM-59HJA
40-49 years, female
490.1
GTEX-WRHU-2926-SM-4MVNQ
50-59 years, female
489.1
GTEX-147F3-1526-SM-5SIAK
50-59 years, female
486.8
GTEX-13QIC-1826-SM-5J1MY
60-69 years, female
485.3
GTEX-W5WG-1026-SM-4LMIF
50-59 years, female
481.3
GTEX-S4P3-1126-SM-4AD52
50-59 years, female
479.9
GTEX-113JC-1926-SM-5N9GE
50-59 years, female
474.0
GTEX-11EMC-1926-SM-5A5JU
60-69 years, female
471.8
GTEX-ZZPU-2226-SM-5EGIV
50-59 years, female
470.5
GTEX-WEY5-0826-SM-4LMIH
40-49 years, female
469.1
GTEX-U3ZN-0926-SM-4DXTU
30-39 years, female
464.7
GTEX-QDT8-2526-SM-48TYX
30-39 years, female
463.4
GTEX-OHPL-2526-SM-3MJGT
60-69 years, female
463.1
GTEX-13U4I-2026-SM-5LU3L
40-49 years, female
462.1
GTEX-UJHI-1326-SM-4IHJO
50-59 years, female
460.6
GTEX-13PL7-2726-SM-5L3GB
60-69 years, female
452.0
GTEX-N7MT-1926-SM-3LK5N
60-69 years, female
451.2
GTEX-P78B-2226-SM-3P5ZZ
40-49 years, female
449.1
GTEX-RU1J-1426-SM-46MUV
20-29 years, female
442.9
GTEX-13N11-1526-SM-5L3FL
50-59 years, female
440.3
GTEX-14DAQ-2326-SM-5S2QX
60-69 years, female
438.3
GTEX-XUW1-0326-SM-4BOOR
50-59 years, female
436.7
GTEX-PWCY-1726-SM-48TD3
20-29 years, female
435.8
GTEX-QCQG-1226-SM-48U23
50-59 years, female
434.9
GTEX-TML8-1126-SM-4DXSS
40-49 years, female
429.2
GTEX-YJ8O-1226-SM-5P9JE
40-49 years, female
425.0
GTEX-ZGAY-2226-SM-4YCCX
40-49 years, female
420.4
GTEX-11VI4-0726-SM-5GU5B
40-49 years, female
419.6
GTEX-ZVT2-0626-SM-5GICR
50-59 years, female
417.4
GTEX-XUJ4-1626-SM-4BONV
60-69 years, female
415.2
GTEX-145ME-1426-SM-5RQJS
40-49 years, female
412.0
GTEX-ZYWO-2026-SM-5GIDA
40-49 years, female
411.6
GTEX-PX3G-2526-SM-48TZV
20-29 years, female
410.7
GTEX-QVJO-2526-SM-4R1KB
60-69 years, female
406.1
GTEX-S341-1226-SM-4AD5S
40-49 years, female
404.8
GTEX-12WSD-2926-SM-5LZUH
60-69 years, female
403.3
GTEX-146FH-2626-SM-5Q5E1
50-59 years, female
401.9
GTEX-ZLWG-1126-SM-4WWFQ
50-59 years, female
397.0
GTEX-XV7Q-1626-SM-4BRWC
40-49 years, female
393.8
GTEX-11GSP-2226-SM-5HL5Q
60-69 years, female
389.1
GTEX-X15G-1926-SM-4PQZQ
50-59 years, female
381.2
GTEX-11I78-2026-SM-5987C
50-59 years, female
371.4
GTEX-S7SF-1426-SM-4AT5A
20-29 years, female
366.1
GTEX-UPIC-1426-SM-4IHLQ
20-29 years, female
335.8
GTEX-Y3IK-2226-SM-4YCD4
50-59 years, female
320.5
Show all
VAGINA - FANTOM5 CAGEi
Tissue data obtained through Cap Analysis of Gene Expression (CAGE) are reported as Tags Per Million, generated by the FANTOM5 project. More information can be found here.
 The Human Protein Atlas project is funded


 MENU
MENU