We use cookies to enhance the usability of our website. If you continue, we'll assume that you are happy to receive all cookies. More information. Don't show this again.
The protein expression bar, with the units not detected (n), low (l), medium (m) and high (h), is based on a best estimate of the true protein expression for proteins where the antibody staining pattern has been analyzed by knowledge-based annotation. For genes where more than one antibody has been used, a collective score is set. For details, see Assays & annotation.
h
m
l
n
RNA expressioni
RNA expression shows average values based on RNA-seq data generated by HPA, the Genotype-Tissue Expression (GTEx) consortium or the FANTOM5 consortium.
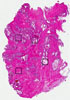
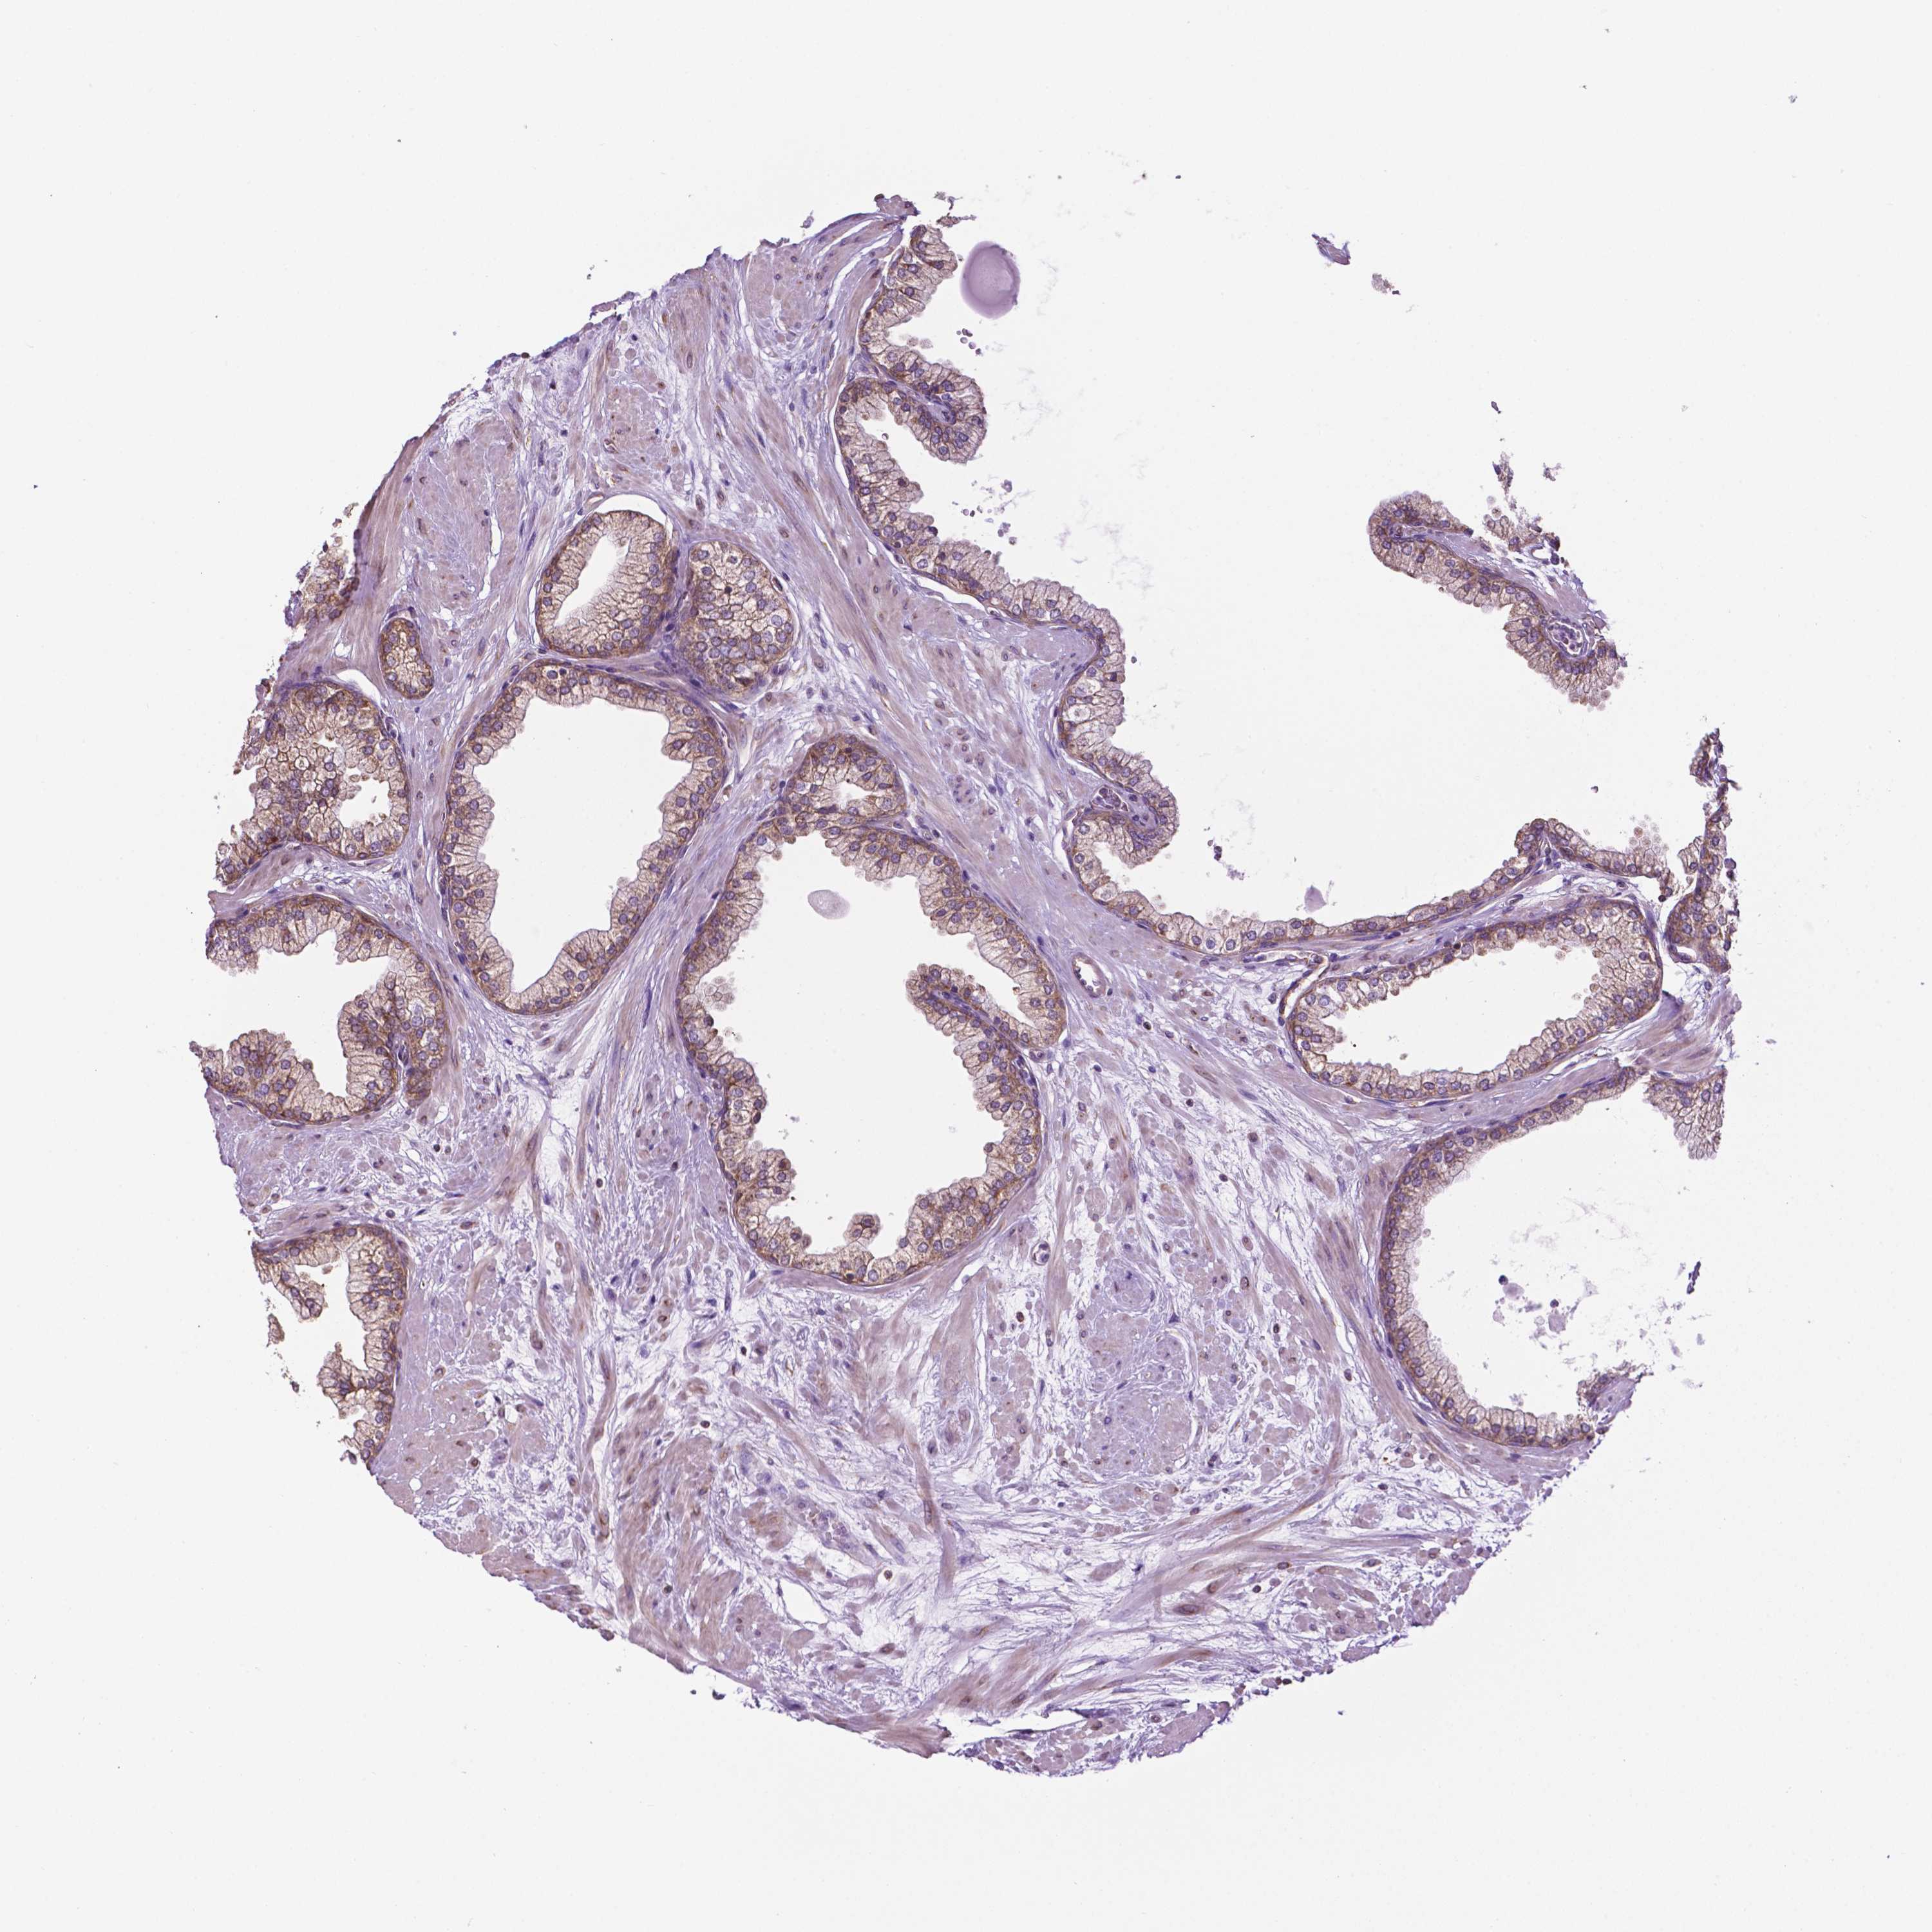
The detailed normal tissue page shows images of the stained tissue, together with antibody staining and expression level of the cell types. A knowledge-based annotated protein expression is provided for each cell type at the top of the page and the staining level of the individual antibodies is given underneath each antibody ID.
Samples from up to three different individuals have been stained for each antibody. The gender, age and tissue characterization are reported for each individual (patient) and are viewable when clicking on the image for magnification.
The images can be clicked for an enlarged view that can be panned. From the enlarged view, all stained images for all antibodies can be browsed (represented by miniature images). The miniature image with an orange overlay is the currently displayed image.
This score describes the level of antibody staining observed in the annotated cell types as not detected, low, medium, or high. It is based on the staining intensity and fraction of stained cells.
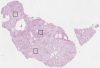
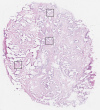
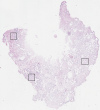
The RNA-seq details section shows detailed information about the individual samples used for the transcript profiling and results of the RNA-seq analysis.
Information about each individual sample is listed below, including gender, age, a tissue section image and estimated fractions of cell types. TPM (transcripts per million) values give a quantification of the gene abundance which is comparable between different genes and samples.
RNA-Seq data is reported as average RPKM (reads per kilobase per million mapped reads), generated by the Genotype-Tissue Expression (GTEx) project. More information can be found on the GTEx portal.
Normal distribution across the dataset is visualized with box plots, shown as median and 25th and 75th percentiles. Points are displayed as outliers if they are above or below 1.5 times the interquartile range. RPKM values of the individual samples are presented next to the box plot.
Max RPKM: 364.5
Min RPKM: 132.1
Std RPKM: 51.6
Median RPKM: 220.0
GTEX-13NYS-1026-SM-5KLZT
60-69 years, male
364.5
GTEX-V1D1-1926-SM-4JBGX
50-59 years, male
354.4
GTEX-ZLFU-1726-SM-4WWBU
40-49 years, male
352.9
GTEX-146FQ-1726-SM-5QGPX
30-39 years, male
344.4
GTEX-1399T-1226-SM-5P9J5
60-69 years, male
334.5
GTEX-NPJ8-2426-SM-3MJHL
40-49 years, male
330.1
GTEX-U412-2026-SM-4DXSI
60-69 years, male
328.3
GTEX-13RTJ-2126-SM-5S2PZ
60-69 years, male
326.9
GTEX-13FHO-2826-SM-5K7ZA
60-69 years, male
323.3
GTEX-13FXS-2826-SM-5LZYC
50-59 years, male
321.9
GTEX-14ABY-0726-SM-5Q5DF
50-59 years, male
312.9
GTEX-XQ3S-2526-SM-4BOOG
20-29 years, male
308.1
GTEX-12ZZZ-2026-SM-5LZWJ
60-69 years, male
307.6
GTEX-SJXC-2026-SM-4DM6N
60-69 years, male
303.8
GTEX-UTHO-2726-SM-4JBH9
60-69 years, male
303.4
GTEX-ZUA1-2826-SM-59HLE
40-49 years, male
289.5
GTEX-11O72-2726-SM-5HL6K
40-49 years, male
287.9
GTEX-11DYG-2526-SM-5N9BB
60-69 years, male
282.8
GTEX-11ZUS-2126-SM-5N9E6
30-39 years, male
281.2
GTEX-132NY-2826-SM-5P9G2
60-69 years, male
280.1
GTEX-V955-1826-SM-4JBIL
60-69 years, male
274.2
GTEX-145LV-1226-SM-5S2QH
50-59 years, male
268.5
GTEX-ZTX8-1026-SM-5EGHD
20-29 years, male
266.8
GTEX-139T6-1526-SM-5P9G6
50-59 years, male
265.7
GTEX-13OW8-0426-SM-5J2NR
60-69 years, male
265.2
GTEX-WFON-1626-SM-4LVMV
40-49 years, male
264.2
GTEX-WZTO-0926-SM-4PQZ3
40-49 years, male
262.9
GTEX-ZPU1-2026-SM-57WFI
40-49 years, male
262.9
GTEX-11EQ9-1726-SM-5HL6U
30-39 years, male
262.0
GTEX-111FC-2026-SM-5GZYO
60-69 years, male
260.6
GTEX-REY6-2126-SM-48FD9
60-69 years, male
260.1
GTEX-YF7O-1926-SM-4W1YQ
50-59 years, male
259.9
GTEX-RWSA-2026-SM-47JX8
40-49 years, male
256.1
GTEX-NFK9-2226-SM-3MJGP
40-49 years, male
253.9
GTEX-SNMC-0926-SM-4DM5U
20-29 years, male
253.1
GTEX-11TUW-2126-SM-5GU7B
60-69 years, male
252.3
GTEX-X5EB-1826-SM-4E3K8
40-49 years, male
252.0
GTEX-WK11-2626-SM-4OOSK
50-59 years, male
251.4
GTEX-OIZH-2026-SM-3NB1M
50-59 years, male
246.9
GTEX-14C5O-2826-SM-5RQI6
60-69 years, male
241.7
GTEX-QEG4-2226-SM-4R1JM
30-39 years, male
239.1
GTEX-XAJ8-0626-SM-47JY4
40-49 years, male
235.3
GTEX-S4Q7-1026-SM-4AD75
20-29 years, male
233.2
GTEX-WH7G-1726-SM-4LVKY
40-49 years, male
231.4
GTEX-117YW-1426-SM-5EGGO
50-59 years, male
227.6
GTEX-148VJ-1826-SM-5Q5DV
70-79 years, male
226.0
GTEX-XPVG-2026-SM-4B65E
50-59 years, male
224.8
GTEX-QMRM-1426-SM-4R1K8
50-59 years, male
224.6
GTEX-WFG8-1826-SM-4LVM4
20-29 years, male
224.6
GTEX-Y9LG-1826-SM-4VBQC
30-39 years, male
222.8
GTEX-132QS-1126-SM-5P9GC
60-69 years, male
221.3
GTEX-13N2G-1826-SM-5KM1I
60-69 years, male
220.7
GTEX-Q2AI-1126-SM-48U19
40-49 years, male
220.1
GTEX-XGQ4-1826-SM-4AT6F
50-59 years, male
219.9
GTEX-145LT-0626-SM-5O99E
40-49 years, male
219.7
GTEX-U3ZM-0926-SM-4DXSW
40-49 years, male
219.7
GTEX-SNOS-1026-SM-4DM4Y
40-49 years, male
218.9
GTEX-QV44-1526-SM-4R1KI
50-59 years, male
218.4
GTEX-ZTTD-2726-SM-57WFA
50-59 years, male
216.8
GTEX-XMK1-1026-SM-4B65H
40-49 years, male
215.3
GTEX-T8EM-1826-SM-4DM7F
40-49 years, male
215.0
GTEX-PLZ6-1126-SM-3P5ZR
30-39 years, male
214.8
GTEX-U8XE-2526-SM-4E3IT
30-39 years, male
214.2
GTEX-XOTO-2826-SM-4B65I
50-59 years, male
206.4
GTEX-12696-2226-SM-5EQ65
60-69 years, male
205.9
GTEX-14BMV-2326-SM-5RQJ4
50-59 years, male
204.7
GTEX-13O61-1726-SM-5KM46
60-69 years, male
202.9
GTEX-ZY6K-1526-SM-5GZXE
50-59 years, male
202.0
GTEX-11WQK-2726-SM-5EQMU
50-59 years, male
201.8
GTEX-RM2N-1126-SM-48FCY
50-59 years, male
201.2
GTEX-YJ8A-1126-SM-5IFJU
20-29 years, male
201.1
GTEX-13O21-1126-SM-5N9EV
50-59 years, male
199.8
GTEX-11OF3-1726-SM-5GU5Q
60-69 years, male
198.4
GTEX-13FTW-1226-SM-5LZZ1
40-49 years, male
195.8
GTEX-1399R-0526-SM-5IJEF
30-39 years, male
195.4
GTEX-QV31-1026-SM-4R1K3
30-39 years, male
195.4
GTEX-S3XE-1326-SM-4AD4H
50-59 years, male
194.5
GTEX-117YX-1526-SM-5H12T
50-59 years, male
194.4
GTEX-13G51-2326-SM-5LZXV
60-69 years, male
193.2
GTEX-11TT1-2026-SM-5EQM8
20-29 years, male
192.7
GTEX-U4B1-1426-SM-4DXTX
40-49 years, male
192.3
GTEX-S33H-1826-SM-4AD65
30-39 years, male
191.5
GTEX-11P82-1126-SM-5BC5K
20-29 years, male
190.6
GTEX-111YS-1726-SM-5GIED
60-69 years, male
187.9
GTEX-Y8E4-2126-SM-5RQHO
40-49 years, male
187.6
GTEX-OOBK-2025-SM-3LK5S
40-49 years, male
187.1
GTEX-ZZ64-0926-SM-5E44L
20-29 years, male
186.1
GTEX-11NSD-0826-SM-5986S
20-29 years, male
185.4
GTEX-S95S-1026-SM-4B64M
60-69 years, male
184.5
GTEX-WFG7-1826-SM-3GIL1
20-29 years, male
184.4
GTEX-WOFM-0326-SM-4OOSL
20-29 years, male
183.7
GTEX-YB5E-1826-SM-5IFI4
40-49 years, male
182.3
GTEX-ZDYS-1226-SM-5IJF3
50-59 years, male
180.7
GTEX-ZT9W-1626-SM-4YCDQ
50-59 years, male
180.6
GTEX-13111-1326-SM-5GCNO
50-59 years, male
180.1
GTEX-144GM-0826-SM-5O98R
20-29 years, male
179.6
GTEX-12C56-1326-SM-5FQSV
20-29 years, male
175.1
GTEX-QLQ7-1326-SM-4R1JY
60-69 years, male
172.0
GTEX-111CU-1526-SM-5N9FS
50-59 years, male
167.4
GTEX-14E6E-1126-SM-5S2R4
30-39 years, male
164.7
GTEX-OOBJ-2026-SM-3NB1R
60-69 years, male
163.8
GTEX-12BJ1-1226-SM-5LUAE
60-69 years, male
163.4
GTEX-ZVP2-0826-SM-59HJ6
50-59 years, male
159.3
GTEX-VJYA-1226-SM-3GIJ6
60-69 years, male
154.2
GTEX-131XF-1926-SM-5DUW4
60-69 years, male
147.6
GTEX-11P7K-0626-SM-5985Z
30-39 years, male
132.1
Show all
PROSTATE - FANTOM5 CAGEi
Tissue data obtained through Cap Analysis of Gene Expression (CAGE) are reported as Tags Per Million, generated by the FANTOM5 project. More information can be found here.
 The Human Protein Atlas project is funded


 MENU
MENU


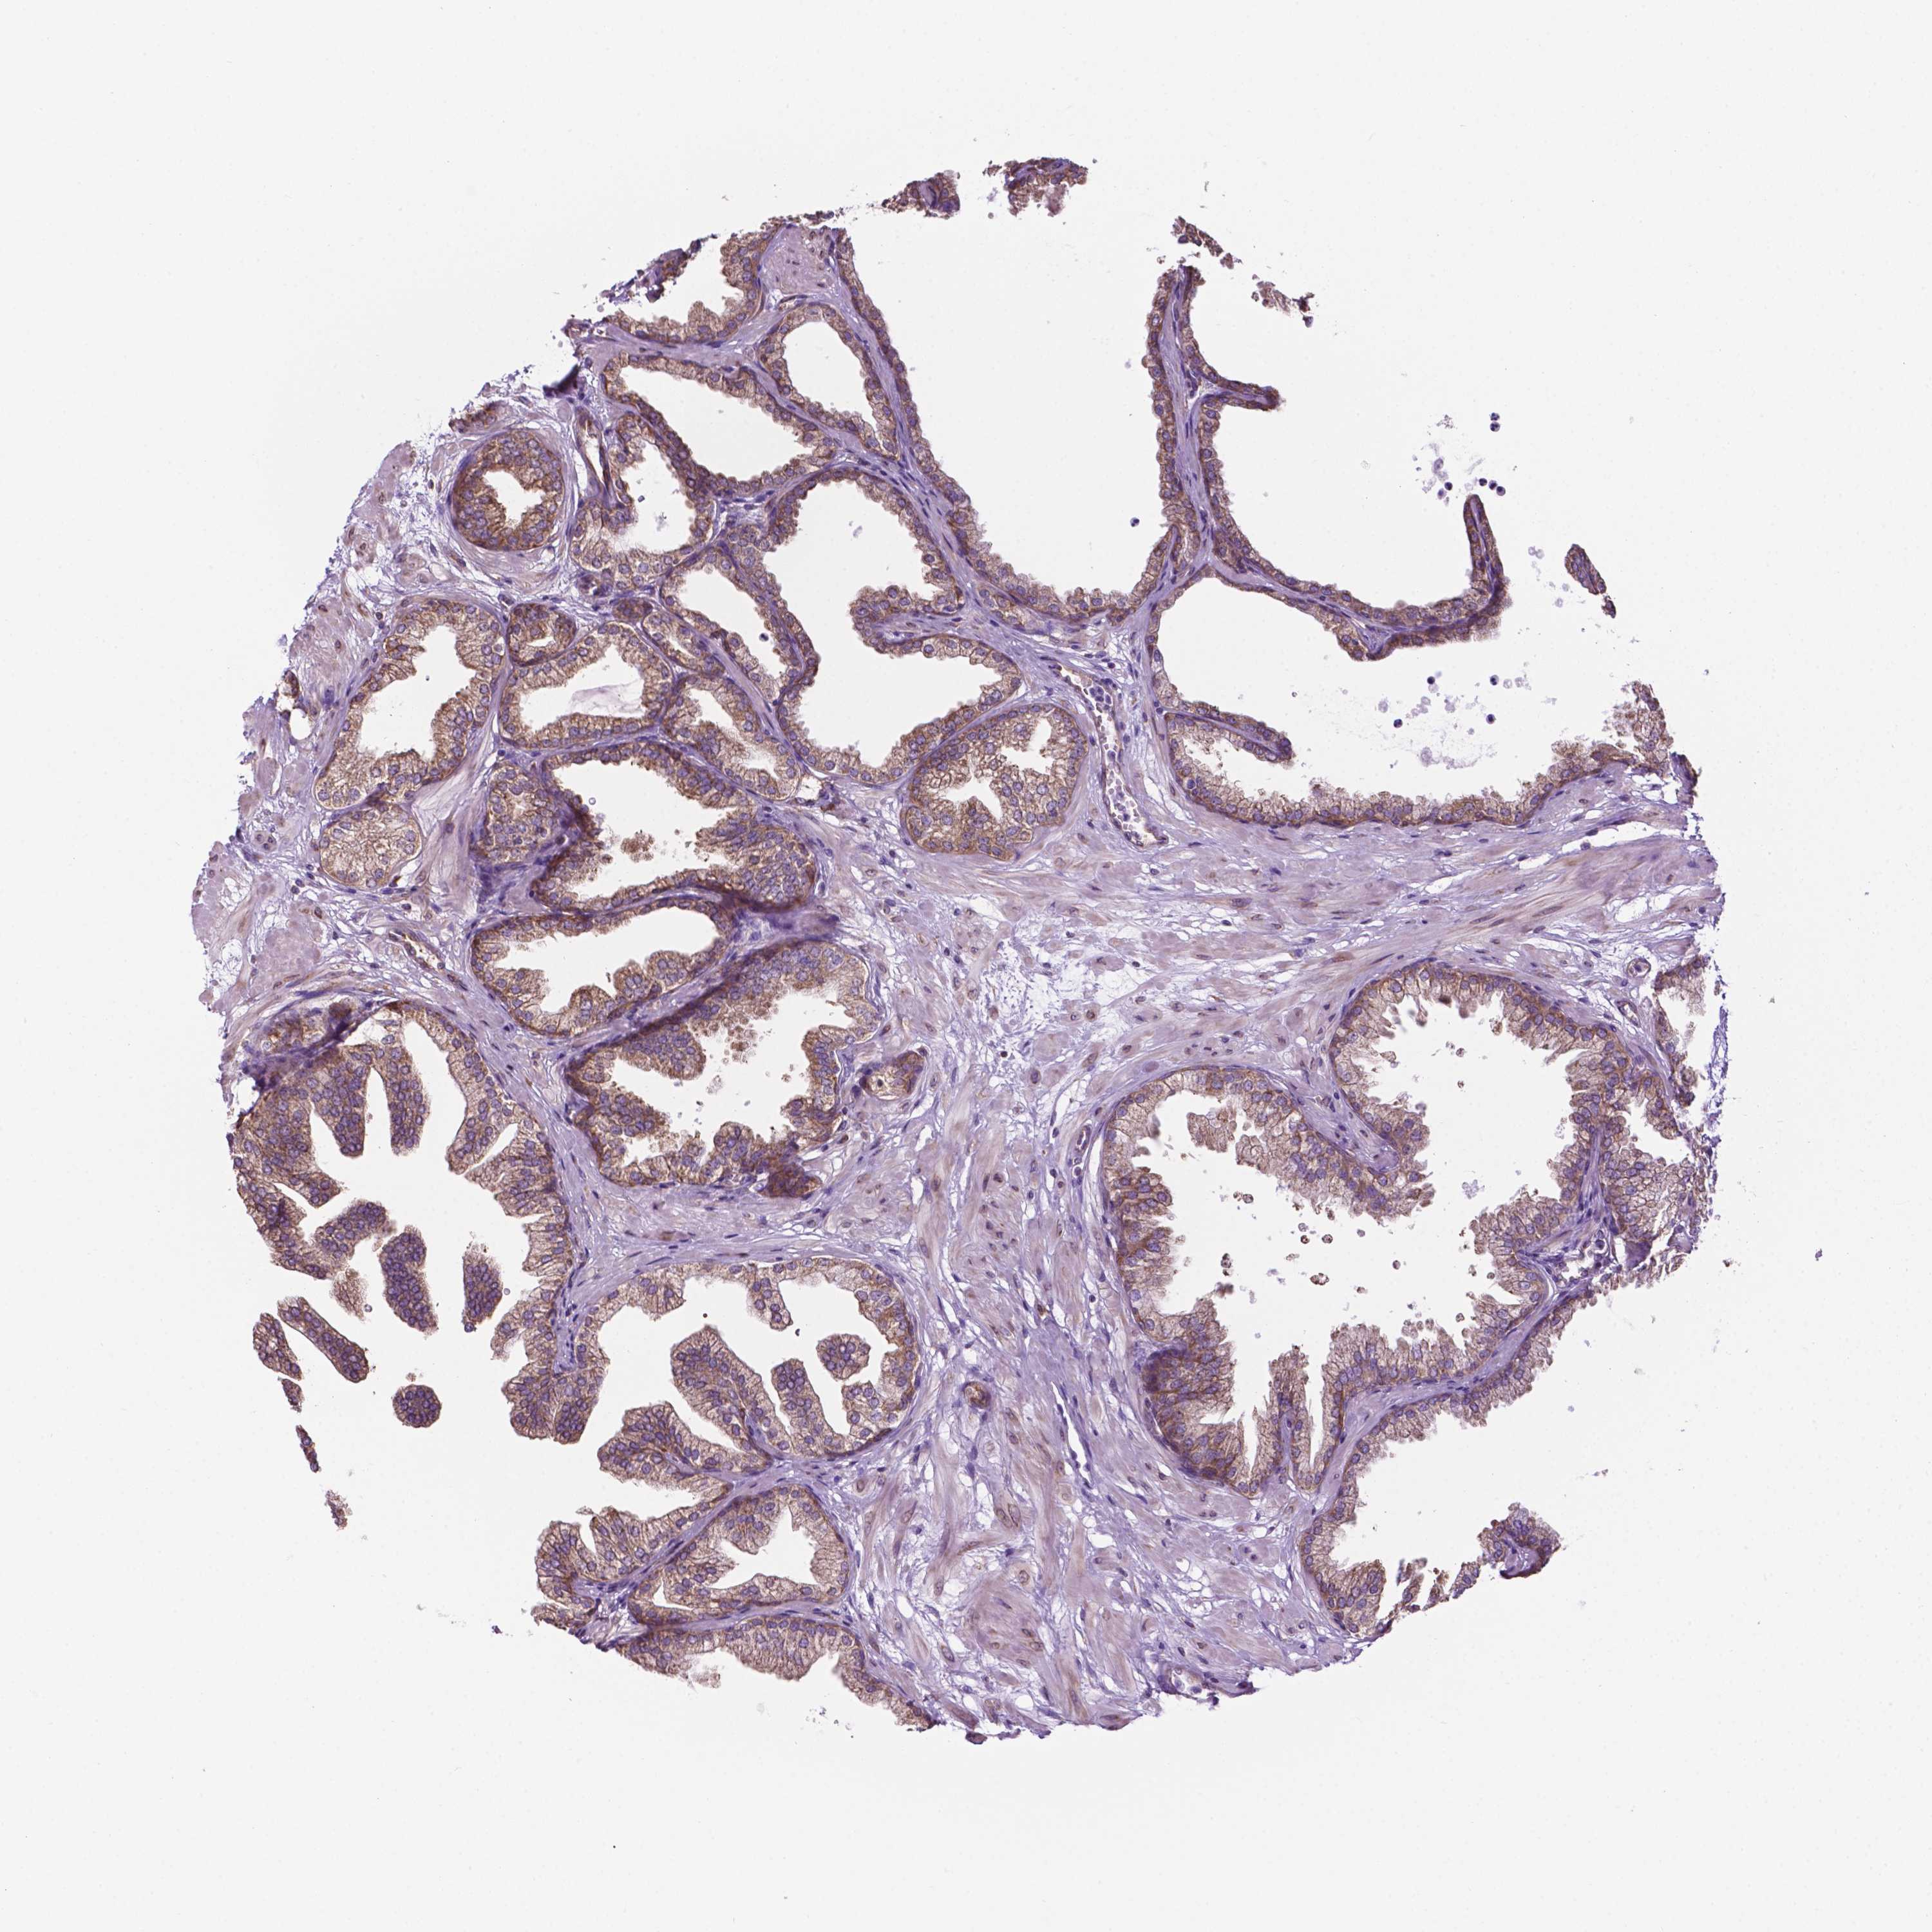

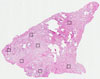
 Male, age 65