We use cookies to enhance the usability of our website. If you continue, we'll assume that you are happy to receive all cookies. More information. Don't show this again.
The protein expression bar, with the units not detected (n), low (l), medium (m) and high (h), is based on a best estimate of the true protein expression for proteins where the antibody staining pattern has been analyzed by knowledge-based annotation. For genes where more than one antibody has been used, a collective score is set. For details, see Assays & annotation.
h
m
l
n
RNA expressioni
RNA expression shows average values based on RNA-seq data generated by HPA, the Genotype-Tissue Expression (GTEx) consortium or the FANTOM5 consortium.
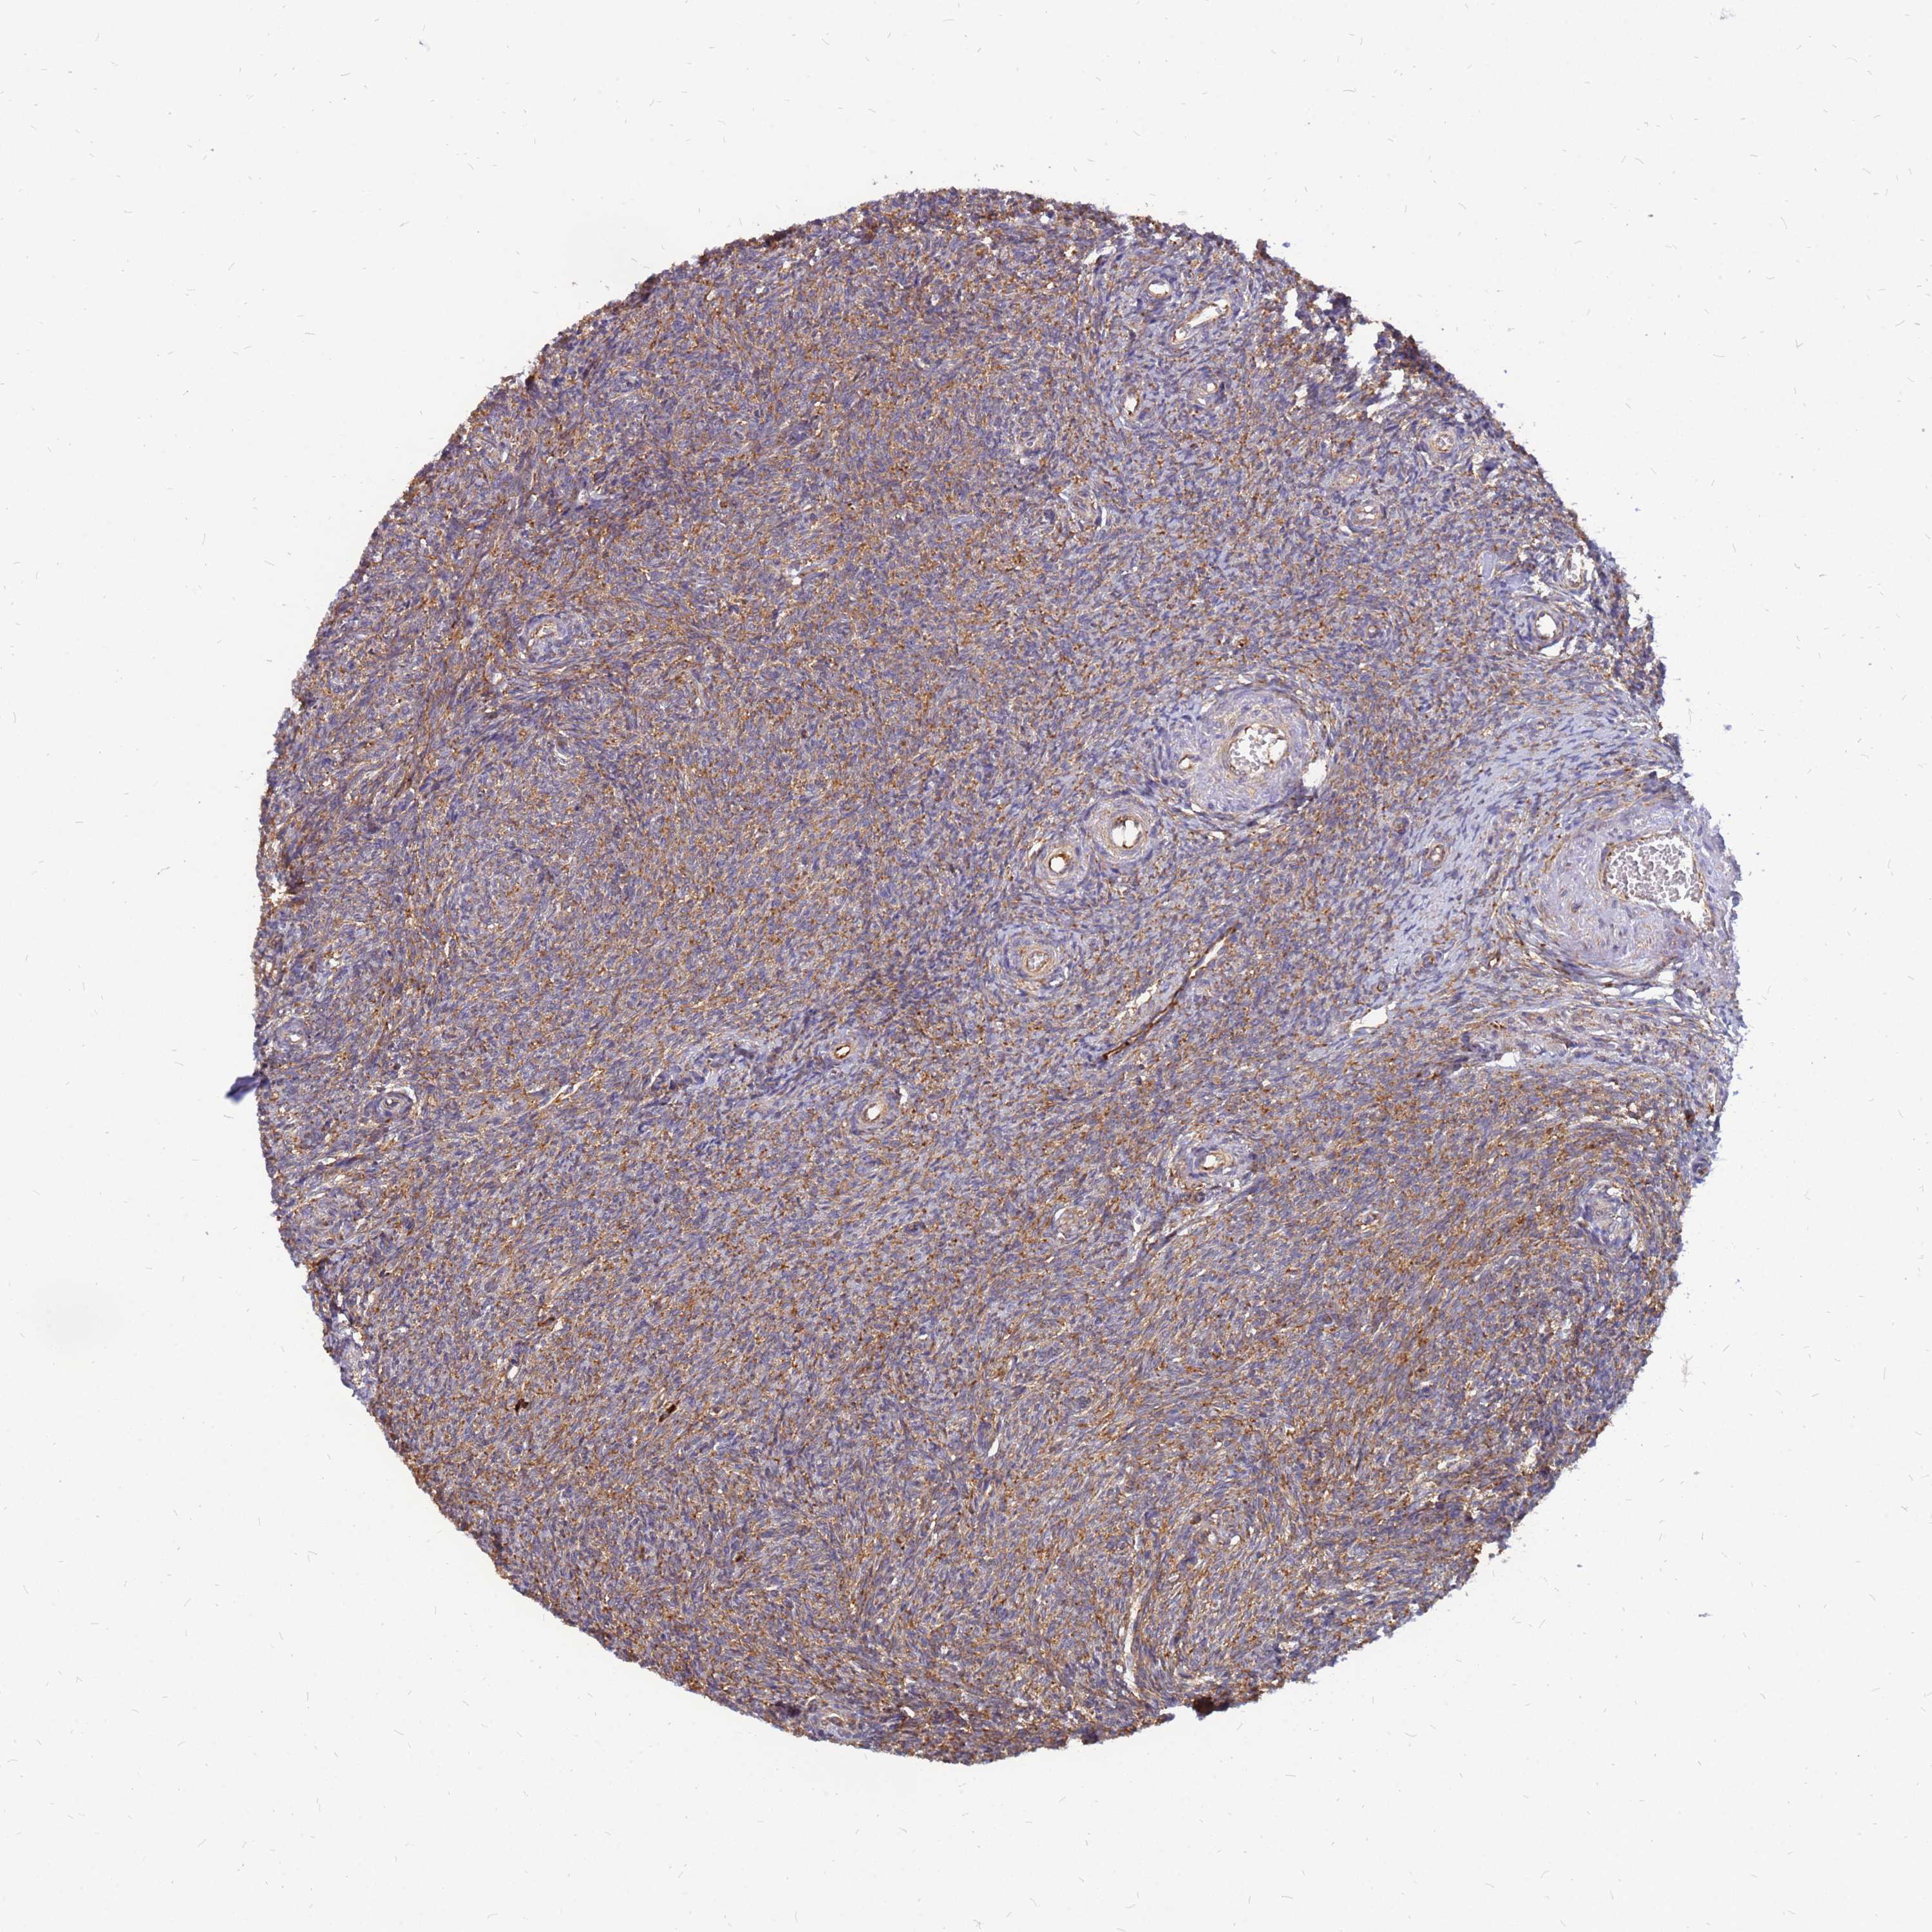
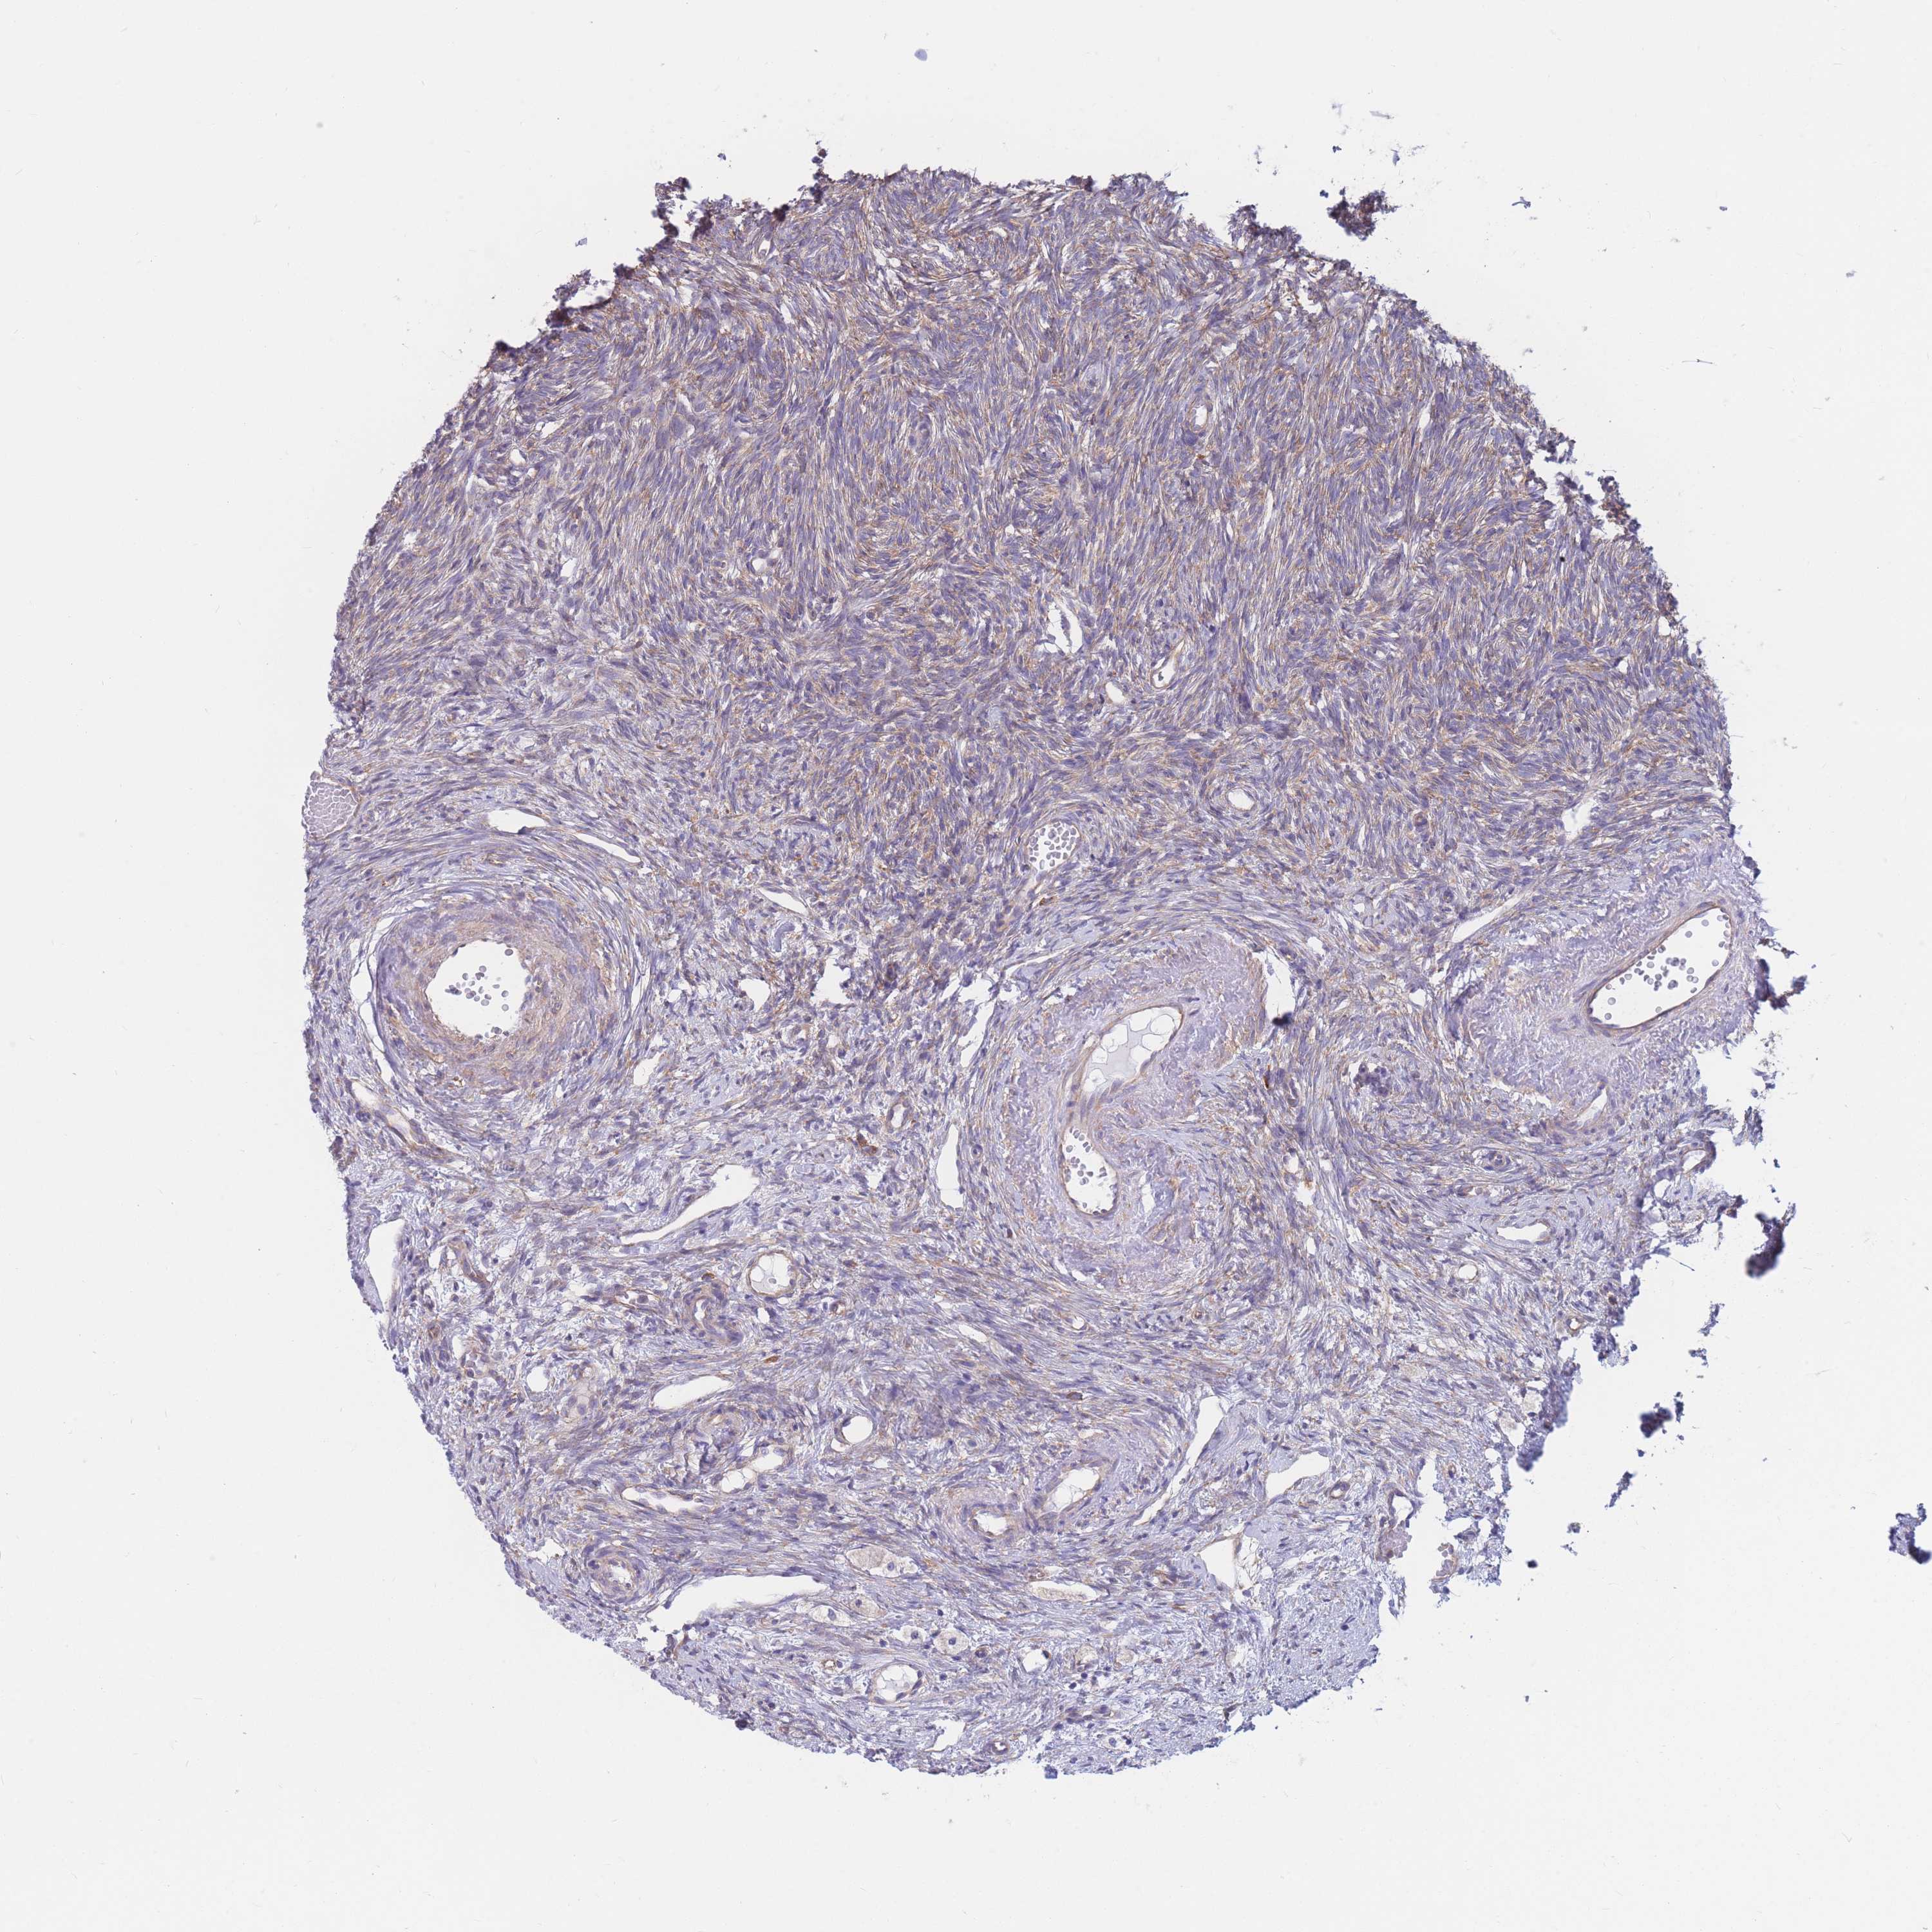
The detailed normal tissue page shows images of the stained tissue, together with antibody staining and expression level of the cell types. A knowledge-based annotated protein expression is provided for each cell type at the top of the page and the staining level of the individual antibodies is given underneath each antibody ID.
Samples from up to three different individuals have been stained for each antibody. The gender, age and tissue characterization are reported for each individual (patient) and are viewable when clicking on the image for magnification.
The images can be clicked for an enlarged view that can be panned. From the enlarged view, all stained images for all antibodies can be browsed (represented by miniature images). The miniature image with an orange overlay is the currently displayed image.
This score describes the level of antibody staining observed in the annotated cell types as not detected, low, medium, or high. It is based on the staining intensity and fraction of stained cells.
The RNA-seq details section shows detailed information about the individual samples used for the transcript profiling and results of the RNA-seq analysis.
Information about each individual sample is listed below, including gender, age, a tissue section image and estimated fractions of cell types. TPM (transcripts per million) values give a quantification of the gene abundance which is comparable between different genes and samples.
RNA-Seq data is reported as average RPKM (reads per kilobase per million mapped reads), generated by the Genotype-Tissue Expression (GTEx) project. More information can be found on the GTEx portal.
Normal distribution across the dataset is visualized with box plots, shown as median and 25th and 75th percentiles. Points are displayed as outliers if they are above or below 1.5 times the interquartile range. RPKM values of the individual samples are presented next to the box plot.
Max RPKM: 2574.1
Min RPKM: 846.2
Std RPKM: 331.4
Median RPKM: 1408.0
GTEX-12WSB-2226-SM-5GCOS
60-69 years, female
2574.1
GTEX-WWYW-2726-SM-4MVOP
50-59 years, female
2146.3
GTEX-RTLS-2326-SM-46MUH
60-69 years, female
2142.7
GTEX-XMD3-2326-SM-4AT5H
50-59 years, female
2112.7
GTEX-PLZ4-2826-SM-3P617
50-59 years, female
2066.4
GTEX-13OVI-0726-SM-5L3DD
60-69 years, female
2044.5
GTEX-11ZVC-1426-SM-5EGGA
50-59 years, female
1998.1
GTEX-ZAJG-2726-SM-5S2MU
50-59 years, female
1981.8
GTEX-13OVJ-2426-SM-5KM3I
50-59 years, female
1980.2
GTEX-TSE9-2226-SM-4DXUR
60-69 years, female
1959.2
GTEX-12ZZX-2026-SM-5LZV9
40-49 years, female
1959.1
GTEX-QVJO-3126-SM-4R1KC
60-69 years, female
1958.5
GTEX-1313W-2726-SM-5P9IX
50-59 years, female
1952.9
GTEX-X8HC-2726-SM-46MUA
50-59 years, female
1948.2
GTEX-YFC4-2726-SM-5IFJW
40-49 years, female
1932.6
GTEX-ZVT3-2626-SM-5GU5L
60-69 years, female
1906.2
GTEX-RU72-2226-SM-46MUE
50-59 years, female
1895.3
GTEX-1269C-1826-SM-5N9E1
60-69 years, female
1814.1
GTEX-X15G-1726-SM-4PQZN
50-59 years, female
1784.9
GTEX-13U4I-2126-SM-5LU55
40-49 years, female
1775.5
GTEX-XUJ4-1326-SM-4BOQ9
60-69 years, female
1758.6
GTEX-139D8-2426-SM-5KM3A
30-39 years, female
1752.8
GTEX-13X6H-1026-SM-5SIBE
50-59 years, female
1730.8
GTEX-14AS3-1326-SM-5RQJE
40-49 years, female
1706.1
GTEX-131YS-2226-SM-5P9G8
60-69 years, female
1702.6
GTEX-11EMC-1726-SM-5H11P
60-69 years, female
1695.5
GTEX-ZC5H-2026-SM-5CVN2
40-49 years, female
1660.9
GTEX-OHPK-2426-SM-3MJGH
50-59 years, female
1598.6
GTEX-ZPIC-1426-SM-4WWCP
40-49 years, female
1528.2
GTEX-Y3IK-2026-SM-4YCDG
50-59 years, female
1520.3
GTEX-PX3G-2426-SM-48TZZ
20-29 years, female
1511.6
GTEX-S4P3-0926-SM-4AD54
50-59 years, female
1498.8
GTEX-OHPL-2426-SM-48TDN
60-69 years, female
1489.7
GTEX-WI4N-2526-SM-4OOSE
40-49 years, female
1487.0
GTEX-P78B-1926-SM-3P616
40-49 years, female
1482.7
GTEX-12WSK-1926-SM-5LZVK
40-49 years, female
1475.9
GTEX-T2IS-2026-SM-4DM6W
20-29 years, female
1473.9
GTEX-T5JW-0426-SM-4DM7M
20-29 years, female
1459.4
GTEX-11VI4-1026-SM-5EQM1
40-49 years, female
1454.5
GTEX-TMMY-1726-SM-4DXTD
40-49 years, female
1444.7
GTEX-13PL7-2326-SM-5L3FY
60-69 years, female
1432.6
GTEX-YJ8O-1026-SM-5CVM5
40-49 years, female
1431.8
GTEX-ZVT2-0326-SM-5E44G
50-59 years, female
1420.5
GTEX-11I78-1926-SM-59878
50-59 years, female
1420.0
GTEX-UJHI-1226-SM-4IHLR
50-59 years, female
1416.5
GTEX-XV7Q-1426-SM-4BRWA
40-49 years, female
1414.0
GTEX-U3ZN-1026-SM-4DXTC
30-39 years, female
1413.7
GTEX-PWN1-2426-SM-48TDD
40-49 years, female
1411.4
GTEX-13QIC-1526-SM-5IJFL
60-69 years, female
1408.0
GTEX-12WSG-1426-SM-5FQUK
50-59 years, female
1399.8
GTEX-XUW1-0126-SM-4BOOQ
50-59 years, female
1397.5
GTEX-12WSJ-1226-SM-5LU91
40-49 years, female
1396.1
GTEX-11P81-1526-SM-5P9GS
30-39 years, female
1394.9
GTEX-S32W-1226-SM-4AD67
50-59 years, female
1392.2
GTEX-XYKS-1726-SM-4E3IO
60-69 years, female
1379.9
GTEX-13N11-0526-SM-5IJFI
50-59 years, female
1373.9
GTEX-13D11-1126-SM-5KLYS
50-59 years, female
1353.5
GTEX-ZYWO-1926-SM-5E456
40-49 years, female
1350.6
GTEX-11ZTS-1926-SM-5CVLA
60-69 years, female
1350.0
GTEX-11GSP-0226-SM-5A5KV
60-69 years, female
1347.3
GTEX-ZP4G-0626-SM-4WWF1
20-29 years, female
1342.1
GTEX-11XUK-1626-SM-5GU5O
40-49 years, female
1327.3
GTEX-S7SF-1326-SM-4AD4P
20-29 years, female
1326.7
GTEX-S341-0726-SM-4AD5R
40-49 years, female
1315.8
GTEX-13QBU-1526-SM-5LU3W
40-49 years, female
1313.5
GTEX-X4EO-2426-SM-4QASD
60-69 years, female
1299.0
GTEX-ZZPU-2126-SM-5EGIU
50-59 years, female
1292.2
GTEX-13O3O-2726-SM-5KM35
60-69 years, female
1284.3
GTEX-Y114-1726-SM-4TT7U
50-59 years, female
1279.0
GTEX-145ME-1226-SM-5SIB6
40-49 years, female
1270.8
GTEX-P4PP-2426-SM-3P61L
30-39 years, female
1260.8
GTEX-ZYY3-2726-SM-5EGH4
60-69 years, female
1249.4
GTEX-QCQG-1426-SM-48U22
50-59 years, female
1243.3
GTEX-12WSD-2726-SM-59HLR
60-69 years, female
1217.8
GTEX-PWCY-1326-SM-48TCU
20-29 years, female
1215.7
GTEX-11EM3-1726-SM-5N9D1
20-29 years, female
1205.2
GTEX-W5WG-0926-SM-4RTX9
50-59 years, female
1193.1
GTEX-P4QT-2426-SM-3NMCL
50-59 years, female
1190.3
GTEX-ZYFG-1726-SM-5GZZB
60-69 years, female
1183.6
GTEX-XUZC-1026-SM-4BOPY
30-39 years, female
1172.4
GTEX-11DXX-1426-SM-5GIDU
60-69 years, female
1160.4
GTEX-13PVR-1226-SM-5RQJ2
60-69 years, female
1152.7
GTEX-Q734-0726-SM-48TZP
40-49 years, female
1151.4
GTEX-ZLWG-0926-SM-4WWC3
50-59 years, female
1145.5
GTEX-13W3W-1526-SM-5LU5I
60-69 years, female
1131.2
GTEX-RWS6-1026-SM-47JXD
60-69 years, female
1079.2
GTEX-POMQ-1426-SM-3P61D
20-29 years, female
1075.3
GTEX-T6MO-1126-SM-4DM5D
40-49 years, female
1070.2
GTEX-1399S-2126-SM-5J2MH
30-39 years, female
1068.9
GTEX-132AR-1426-SM-5IFF1
50-59 years, female
1062.8
GTEX-13VXT-1526-SM-5LU3J
20-29 years, female
1051.5
GTEX-146FH-2526-SM-5Q5BP
50-59 years, female
1033.2
GTEX-RU1J-0826-SM-46MUU
20-29 years, female
1015.3
GTEX-TML8-0926-SM-4DXSJ
40-49 years, female
1014.6
GTEX-11ZTT-1826-SM-5CVLN
60-69 years, female
955.7
GTEX-133LE-1226-SM-5IFGC
20-29 years, female
941.7
GTEX-13FTX-0926-SM-5IFF7
20-29 years, female
846.2
Show all
OVARY - FANTOM5 CAGEi
Tissue data obtained through Cap Analysis of Gene Expression (CAGE) are reported as Tags Per Million, generated by the FANTOM5 project. More information can be found here.
 The Human Protein Atlas project is funded


 MENU
MENU