We use cookies to enhance the usability of our website. If you continue, we'll assume that you are happy to receive all cookies. More information. Don't show this again.
The protein expression bar, with the units not detected (n), low (l), medium (m) and high (h), is based on a best estimate of the true protein expression for proteins where the antibody staining pattern has been analyzed by knowledge-based annotation. For genes where more than one antibody has been used, a collective score is set. For details, see Assays & annotation.
h
m
l
n
RNA expressioni
RNA expression shows average values based on RNA-seq data generated by HPA, the Genotype-Tissue Expression (GTEx) consortium or the FANTOM5 consortium.
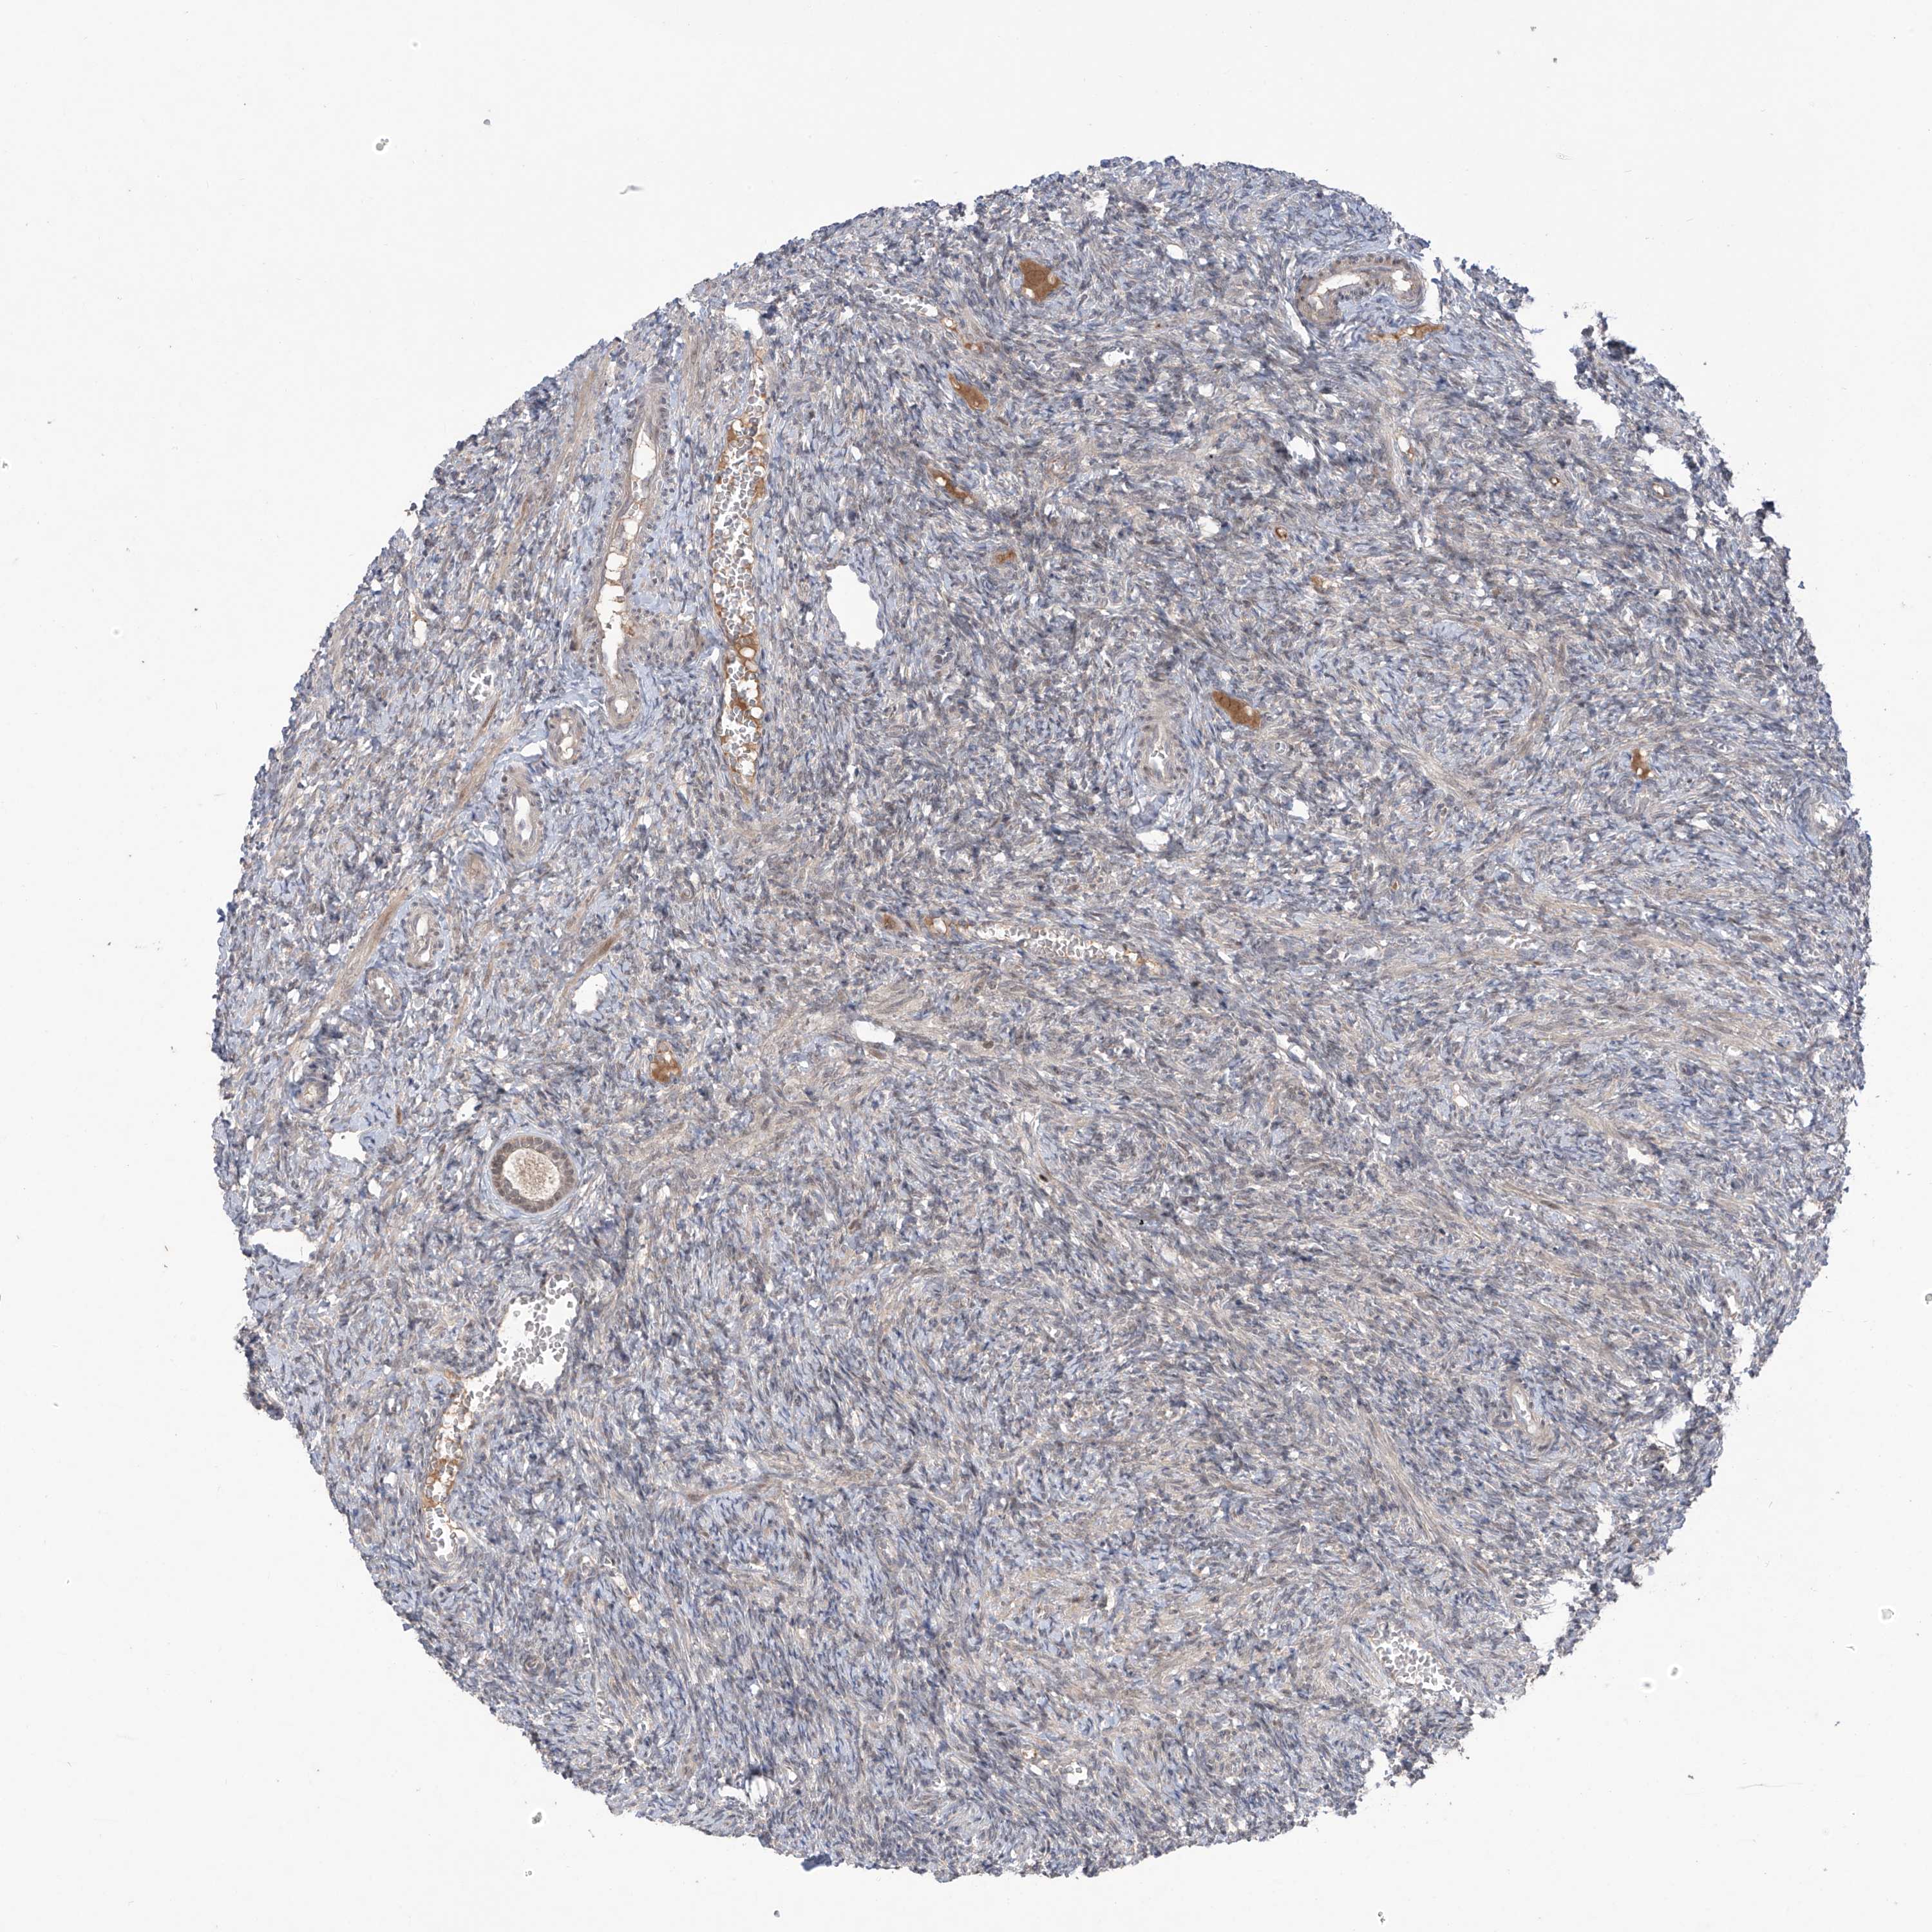
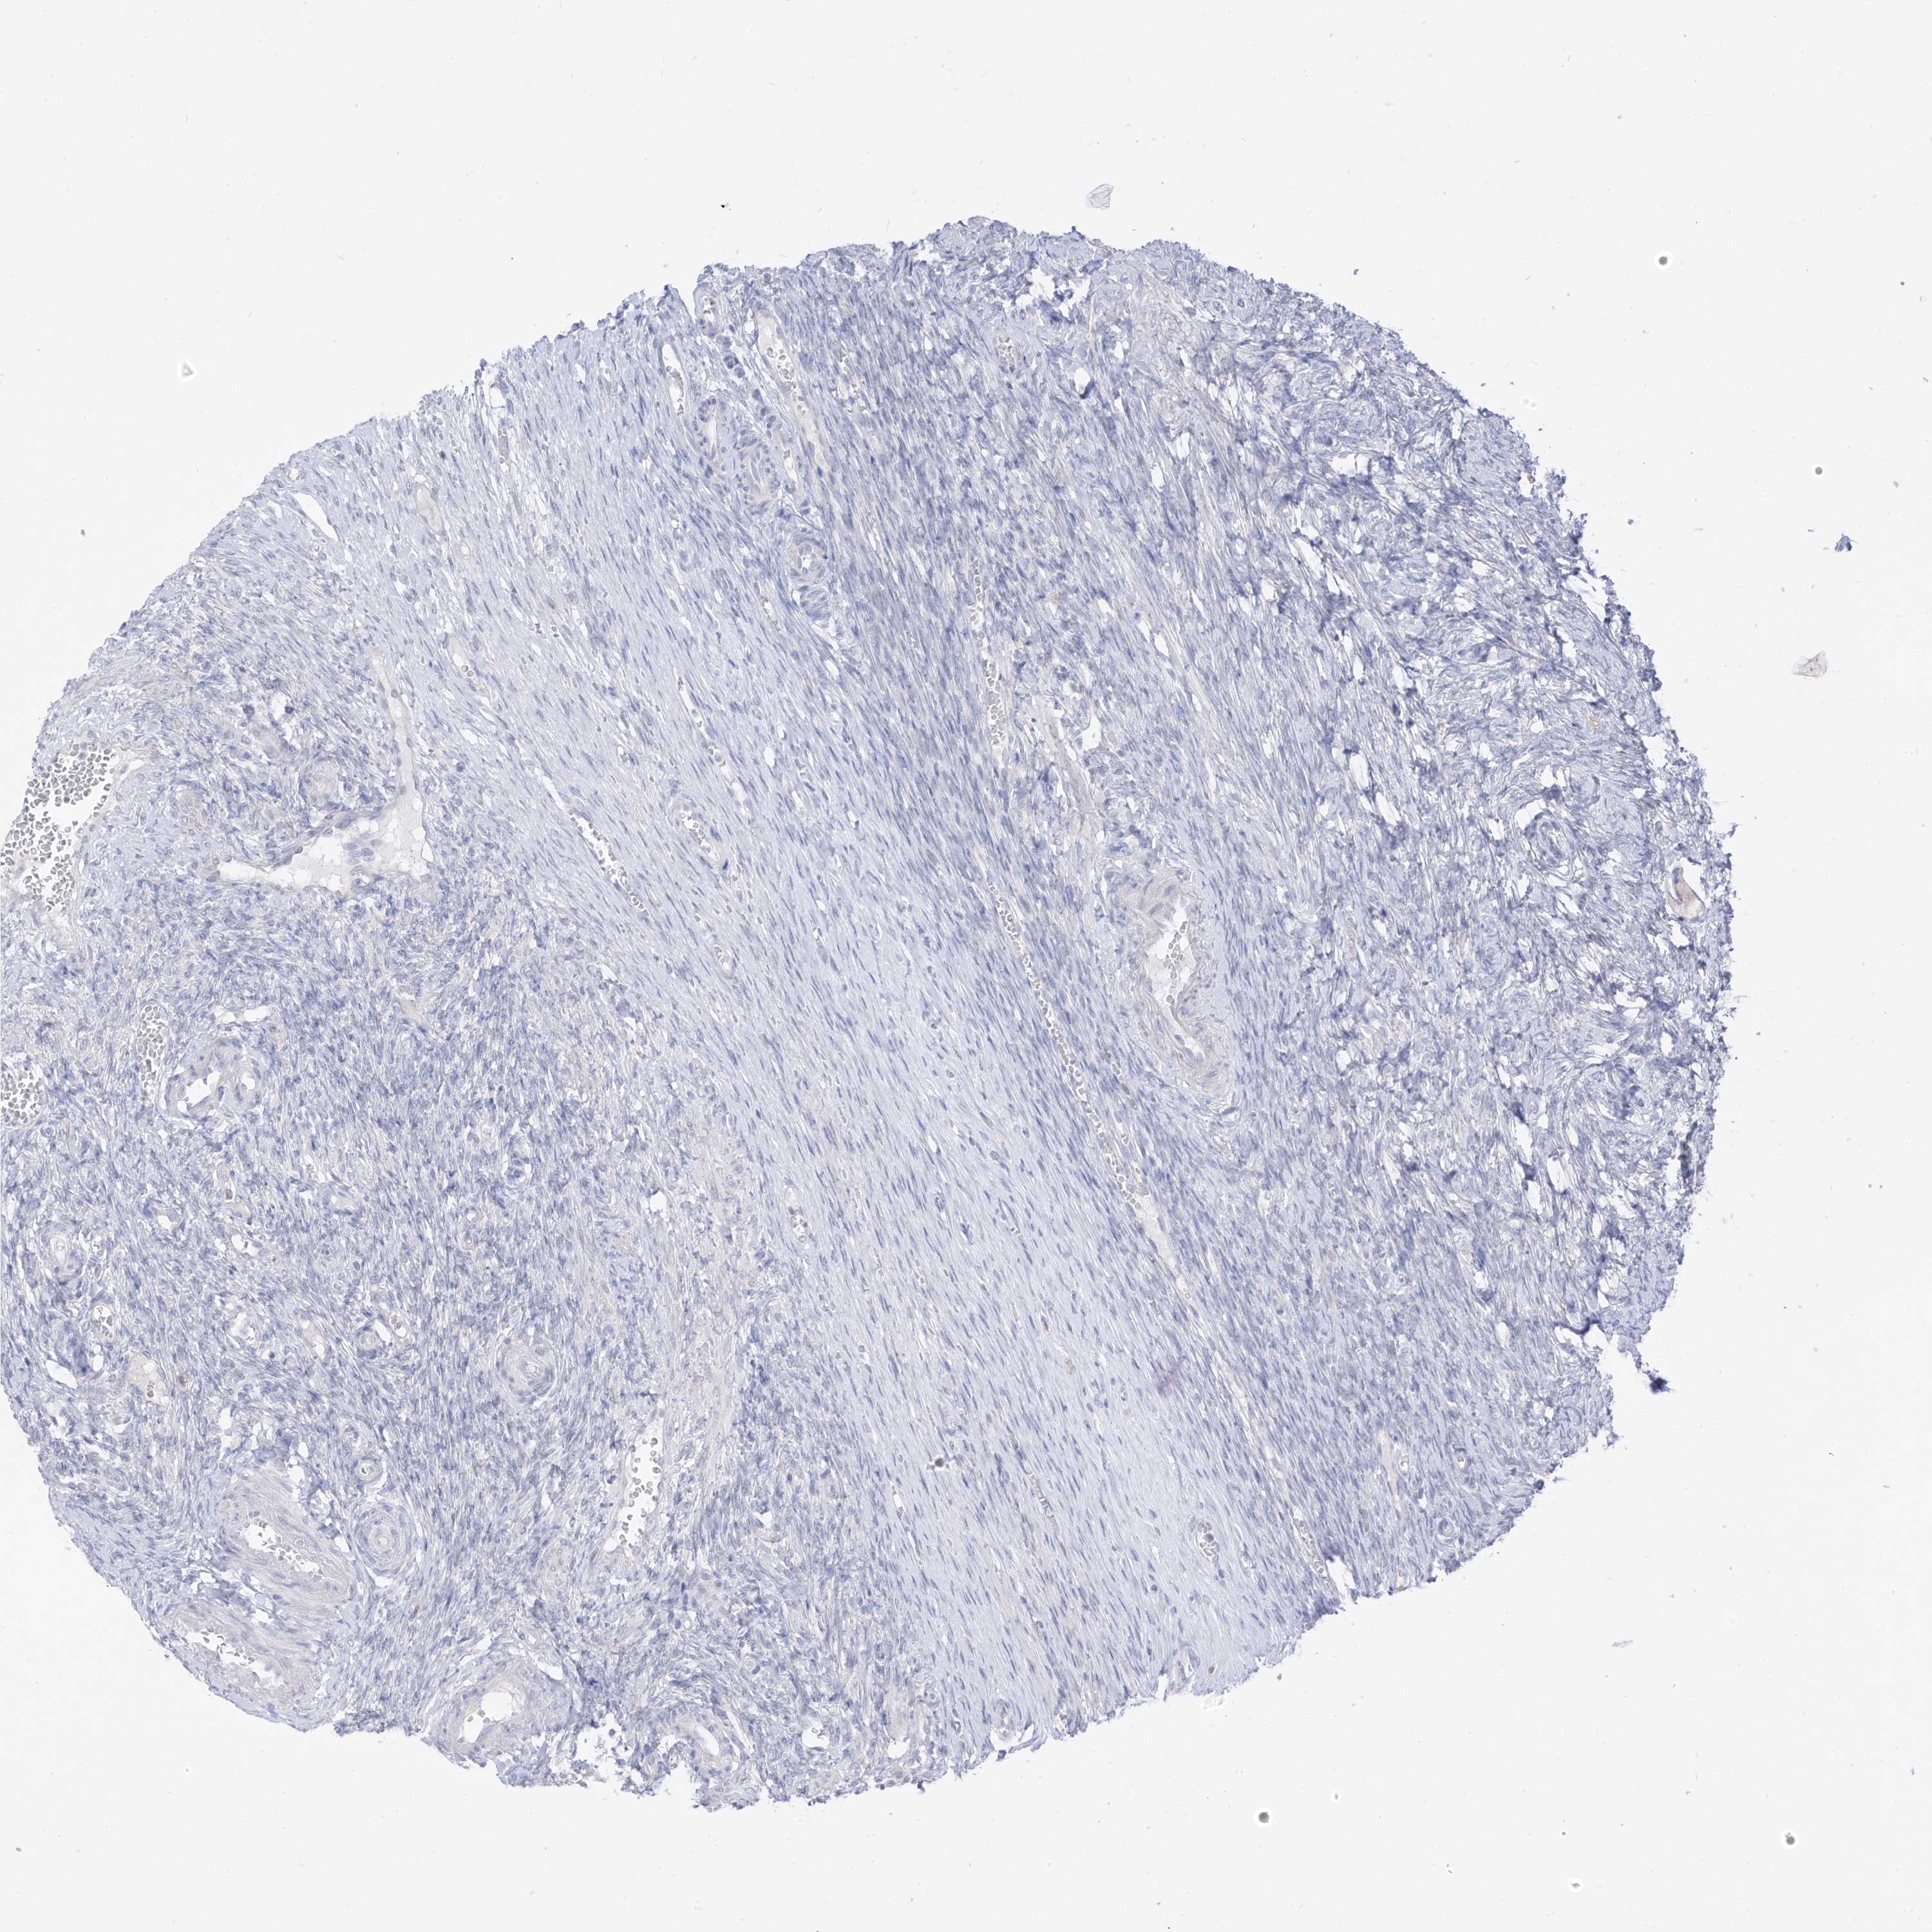
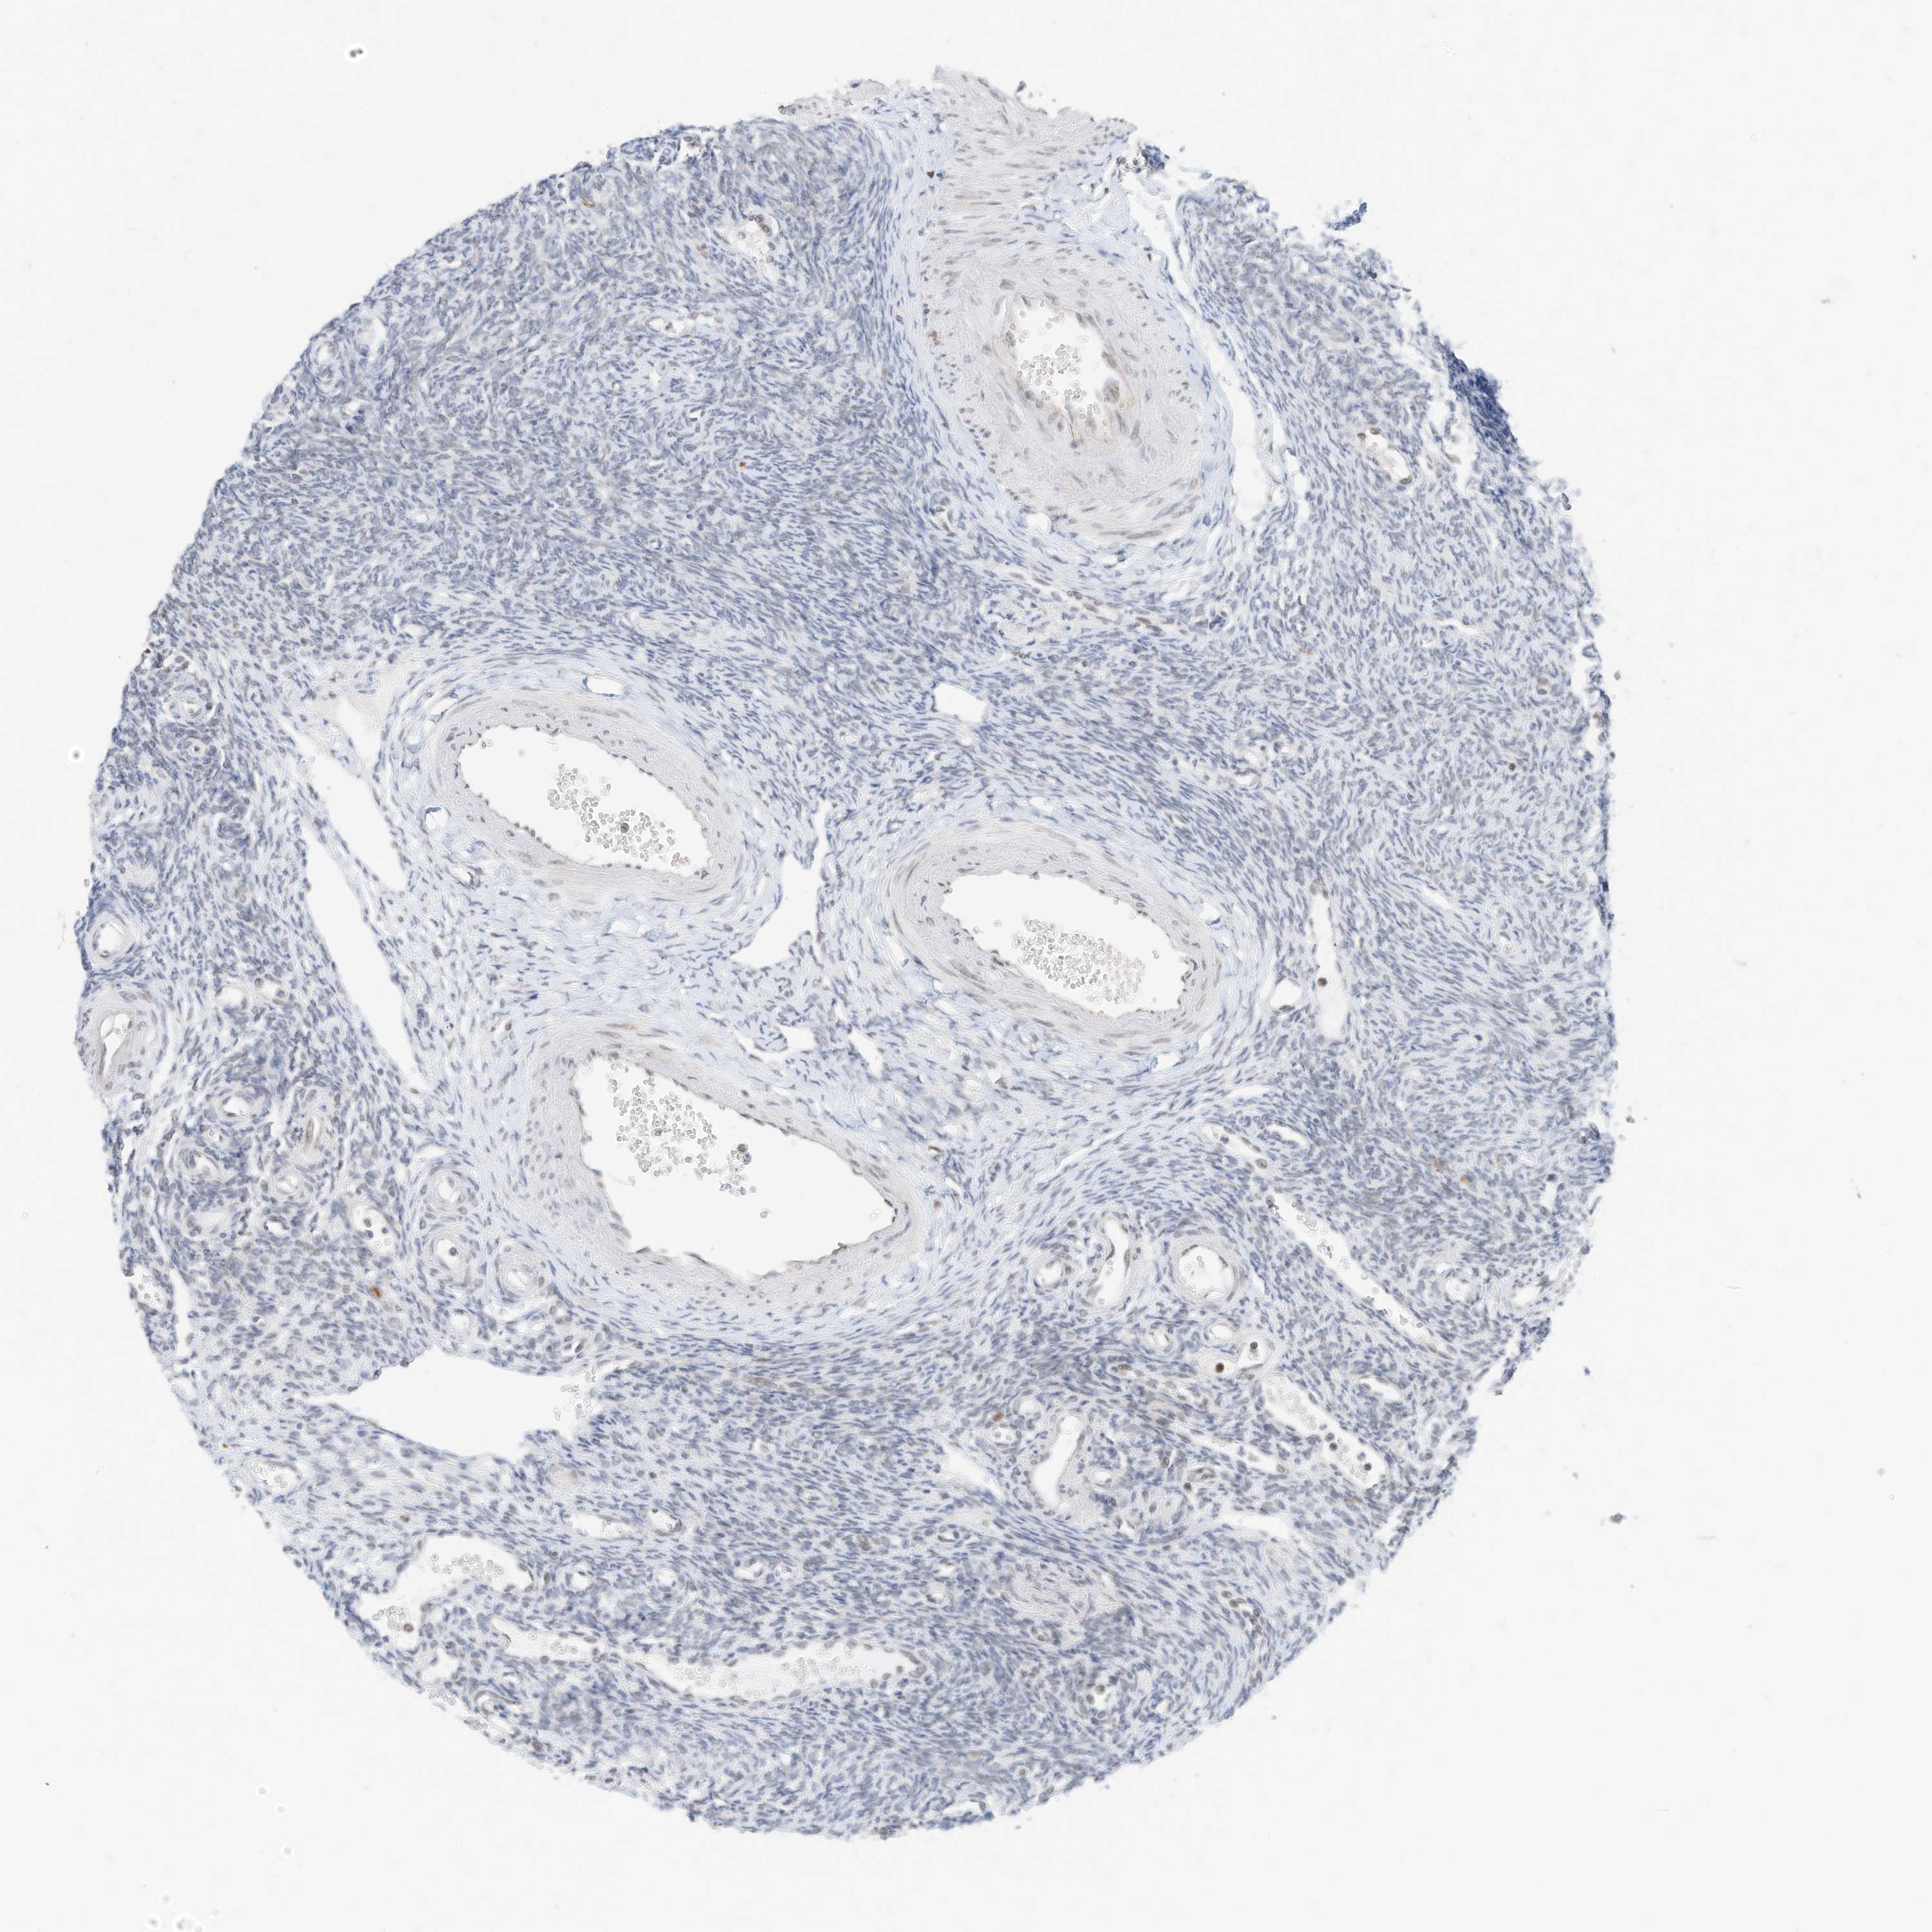
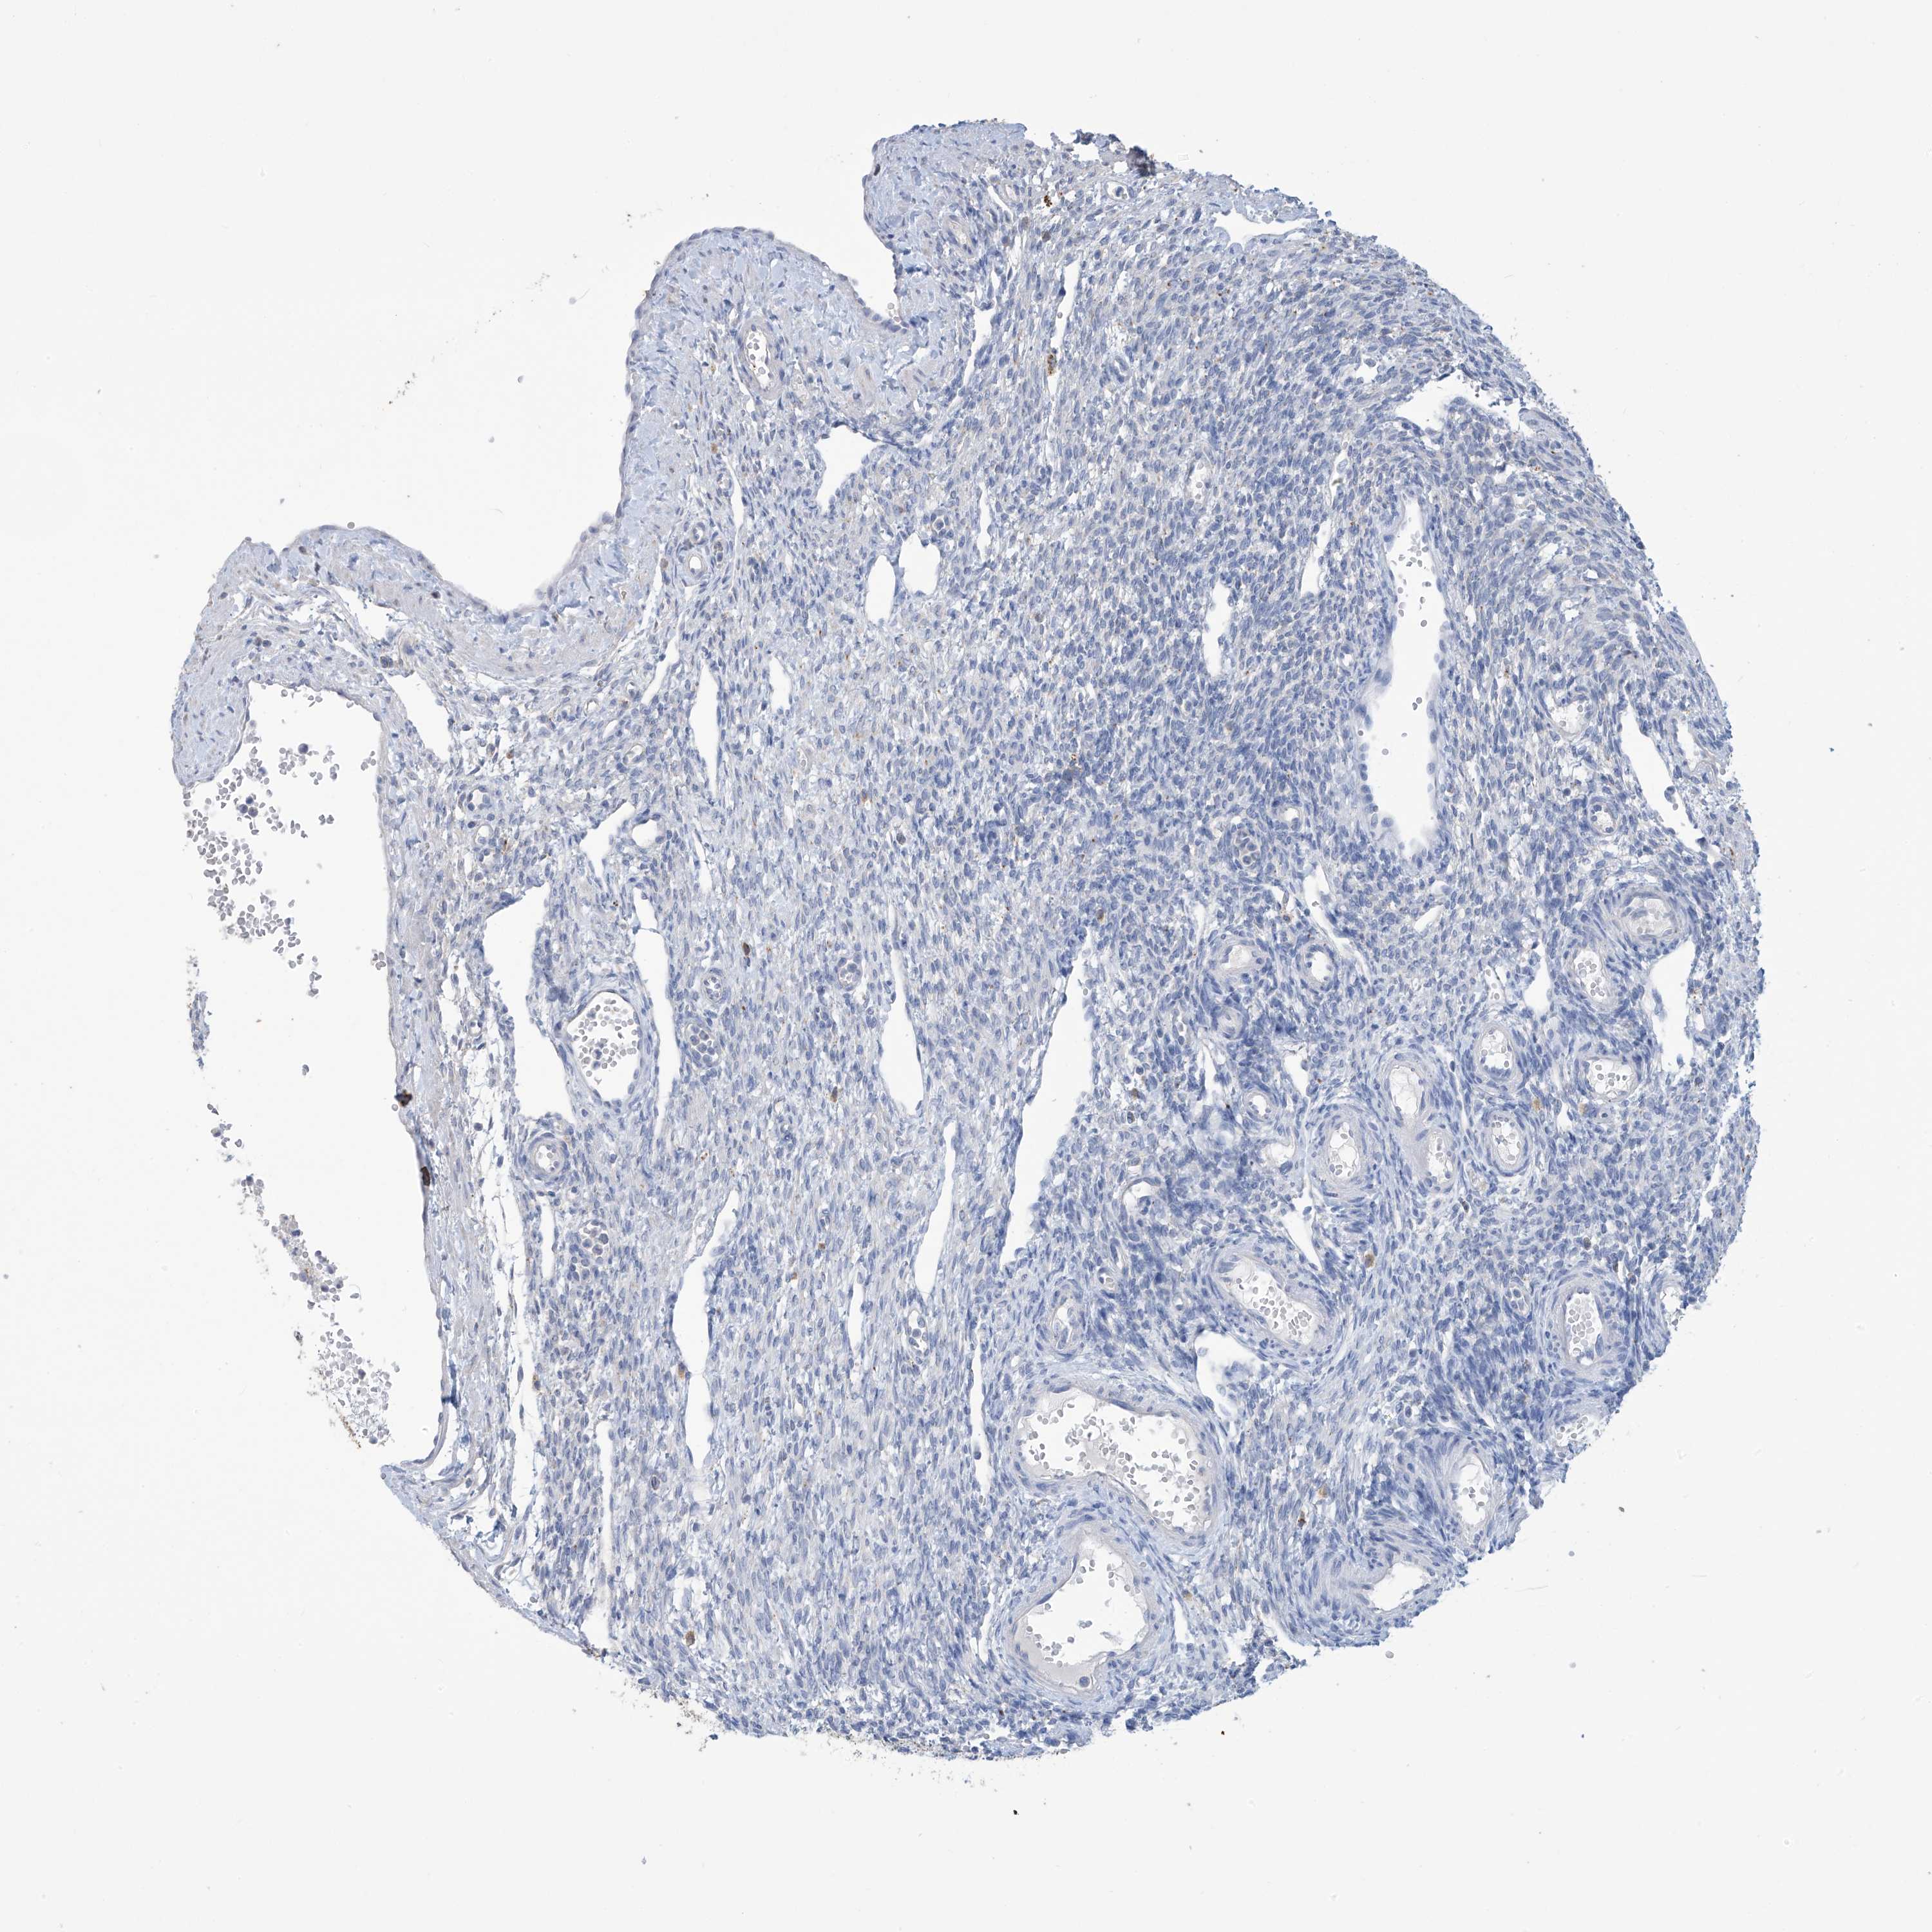
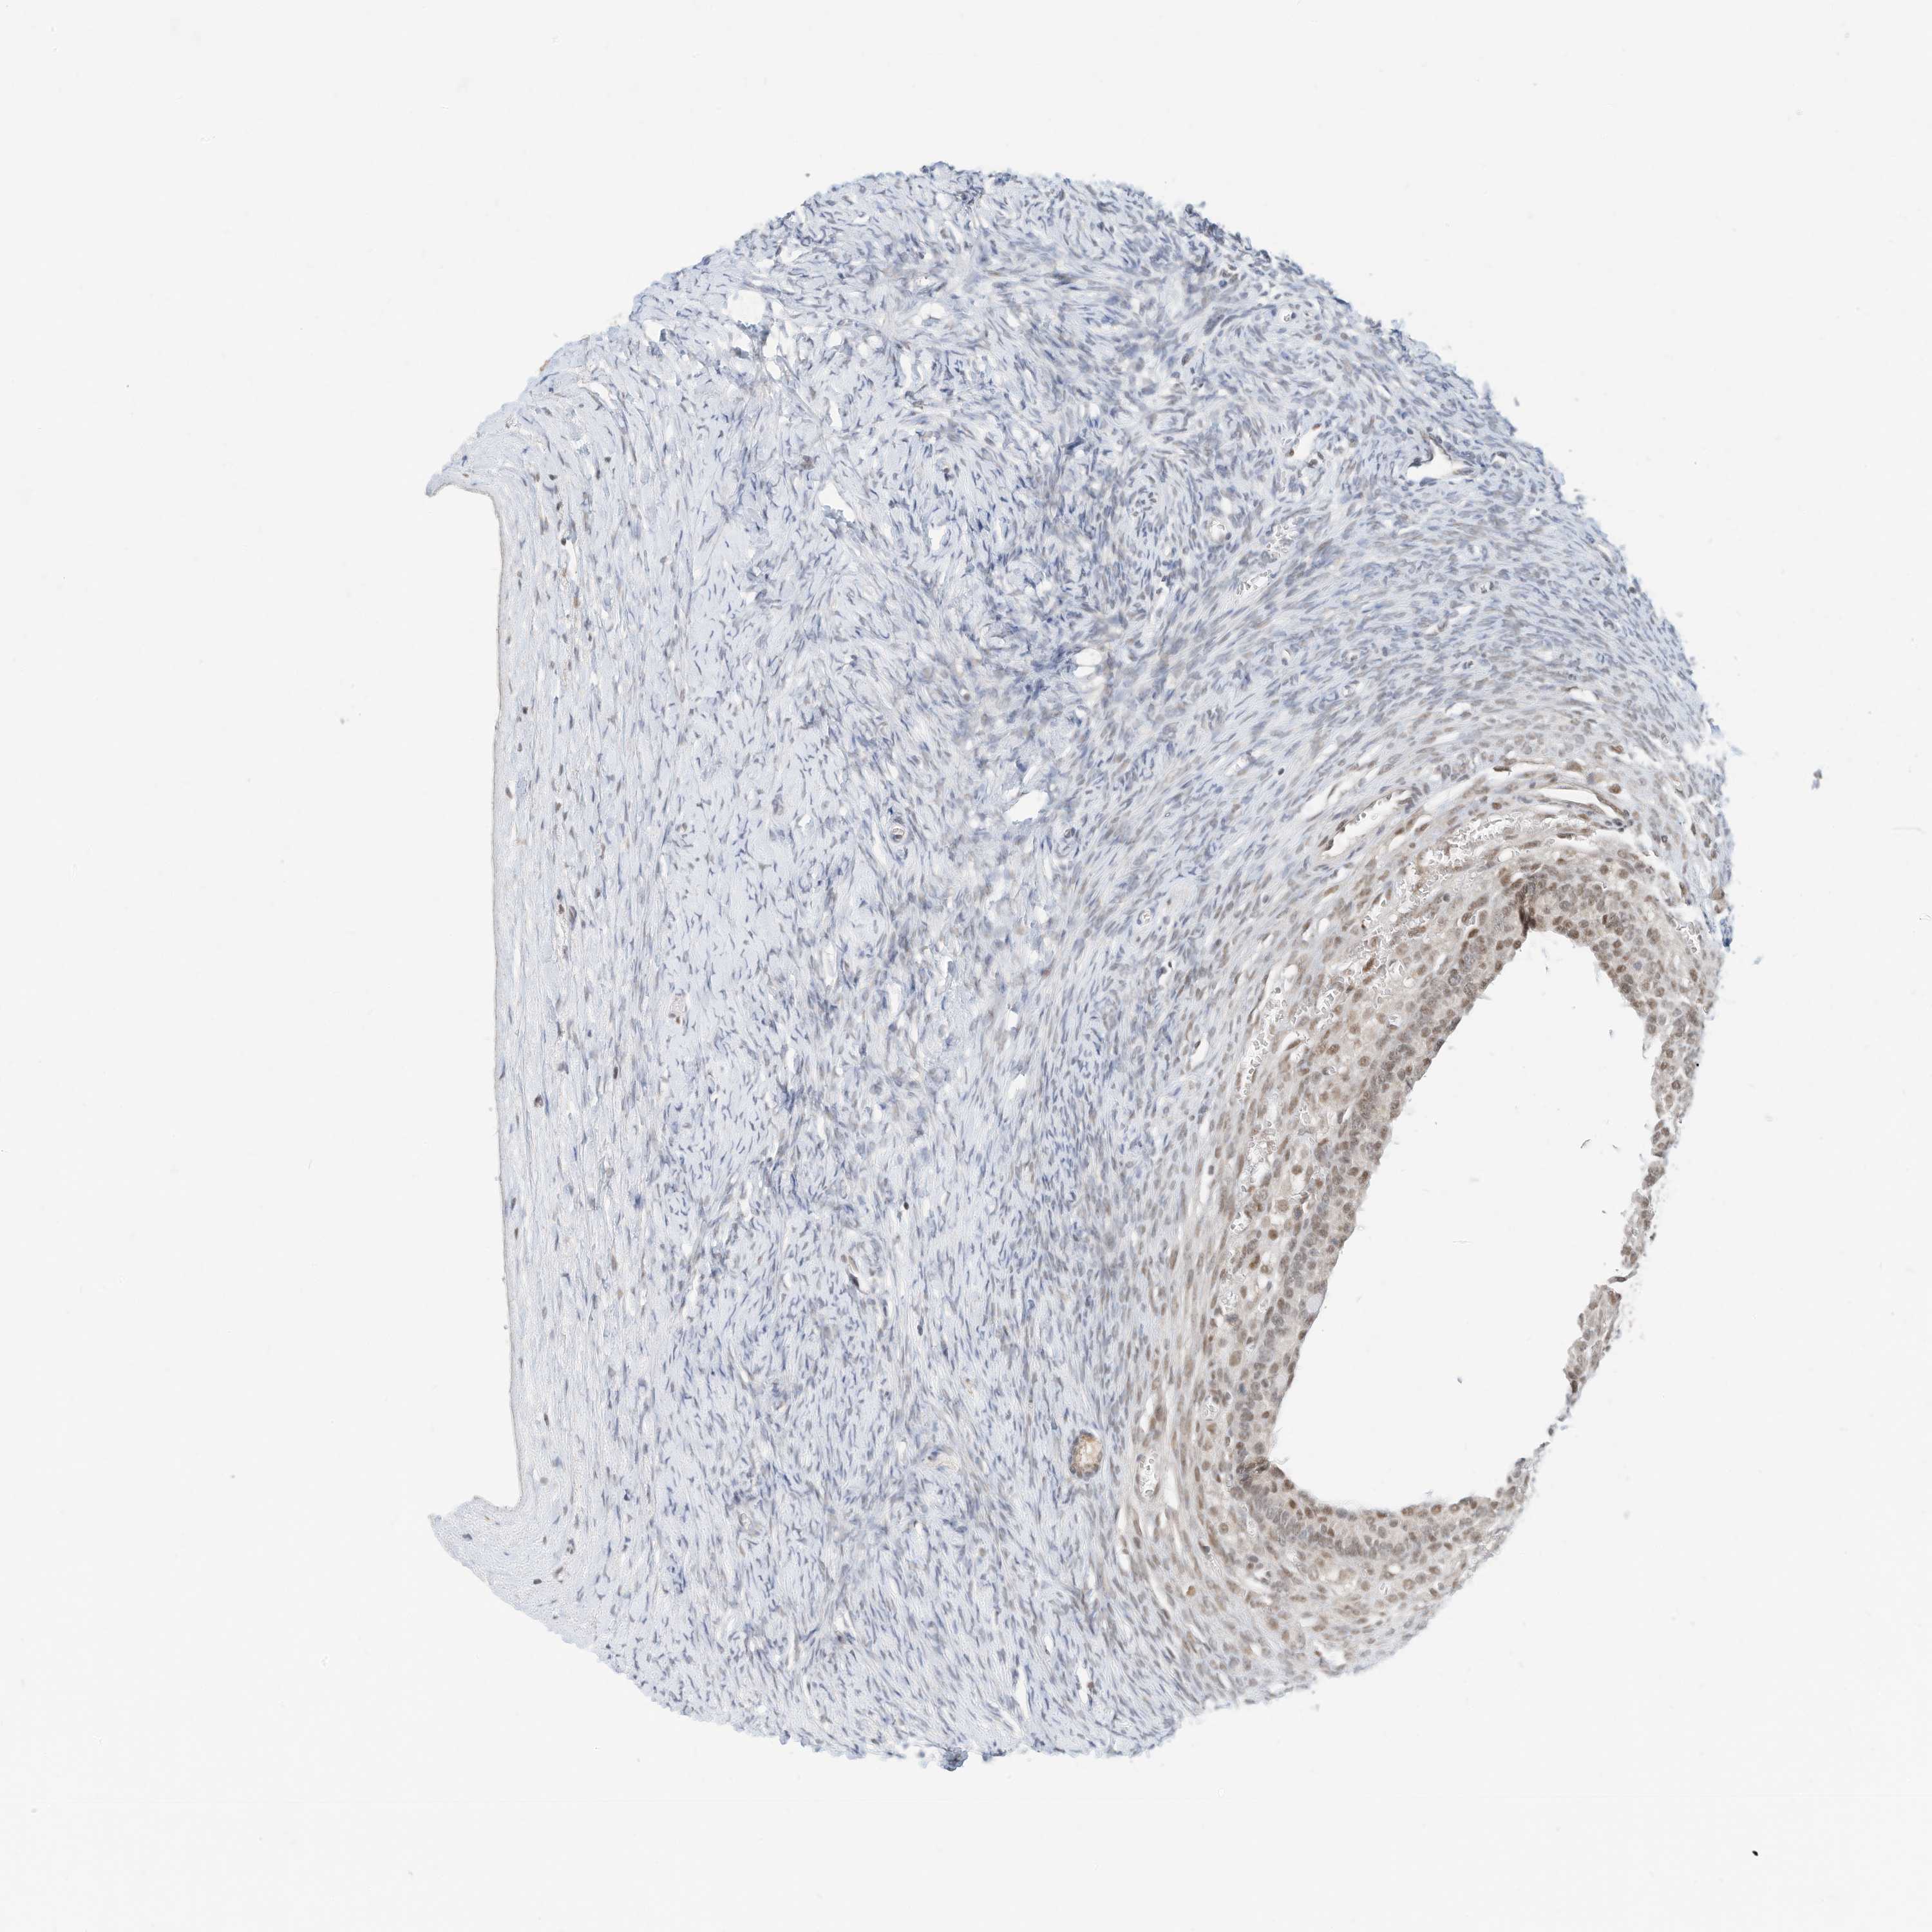
The detailed normal tissue page shows images of the stained tissue, together with antibody staining and expression level of the cell types. A knowledge-based annotated protein expression is provided for each cell type at the top of the page and the staining level of the individual antibodies is given underneath each antibody ID.
Samples from up to three different individuals have been stained for each antibody. The gender, age and tissue characterization are reported for each individual (patient) and are viewable when clicking on the image for magnification.
The images can be clicked for an enlarged view that can be panned. From the enlarged view, all stained images for all antibodies can be browsed (represented by miniature images). The miniature image with an orange overlay is the currently displayed image.
This score describes the level of antibody staining observed in the annotated cell types as not detected, low, medium, or high. It is based on the staining intensity and fraction of stained cells.
The RNA-seq details section shows detailed information about the individual samples used for the transcript profiling and results of the RNA-seq analysis.
Information about each individual sample is listed below, including gender, age, a tissue section image and estimated fractions of cell types. TPM (transcripts per million) values give a quantification of the gene abundance which is comparable between different genes and samples.
RNA-Seq data is reported as average RPKM (reads per kilobase per million mapped reads), generated by the Genotype-Tissue Expression (GTEx) project. More information can be found on the GTEx portal.
Normal distribution across the dataset is visualized with box plots, shown as median and 25th and 75th percentiles. Points are displayed as outliers if they are above or below 1.5 times the interquartile range. RPKM values of the individual samples are presented next to the box plot.
Max RPKM: 158.8
Min RPKM: 46.1
Std RPKM: 24.5
Median RPKM: 89.6
GTEX-ZYY3-2726-SM-5EGH4
60-69 years, female
158.8
GTEX-PLZ4-2826-SM-3P617
50-59 years, female
140.4
GTEX-12WSD-2726-SM-59HLR
60-69 years, female
136.0
GTEX-12WSB-2226-SM-5GCOS
60-69 years, female
135.0
GTEX-13QIC-1526-SM-5IJFL
60-69 years, female
132.9
GTEX-13U4I-2126-SM-5LU55
40-49 years, female
131.8
GTEX-YFC4-2726-SM-5IFJW
40-49 years, female
131.2
GTEX-13O3O-2726-SM-5KM35
60-69 years, female
129.2
GTEX-12ZZX-2026-SM-5LZV9
40-49 years, female
127.9
GTEX-X4EO-2426-SM-4QASD
60-69 years, female
127.8
GTEX-ZVT3-2626-SM-5GU5L
60-69 years, female
127.3
GTEX-12WSK-1926-SM-5LZVK
40-49 years, female
127.2
GTEX-YJ8O-1026-SM-5CVM5
40-49 years, female
124.7
GTEX-132AR-1426-SM-5IFF1
50-59 years, female
121.2
GTEX-ZC5H-2026-SM-5CVN2
40-49 years, female
118.0
GTEX-S32W-1226-SM-4AD67
50-59 years, female
117.5
GTEX-13OVJ-2426-SM-5KM3I
50-59 years, female
117.1
GTEX-RTLS-2326-SM-46MUH
60-69 years, female
116.7
GTEX-13QBU-1526-SM-5LU3W
40-49 years, female
114.0
GTEX-131YS-2226-SM-5P9G8
60-69 years, female
113.9
GTEX-Q734-0726-SM-48TZP
40-49 years, female
113.9
GTEX-146FH-2526-SM-5Q5BP
50-59 years, female
113.7
GTEX-WI4N-2526-SM-4OOSE
40-49 years, female
113.7
GTEX-XMD3-2326-SM-4AT5H
50-59 years, female
113.7
GTEX-T2IS-2026-SM-4DM6W
20-29 years, female
112.7
GTEX-WWYW-2726-SM-4MVOP
50-59 years, female
112.4
GTEX-14AS3-1326-SM-5RQJE
40-49 years, female
111.3
GTEX-11EM3-1726-SM-5N9D1
20-29 years, female
110.4
GTEX-X8HC-2726-SM-46MUA
50-59 years, female
110.3
GTEX-1313W-2726-SM-5P9IX
50-59 years, female
109.2
GTEX-139D8-2426-SM-5KM3A
30-39 years, female
108.8
GTEX-T5JW-0426-SM-4DM7M
20-29 years, female
105.8
GTEX-11ZVC-1426-SM-5EGGA
50-59 years, female
105.3
GTEX-UJHI-1226-SM-4IHLR
50-59 years, female
105.0
GTEX-T6MO-1126-SM-4DM5D
40-49 years, female
104.9
GTEX-13PL7-2326-SM-5L3FY
60-69 years, female
103.9
GTEX-1269C-1826-SM-5N9E1
60-69 years, female
103.1
GTEX-QVJO-3126-SM-4R1KC
60-69 years, female
102.8
GTEX-TML8-0926-SM-4DXSJ
40-49 years, female
102.3
GTEX-ZAJG-2726-SM-5S2MU
50-59 years, female
101.4
GTEX-13VXT-1526-SM-5LU3J
20-29 years, female
99.3
GTEX-U3ZN-1026-SM-4DXTC
30-39 years, female
96.5
GTEX-13N11-0526-SM-5IJFI
50-59 years, female
95.3
GTEX-11EMC-1726-SM-5H11P
60-69 years, female
94.4
GTEX-133LE-1226-SM-5IFGC
20-29 years, female
93.4
GTEX-S7SF-1326-SM-4AD4P
20-29 years, female
92.9
GTEX-11ZTT-1826-SM-5CVLN
60-69 years, female
92.6
GTEX-13PVR-1226-SM-5RQJ2
60-69 years, female
91.8
GTEX-Y3IK-2026-SM-4YCDG
50-59 years, female
89.6
GTEX-ZYFG-1726-SM-5GZZB
60-69 years, female
89.2
GTEX-145ME-1226-SM-5SIB6
40-49 years, female
88.7
GTEX-XUW1-0126-SM-4BOOQ
50-59 years, female
88.5
GTEX-P78B-1926-SM-3P616
40-49 years, female
87.7
GTEX-POMQ-1426-SM-3P61D
20-29 years, female
85.9
GTEX-ZPIC-1426-SM-4WWCP
40-49 years, female
85.7
GTEX-W5WG-0926-SM-4RTX9
50-59 years, female
85.4
GTEX-RU72-2226-SM-46MUE
50-59 years, female
84.9
GTEX-13D11-1126-SM-5KLYS
50-59 years, female
84.0
GTEX-XUJ4-1326-SM-4BOQ9
60-69 years, female
83.0
GTEX-PX3G-2426-SM-48TZZ
20-29 years, female
82.8
GTEX-12WSJ-1226-SM-5LU91
40-49 years, female
80.9
GTEX-13FTX-0926-SM-5IFF7
20-29 years, female
80.9
GTEX-PWN1-2426-SM-48TDD
40-49 years, female
80.7
GTEX-S4P3-0926-SM-4AD54
50-59 years, female
79.8
GTEX-PWCY-1326-SM-48TCU
20-29 years, female
79.3
GTEX-S341-0726-SM-4AD5R
40-49 years, female
79.2
GTEX-TSE9-2226-SM-4DXUR
60-69 years, female
78.9
GTEX-12WSG-1426-SM-5FQUK
50-59 years, female
77.5
GTEX-11ZTS-1926-SM-5CVLA
60-69 years, female
75.9
GTEX-ZZPU-2126-SM-5EGIU
50-59 years, female
75.8
GTEX-ZYWO-1926-SM-5E456
40-49 years, female
74.6
GTEX-XV7Q-1426-SM-4BRWA
40-49 years, female
73.0
GTEX-11P81-1526-SM-5P9GS
30-39 years, female
72.7
GTEX-RU1J-0826-SM-46MUU
20-29 years, female
72.7
GTEX-OHPK-2426-SM-3MJGH
50-59 years, female
72.5
GTEX-13X6H-1026-SM-5SIBE
50-59 years, female
72.0
GTEX-P4QT-2426-SM-3NMCL
50-59 years, female
71.7
GTEX-XUZC-1026-SM-4BOPY
30-39 years, female
70.7
GTEX-11XUK-1626-SM-5GU5O
40-49 years, female
70.3
GTEX-P4PP-2426-SM-3P61L
30-39 years, female
69.7
GTEX-11GSP-0226-SM-5A5KV
60-69 years, female
69.4
GTEX-X15G-1726-SM-4PQZN
50-59 years, female
69.2
GTEX-RWS6-1026-SM-47JXD
60-69 years, female
68.6
GTEX-ZP4G-0626-SM-4WWF1
20-29 years, female
67.7
GTEX-11VI4-1026-SM-5EQM1
40-49 years, female
67.6
GTEX-ZVT2-0326-SM-5E44G
50-59 years, female
67.6
GTEX-13W3W-1526-SM-5LU5I
60-69 years, female
66.2
GTEX-ZLWG-0926-SM-4WWC3
50-59 years, female
62.8
GTEX-TMMY-1726-SM-4DXTD
40-49 years, female
58.6
GTEX-XYKS-1726-SM-4E3IO
60-69 years, female
56.6
GTEX-13OVI-0726-SM-5L3DD
60-69 years, female
54.3
GTEX-Y114-1726-SM-4TT7U
50-59 years, female
52.8
GTEX-1399S-2126-SM-5J2MH
30-39 years, female
52.1
GTEX-QCQG-1426-SM-48U22
50-59 years, female
51.8
GTEX-11DXX-1426-SM-5GIDU
60-69 years, female
50.8
GTEX-11I78-1926-SM-59878
50-59 years, female
46.8
GTEX-OHPL-2426-SM-48TDN
60-69 years, female
46.1
Show all
OVARY - FANTOM5 CAGEi
Tissue data obtained through Cap Analysis of Gene Expression (CAGE) are reported as Tags Per Million, generated by the FANTOM5 project. More information can be found here.
 The Human Protein Atlas project is funded


 MENU
MENU