We use cookies to enhance the usability of our website. If you continue, we'll assume that you are happy to receive all cookies. More information. Don't show this again.
Show complete data for human cells assay. The location(s) are highlighted in the illustration on the right.
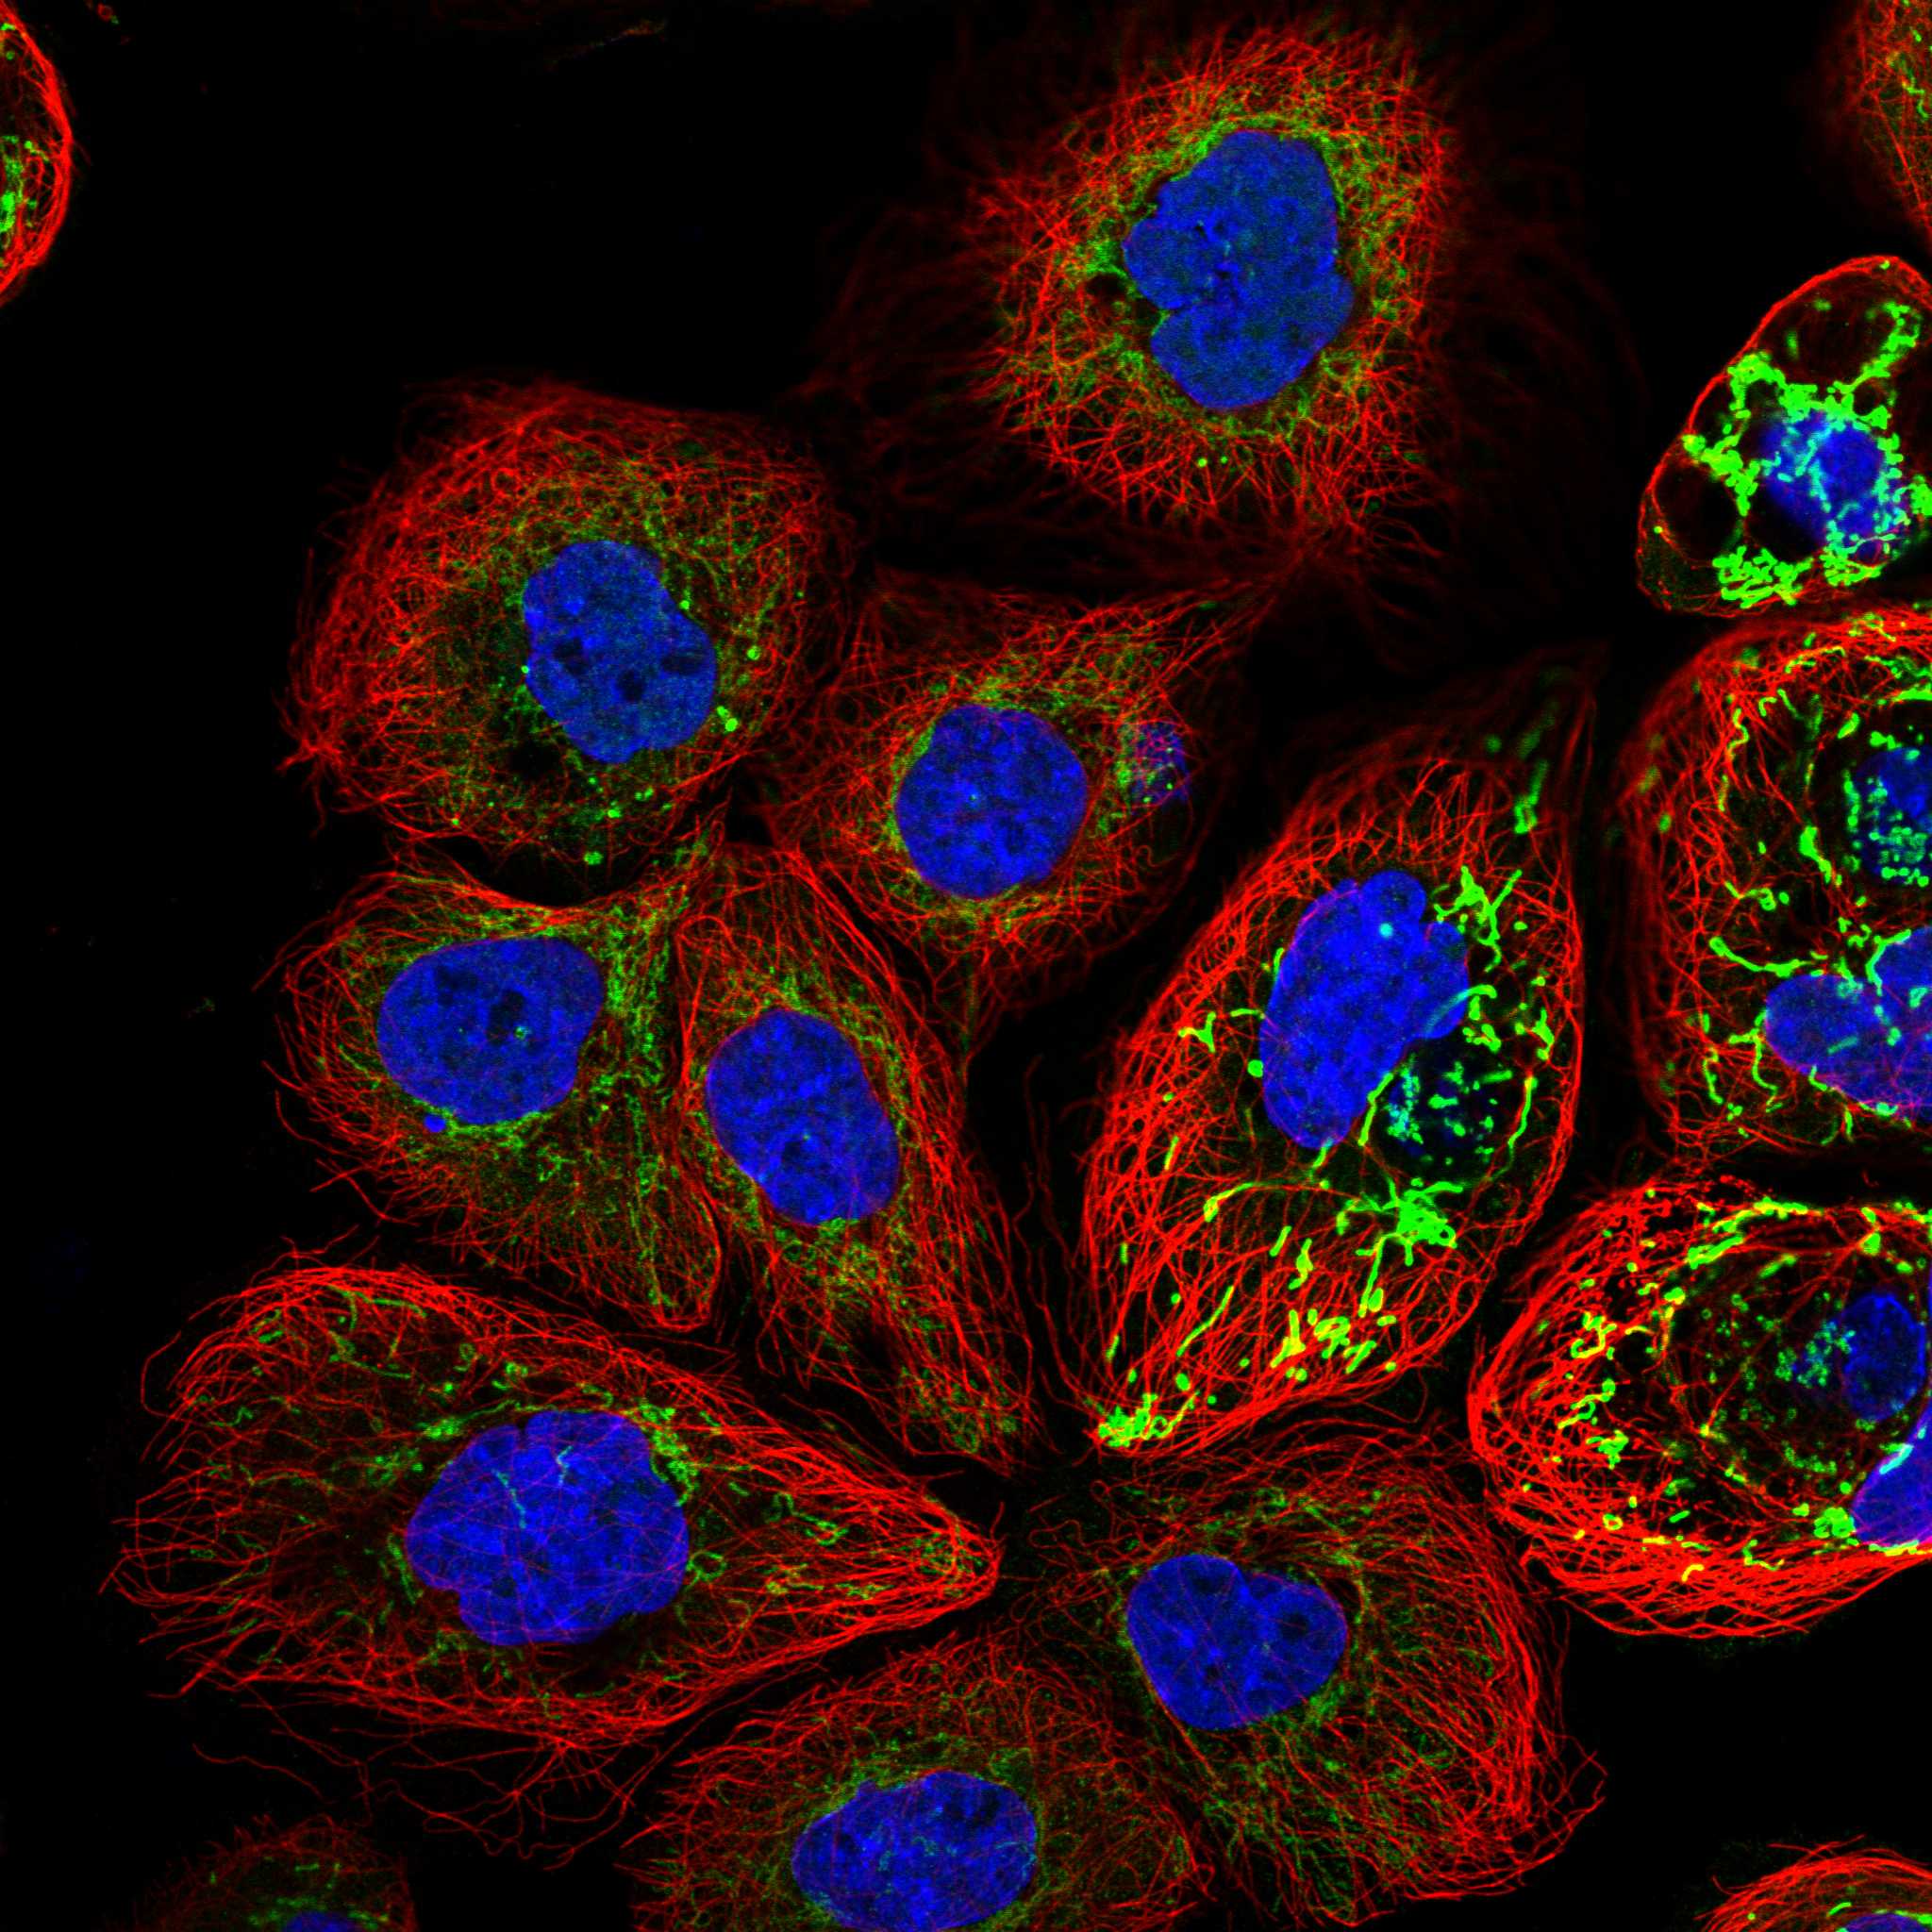
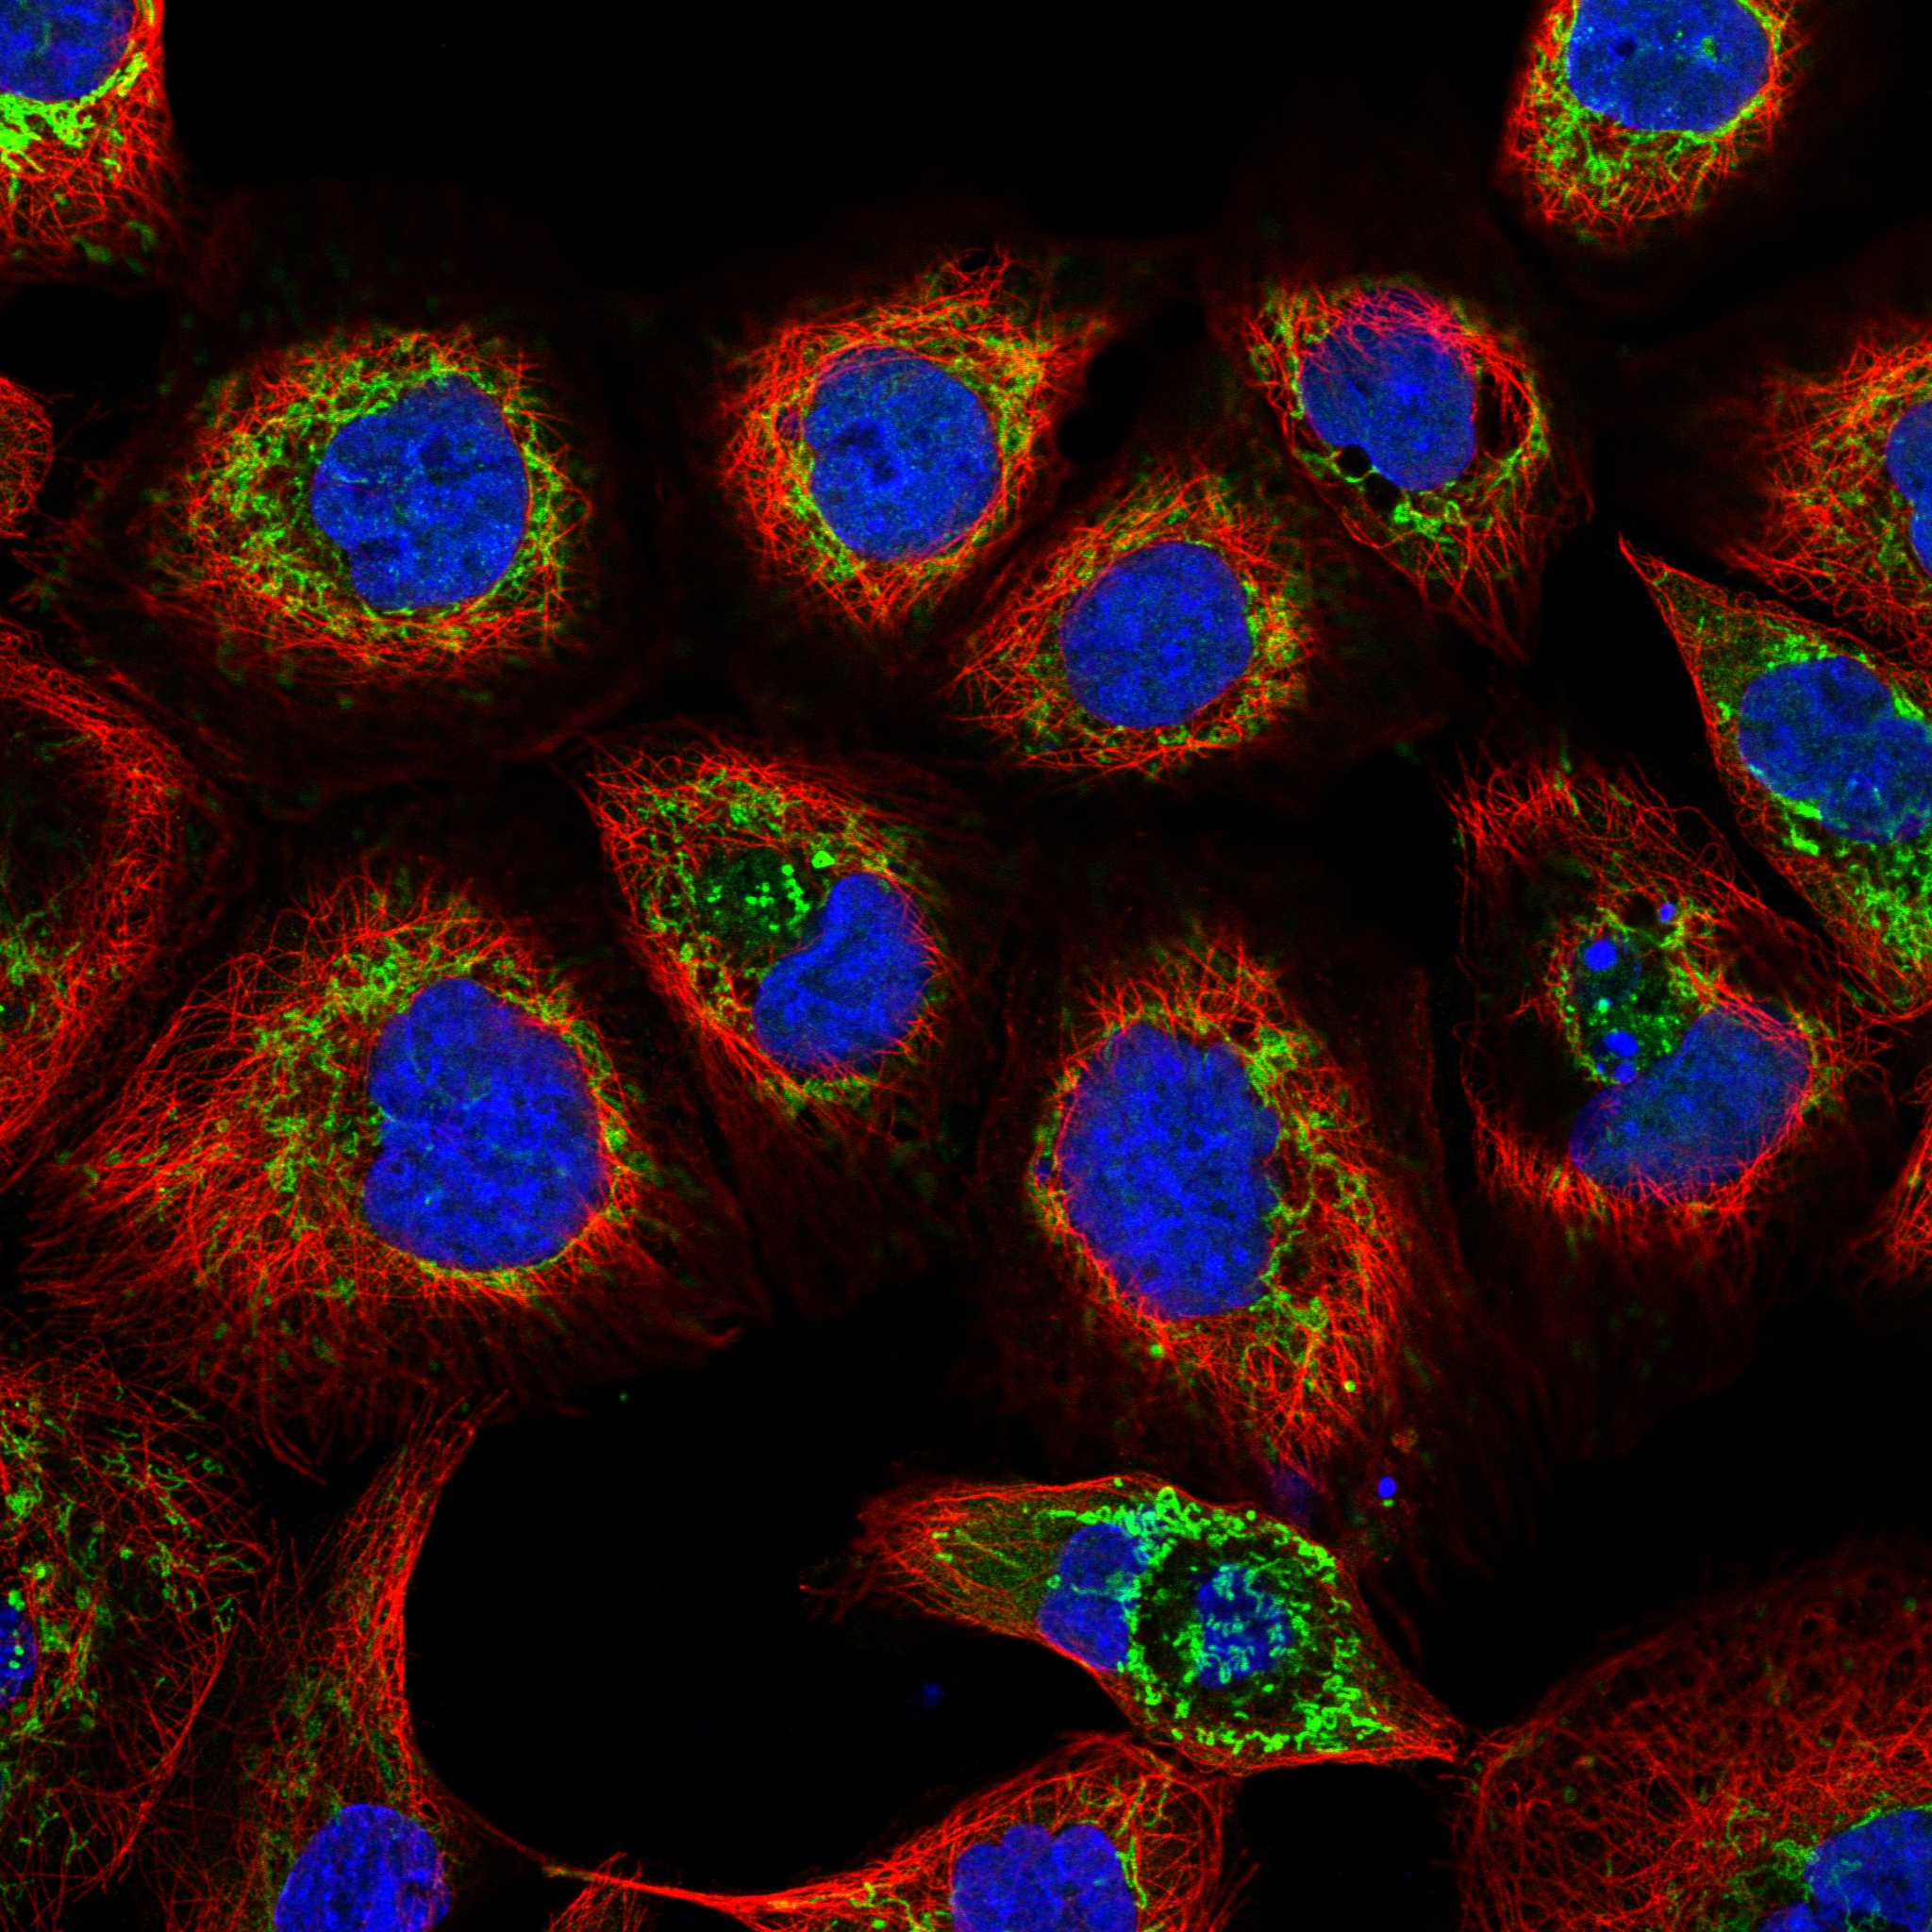
Localized to the mitochondria.
RNA cell categoryi
The cell lines in the Human Protein Atlas have been analyzed by RNA-seq to estimate the transcript abundance of each protein-coding gene. The RNA-seq data was then used to classify all genes according to their cell line-specific expression into one of six different categories, defined based on the total set of all TPM values in all analyzed cell lines.
Protein evidence scores are generated from several independent sources and are classified as evidence at i) protein level, ii) transcript level, iii) no evidence, or iv) not available.
Evidence at protein level
Main locationi
The main location is characterized by presence in all tested cell lines and/or increased intensity compared to other locations. It is highlighted in the illustration to the right. If available, links to overrepresentation analyses in Reactome, a free, open-source, curated and peer reviewed biological pathway database, are provided. An analysis is done for the corresponding gene set of the proteome localizing to the main and additional locations of the protein on this page, respectively.
A reliability score is set for all genes and indicates the level of reliability of the analyzed protein expression pattern based on available protein/RNA/gene characterization data. The reliability of the annotated protein expression data is also scored depending on similarity in immunostaining patterns and consistency with available experimental gene/protein characterization data in the UniProtKB/Swiss-Prot database.
Below is an overview of RNA expression data generated in the HPA project. The analyzed cell lines are divided into 12 color-coded groups according to the organ they were obtained from. By clicking the toolbars in the top right corner it is possible to sort the cell lines in the chart by different criteria: the organ and the origin that the cell line was obtained from, the category of the cell line according to cellosaurus, alphabetically or by descending RNA expression. Detailed information about a specific cell line can be accessed by hovering over the corresponding bar in the chart. The RNA-sequencing results generated in the HPA are reported as number of Transcripts per Kilobase Million (TPM). In the Human Protein Atlas a TPM value of 1.0 is defined as a treshhold for expression of the corresponding protein.
The cell lines in the Human Protein Atlas have been analyzed by RNA-seq to estimate the transcript abundance of each protein-coding gene. The RNA-seq data was then used to classify all genes according to their cell line-specific expression into one of six different categories, defined based on the total set of all TPM values in all analyzed cell lines.
Cell lines sorted after organ of phenotypic resemblance.
Cell lines sorted after biological source for establishment.
Cell lines sorted after the cell line category according to Cellosaurus.
Cell lines sorted on descending RNA expression.
Cell lines sorted alphabetically.
HUMAN CELLSi
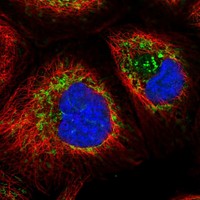
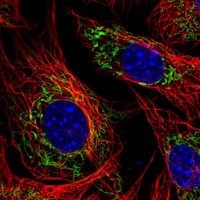
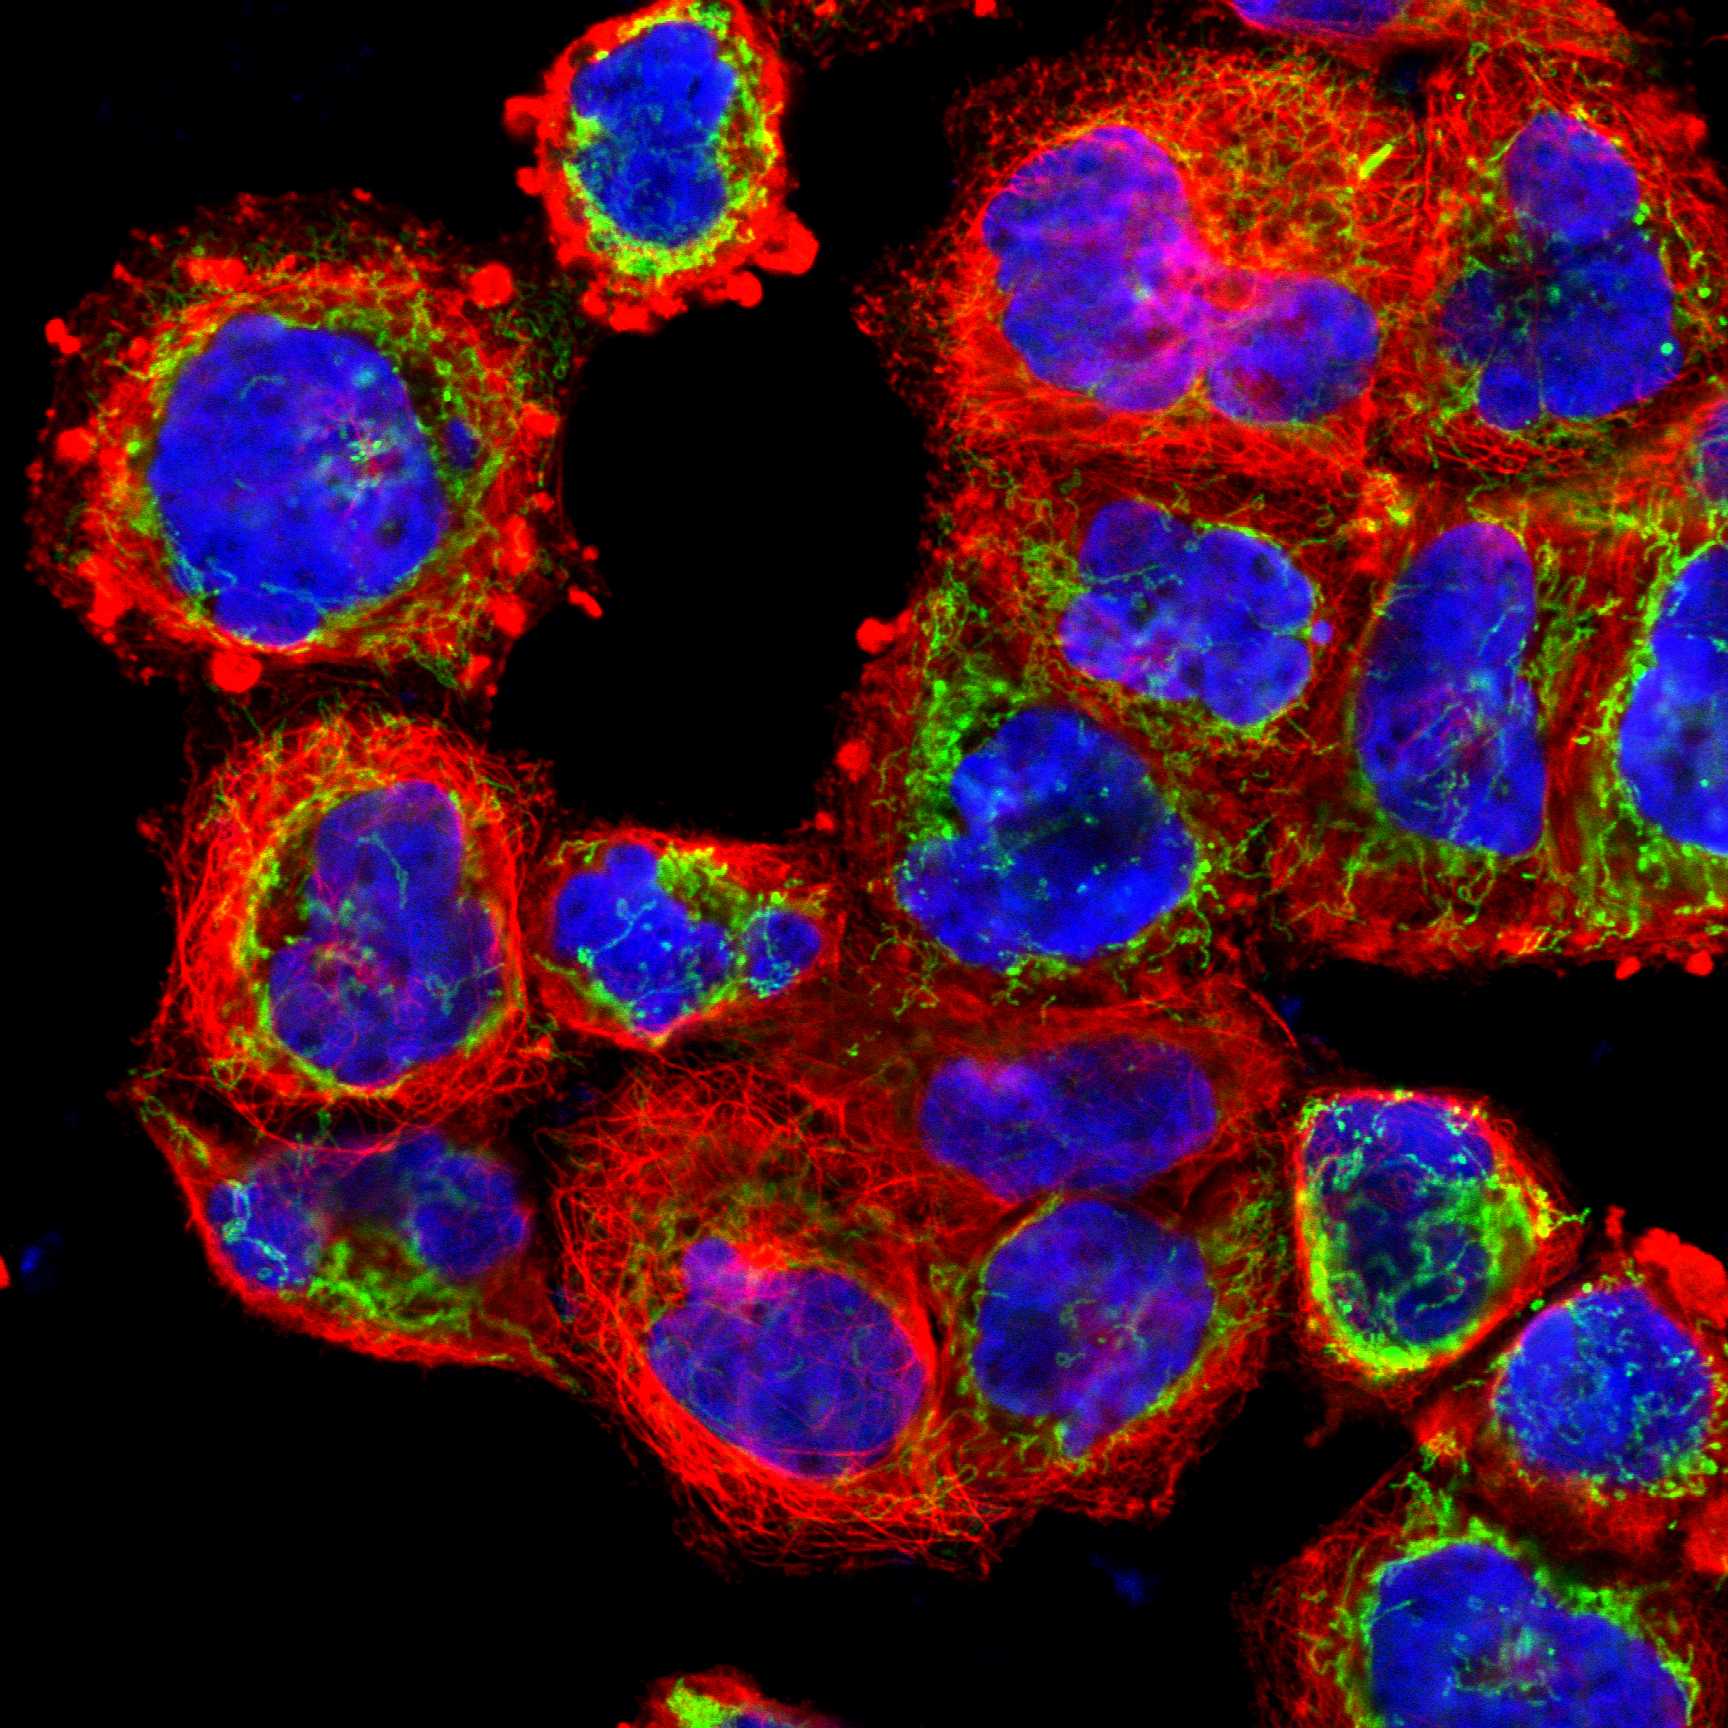
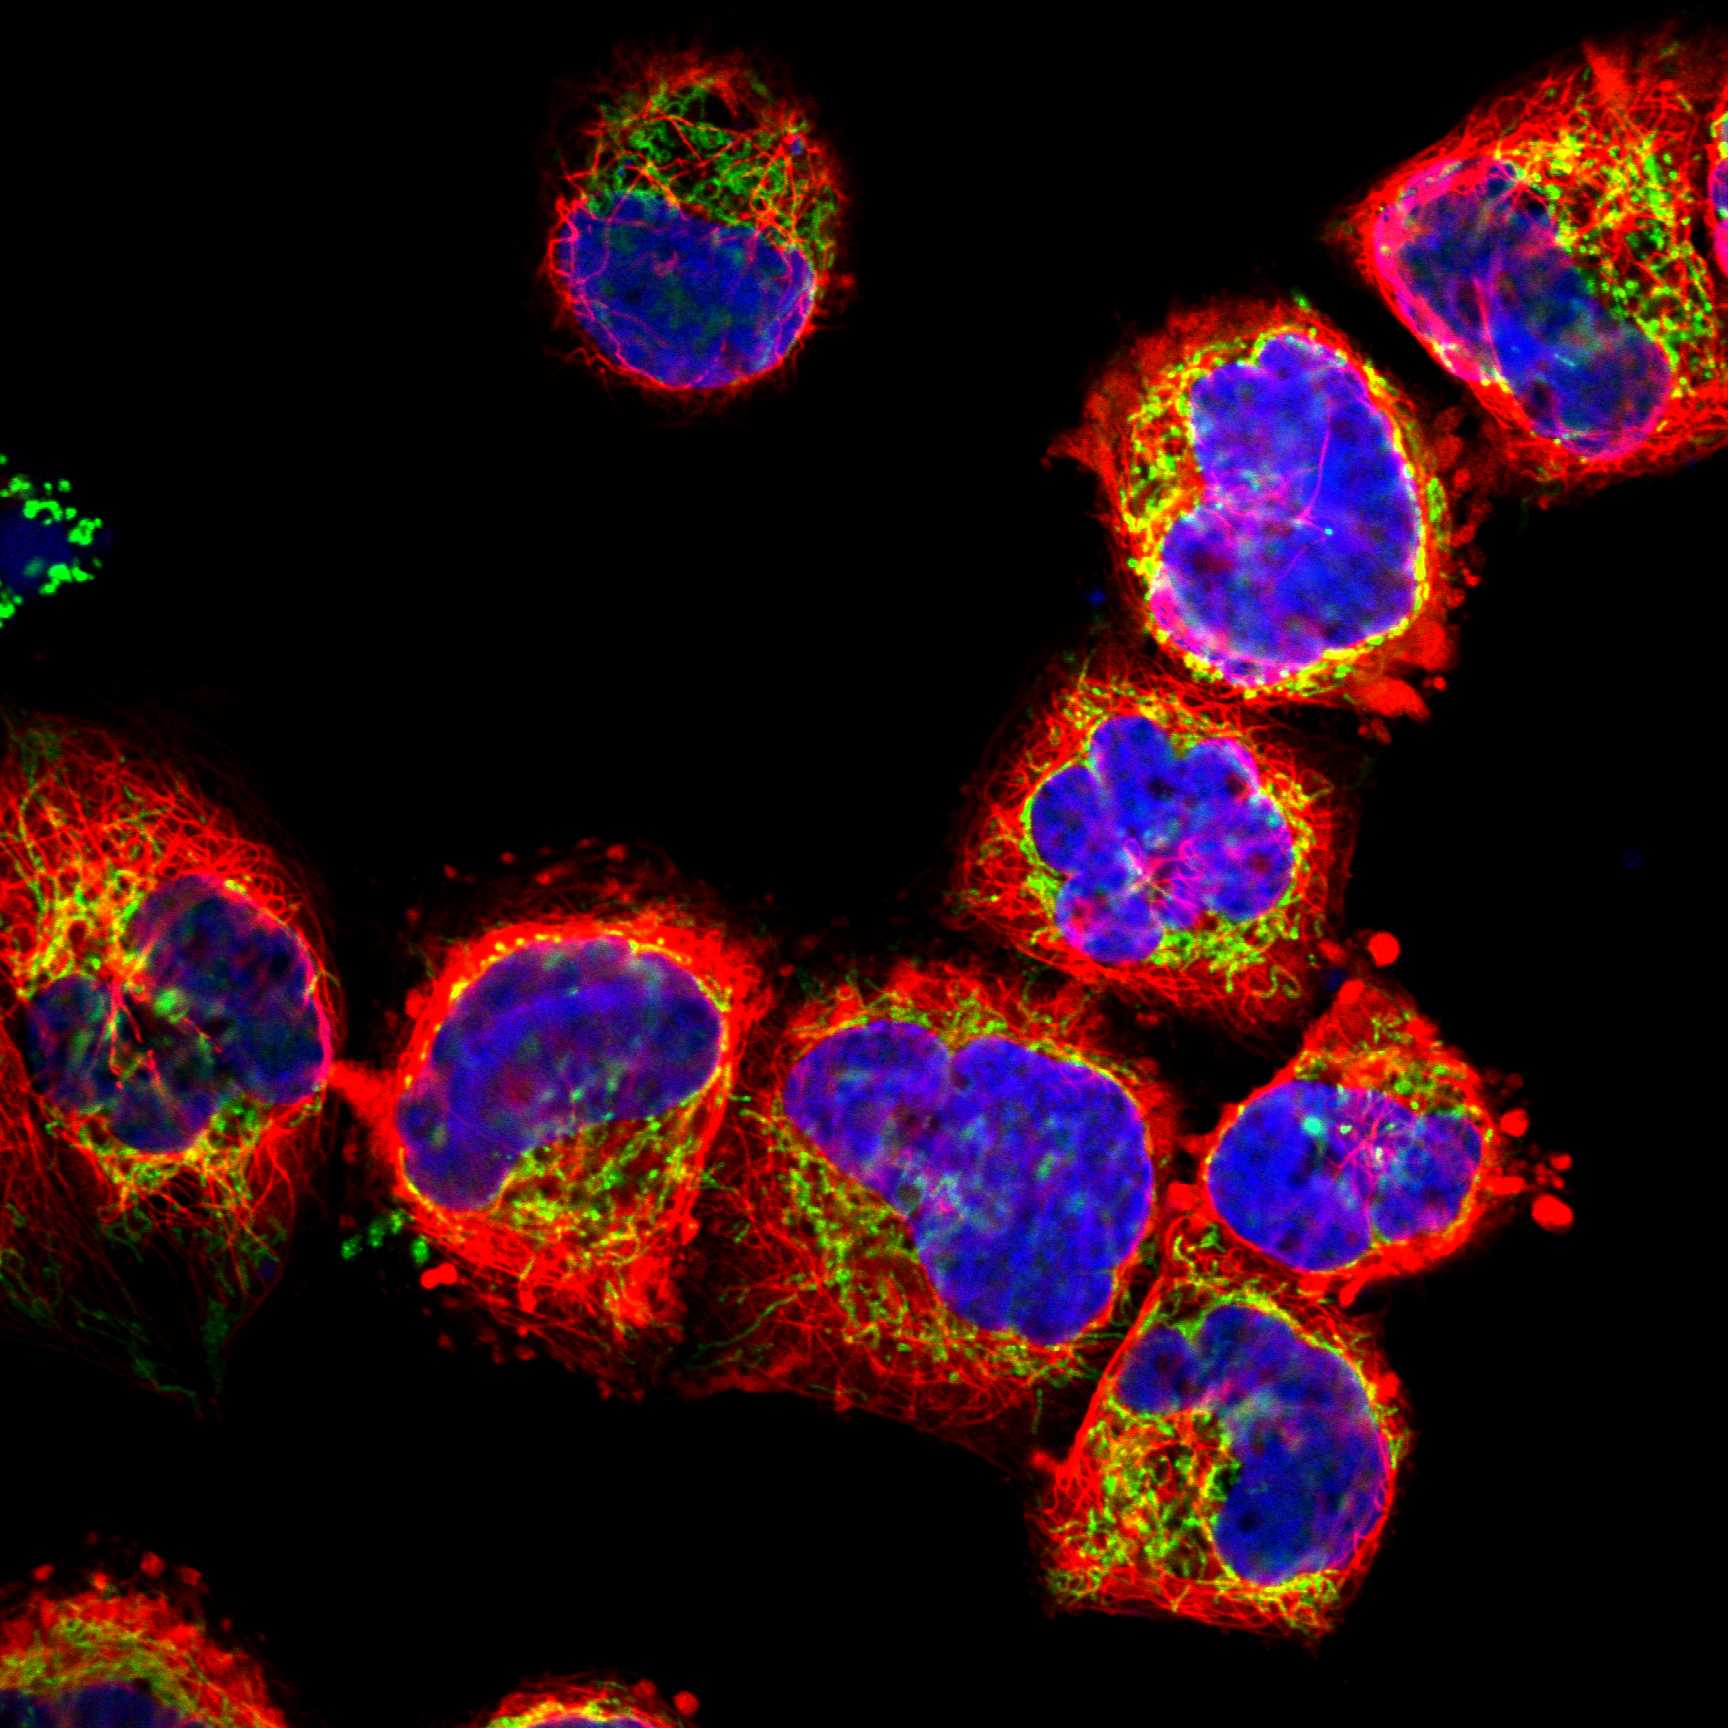
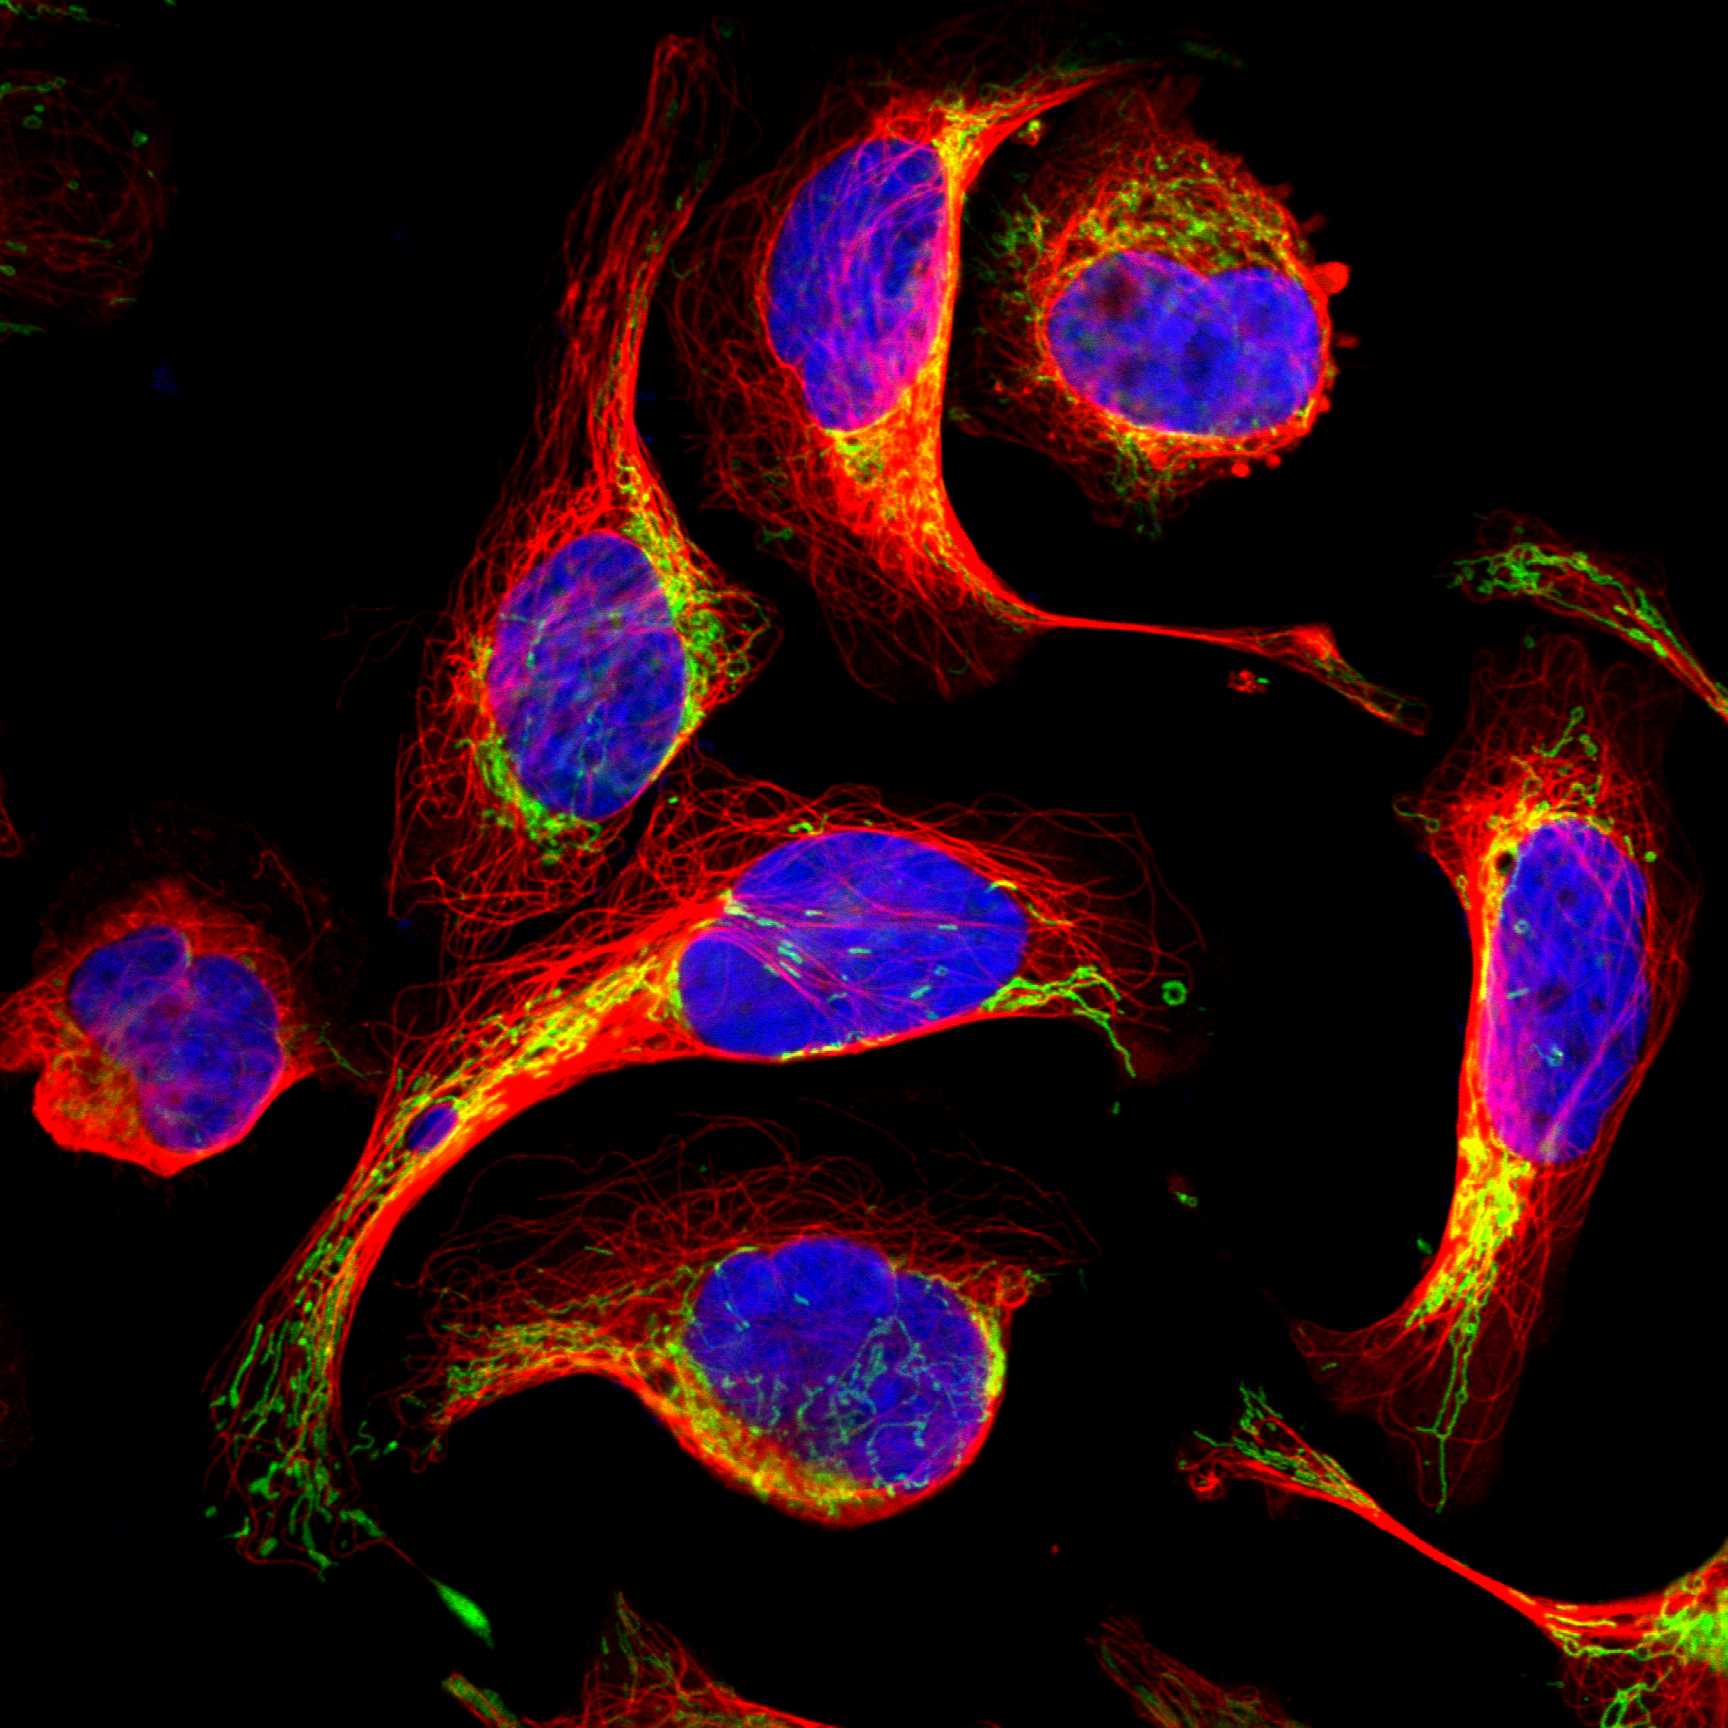
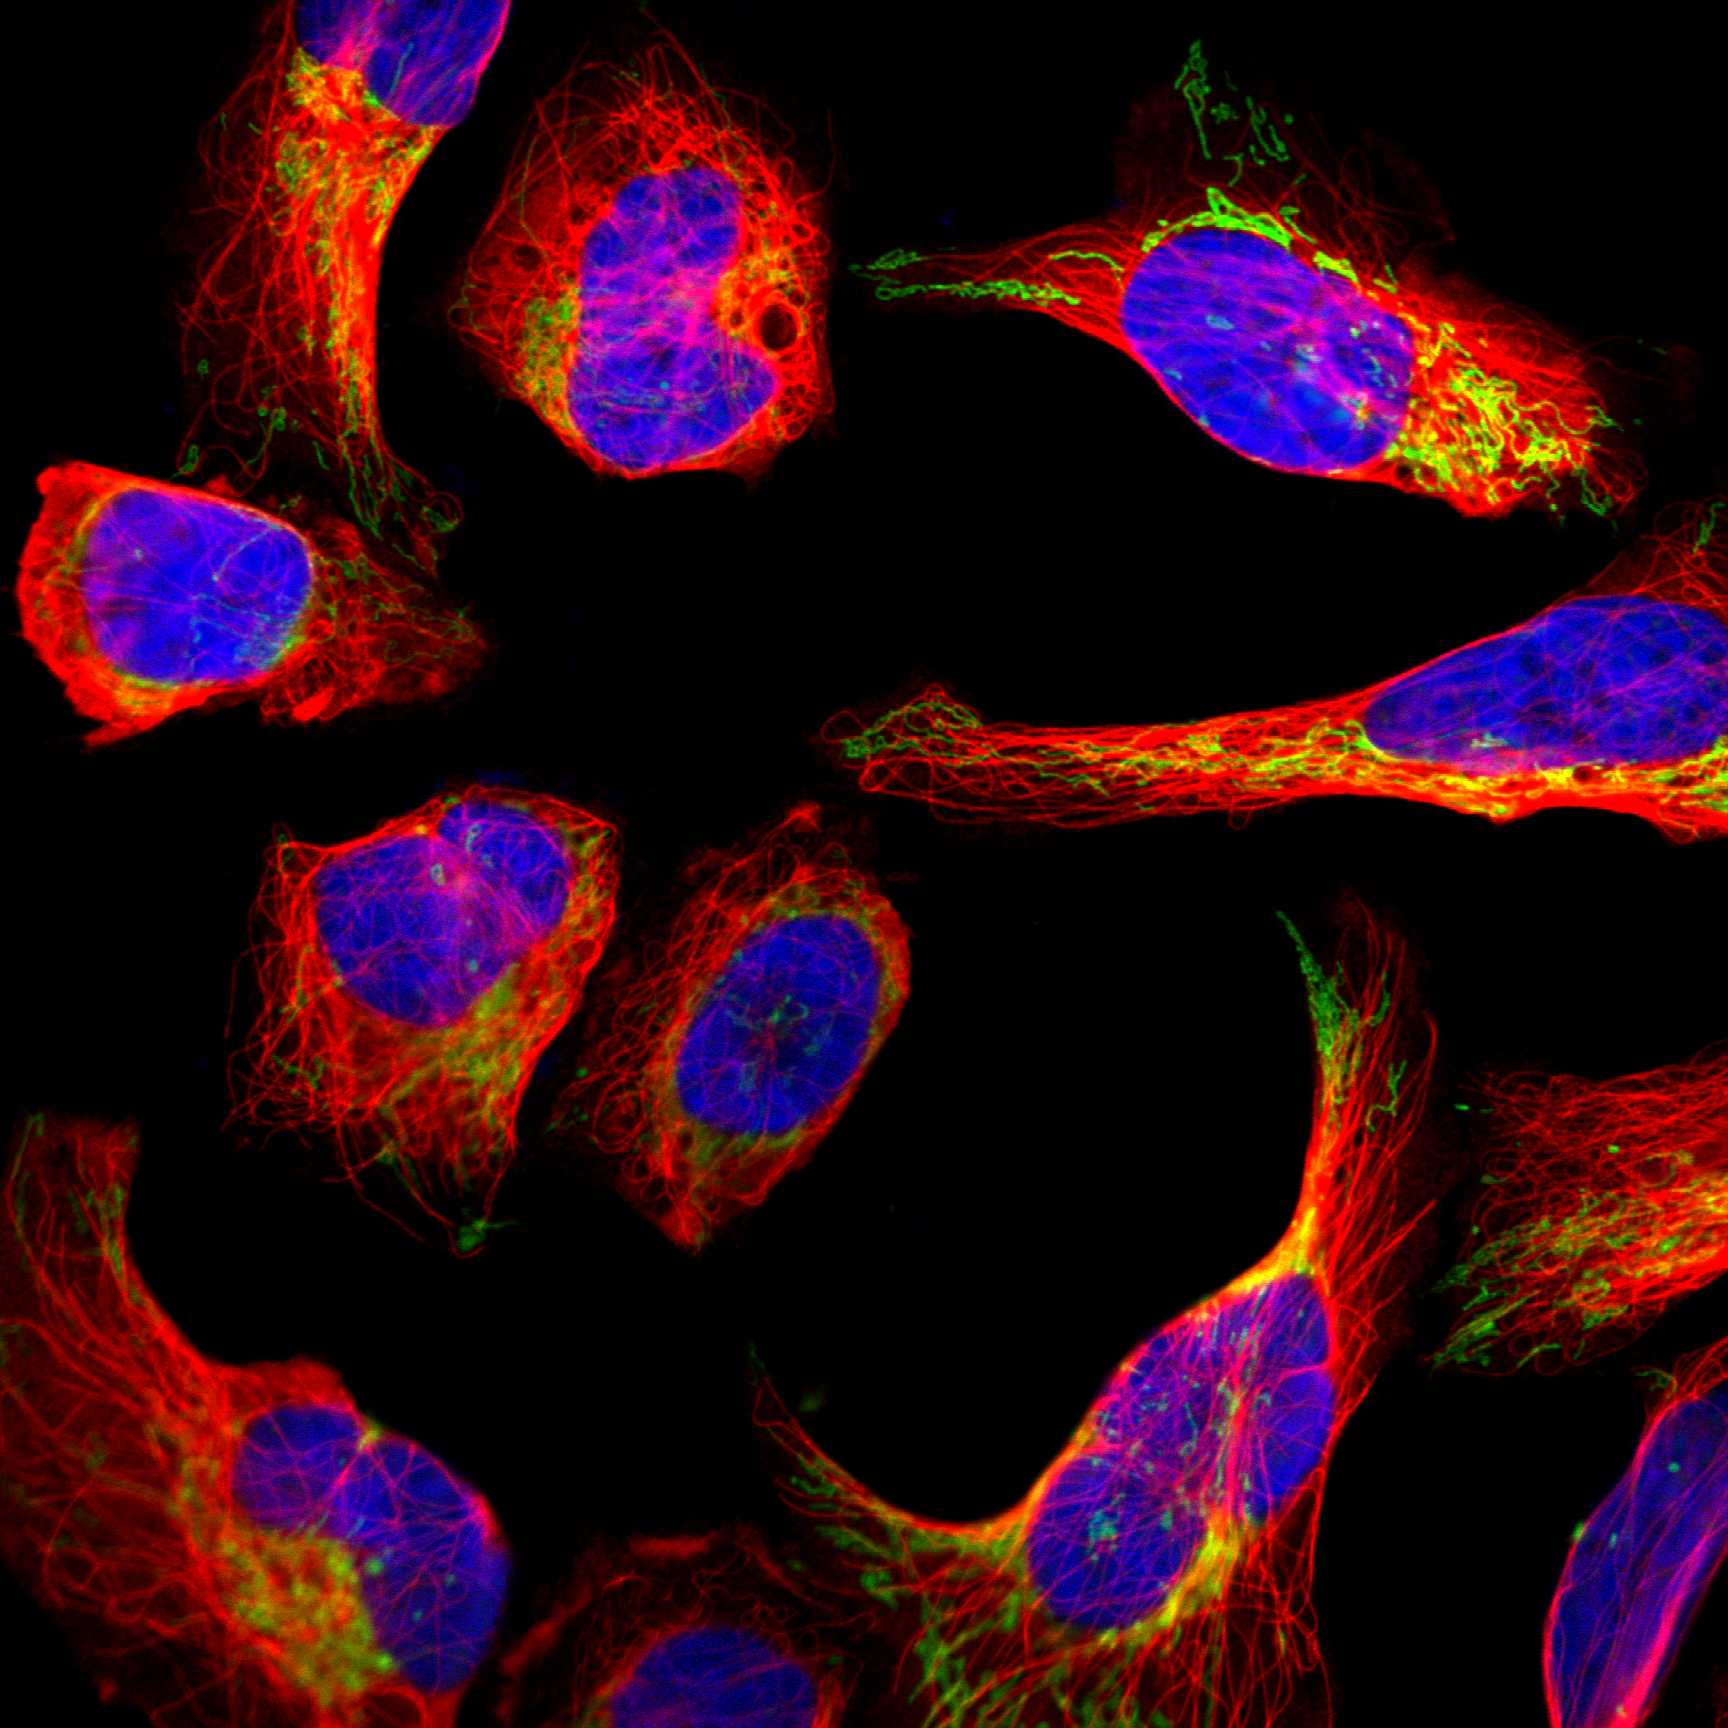
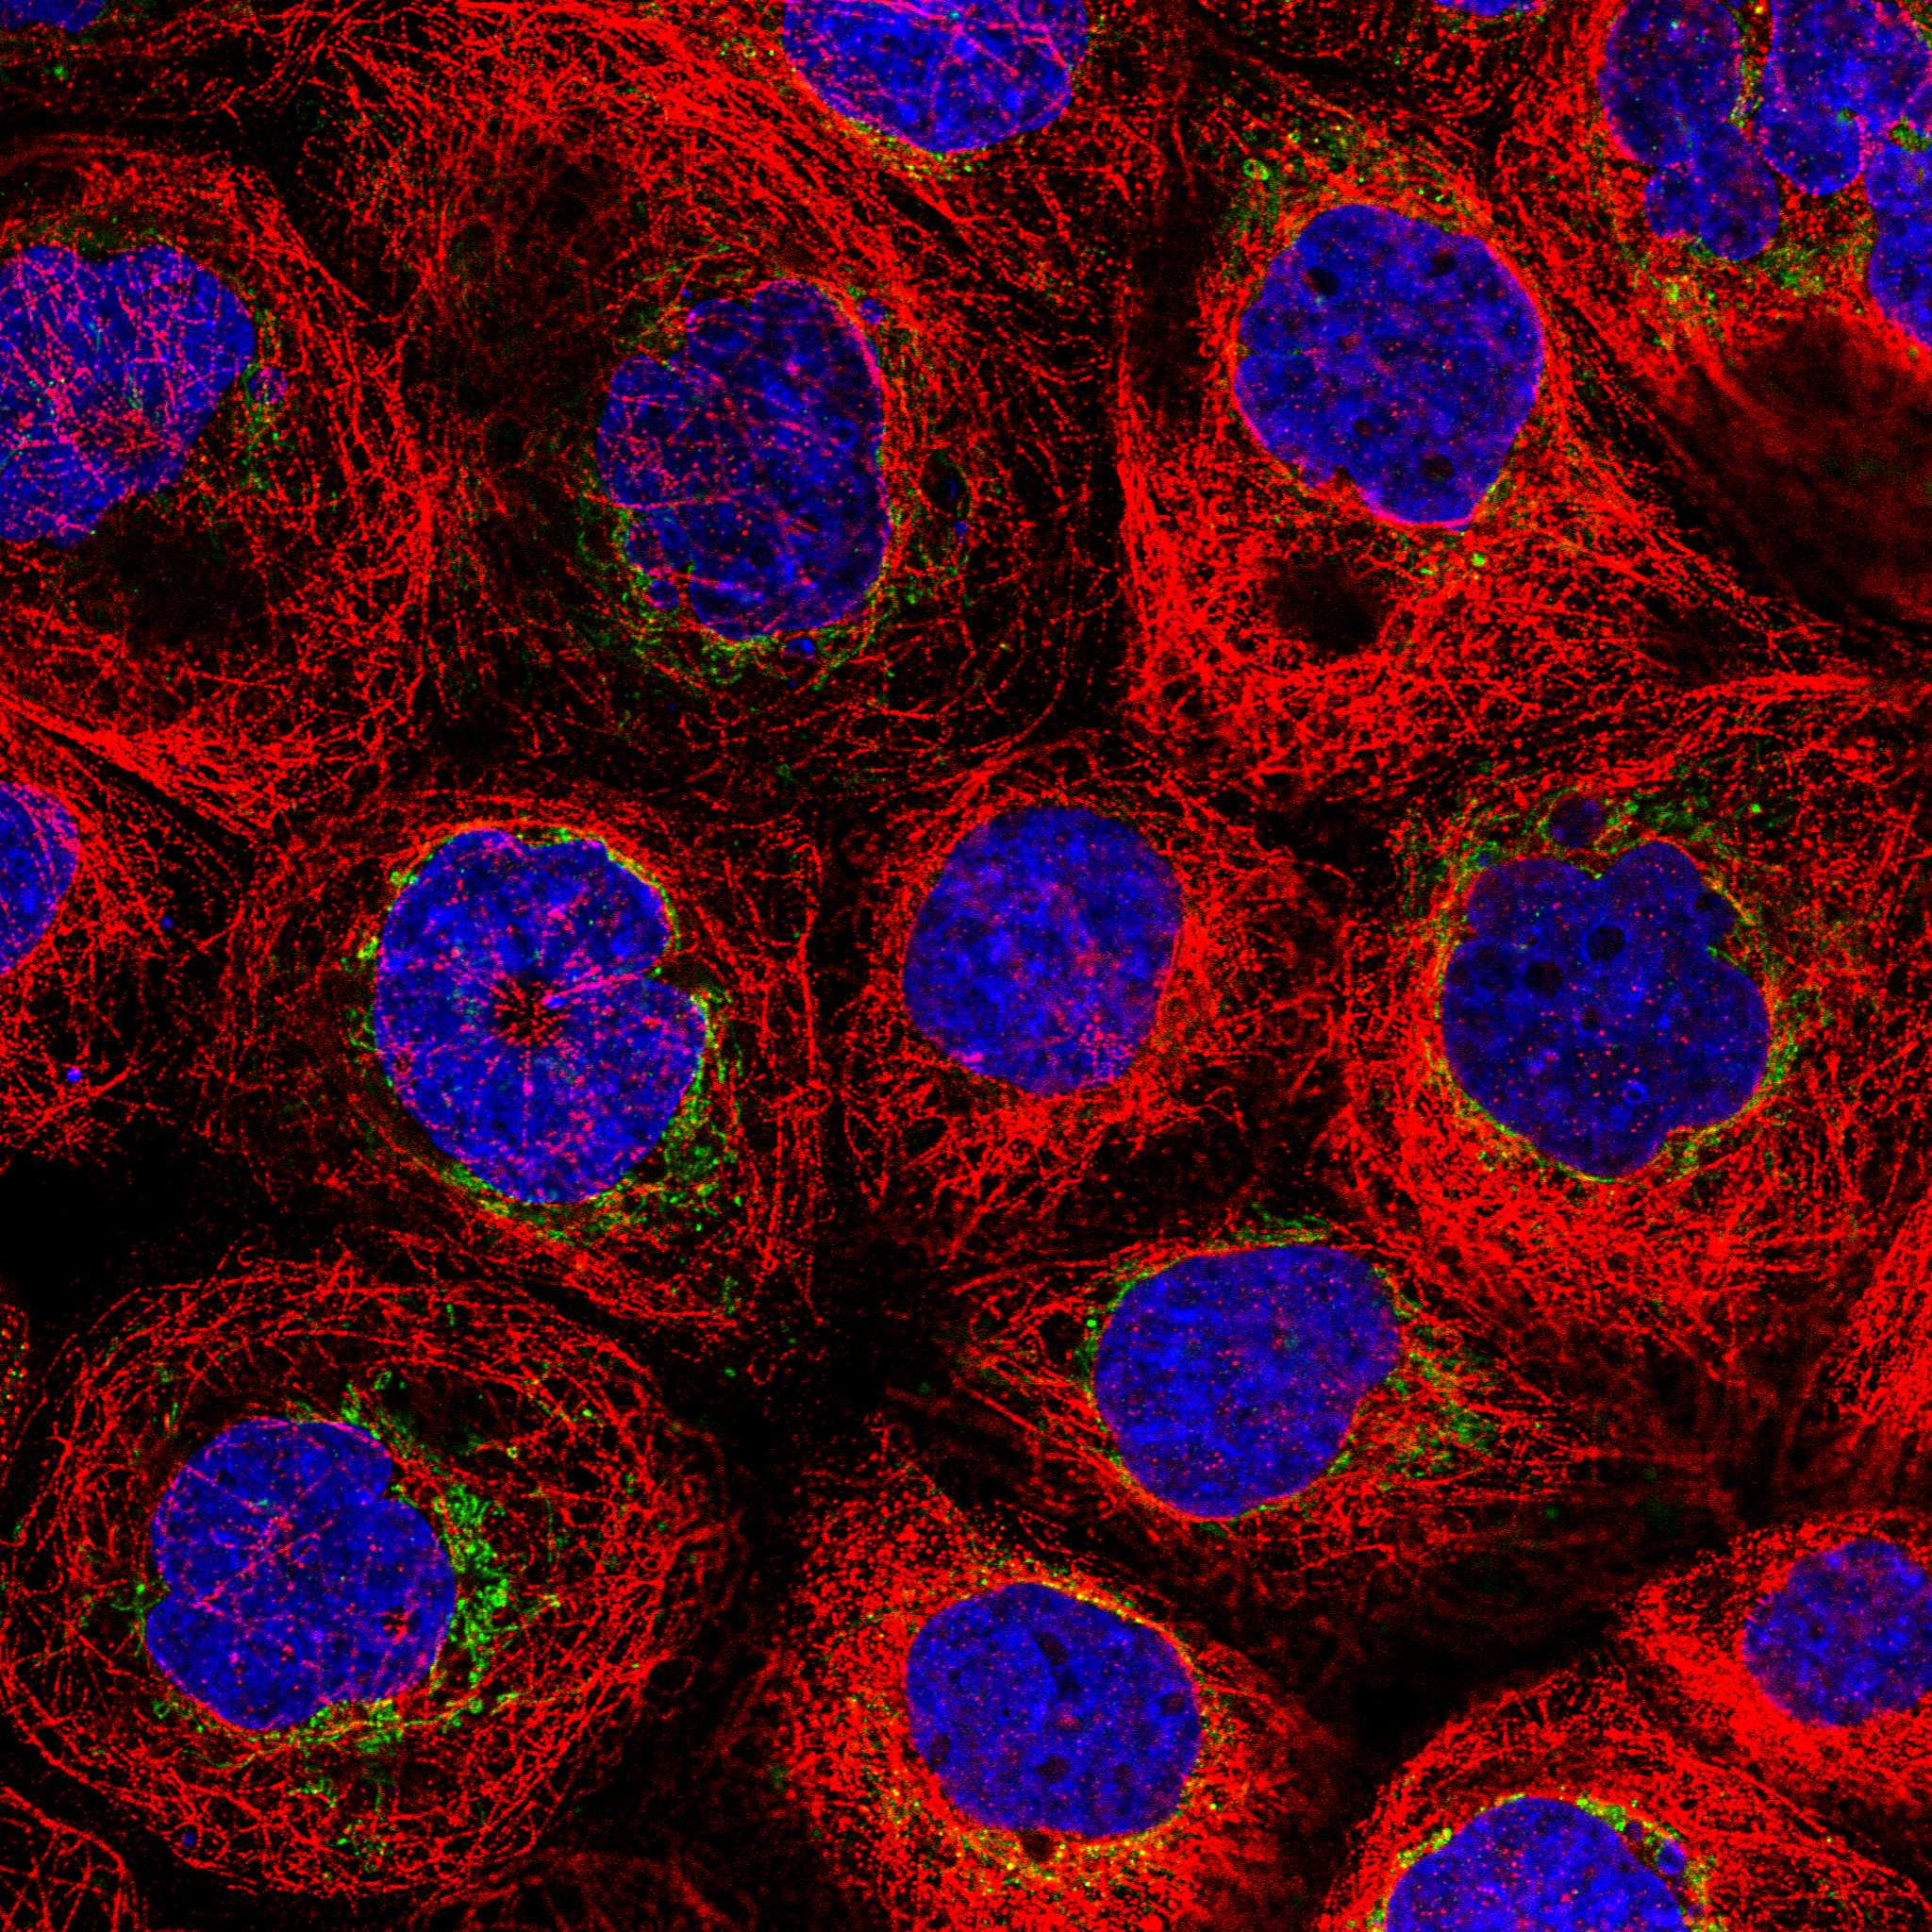
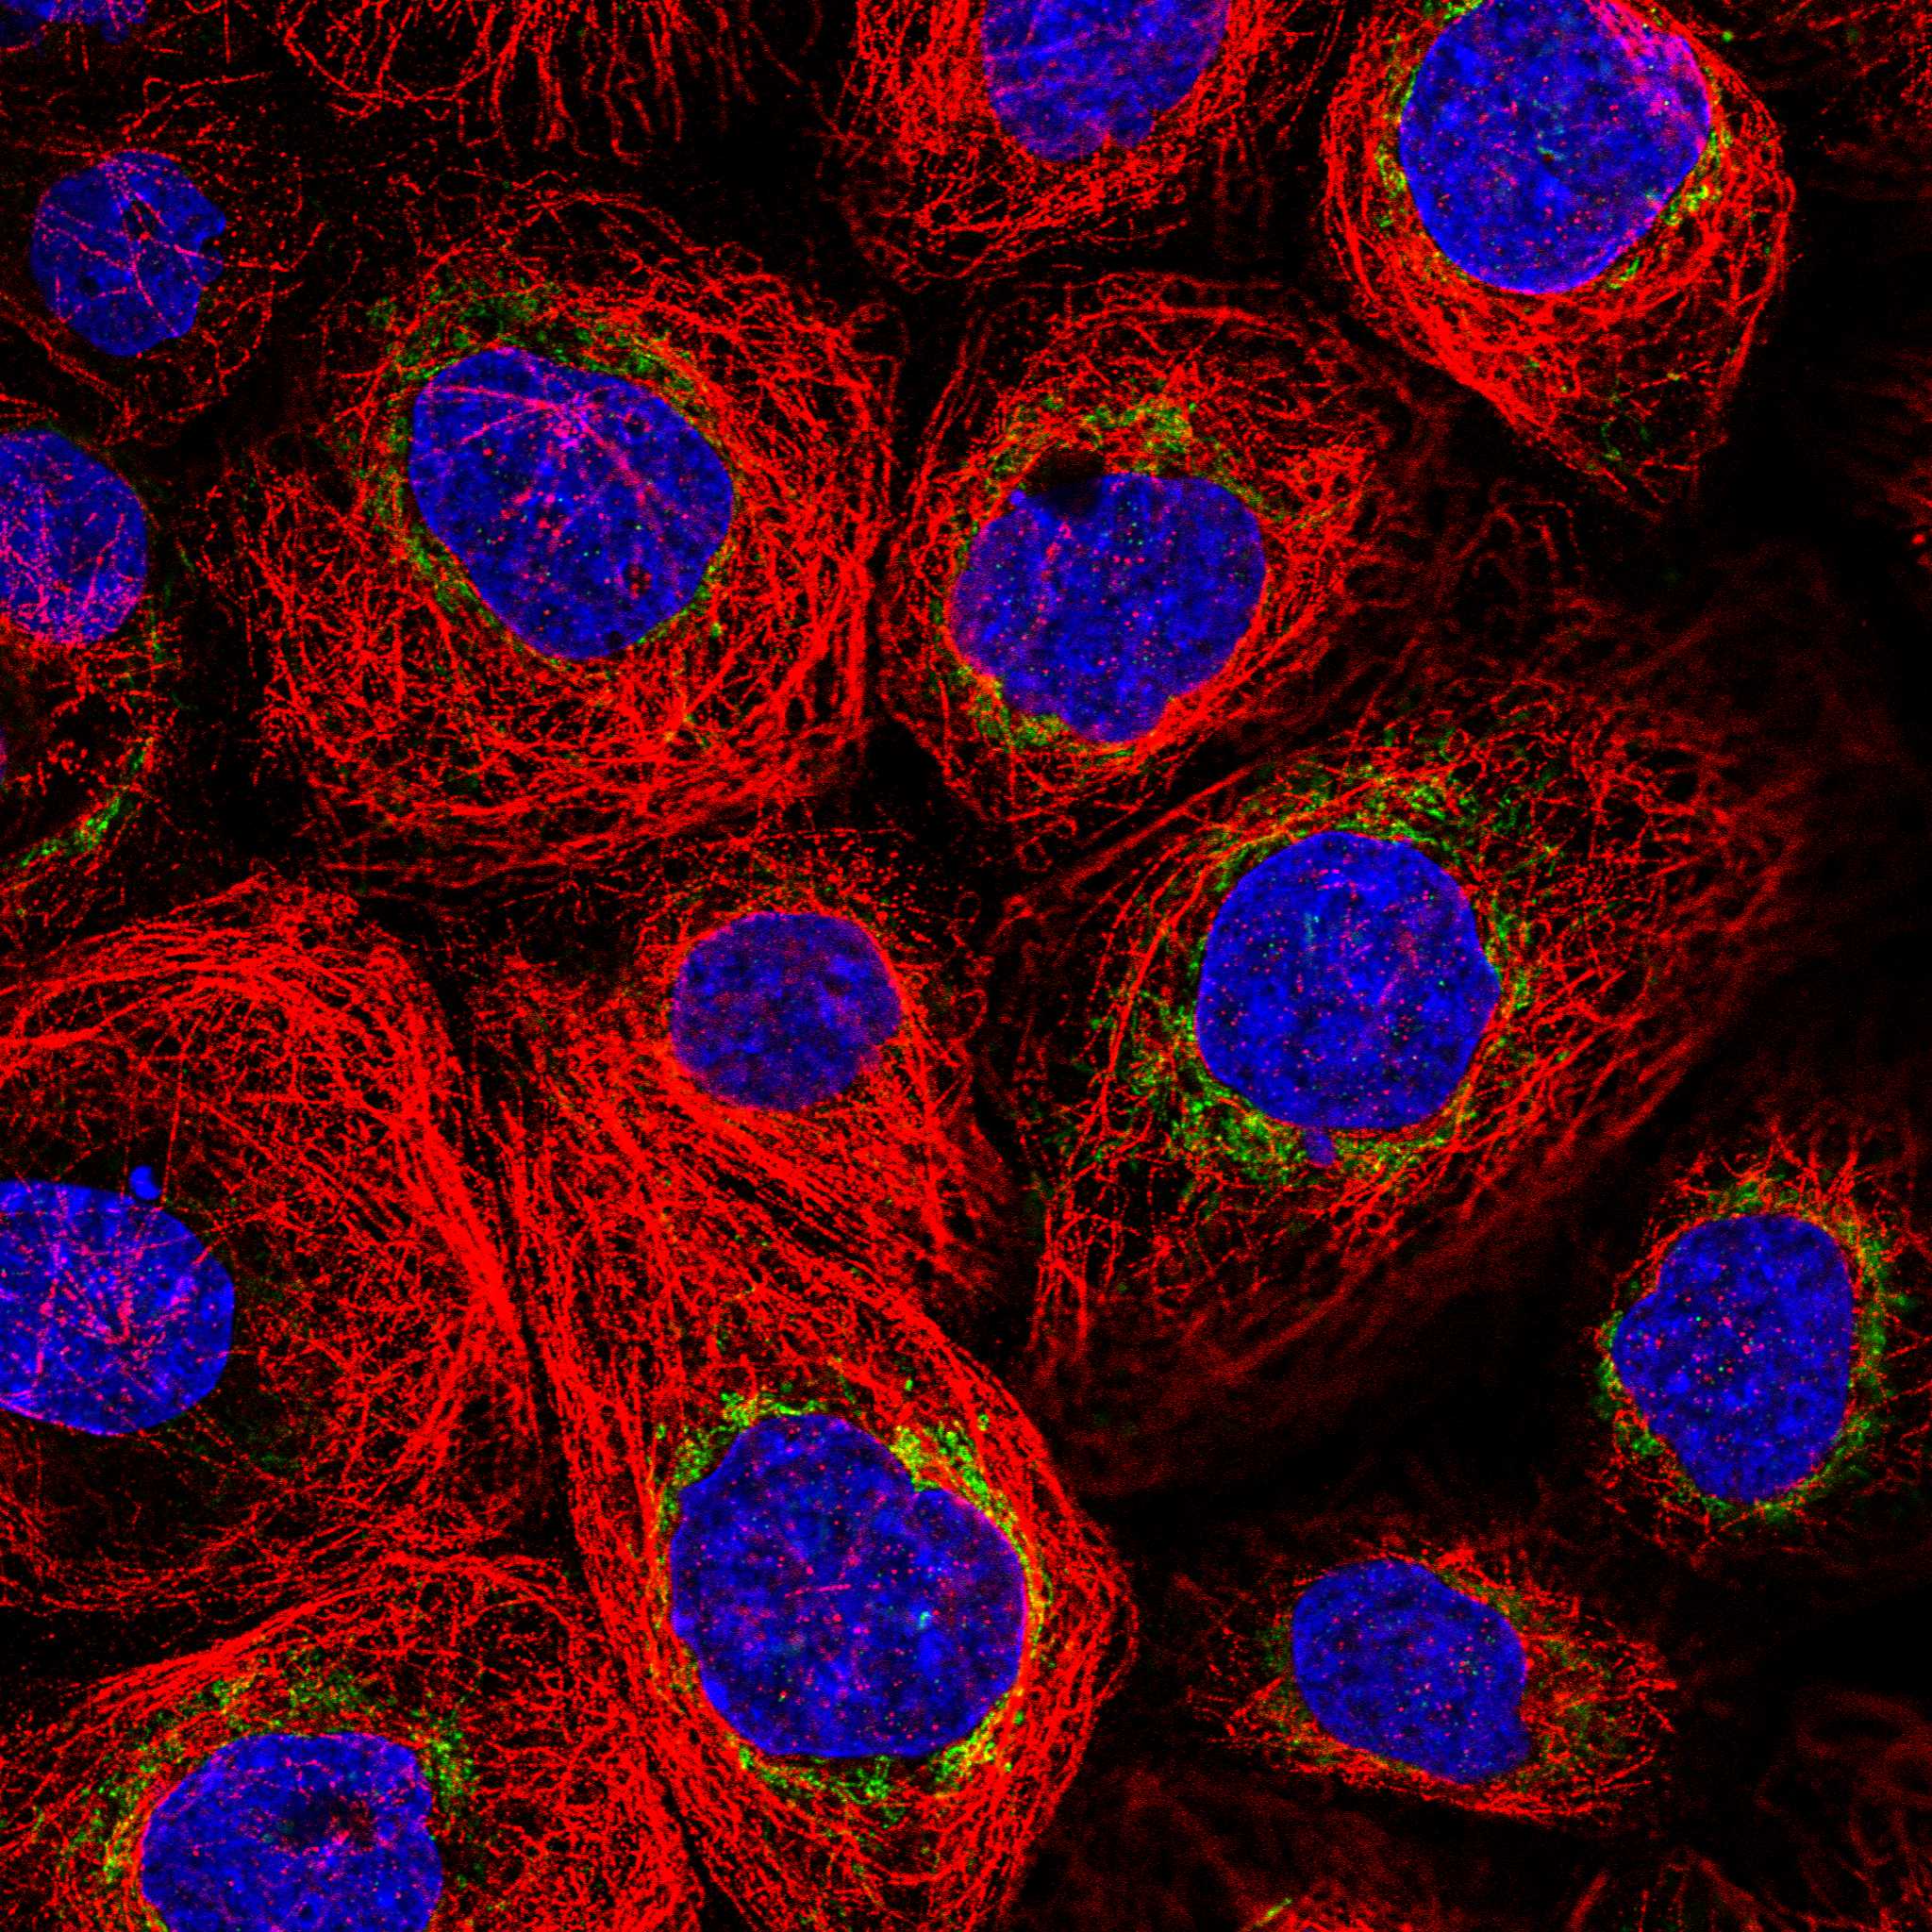
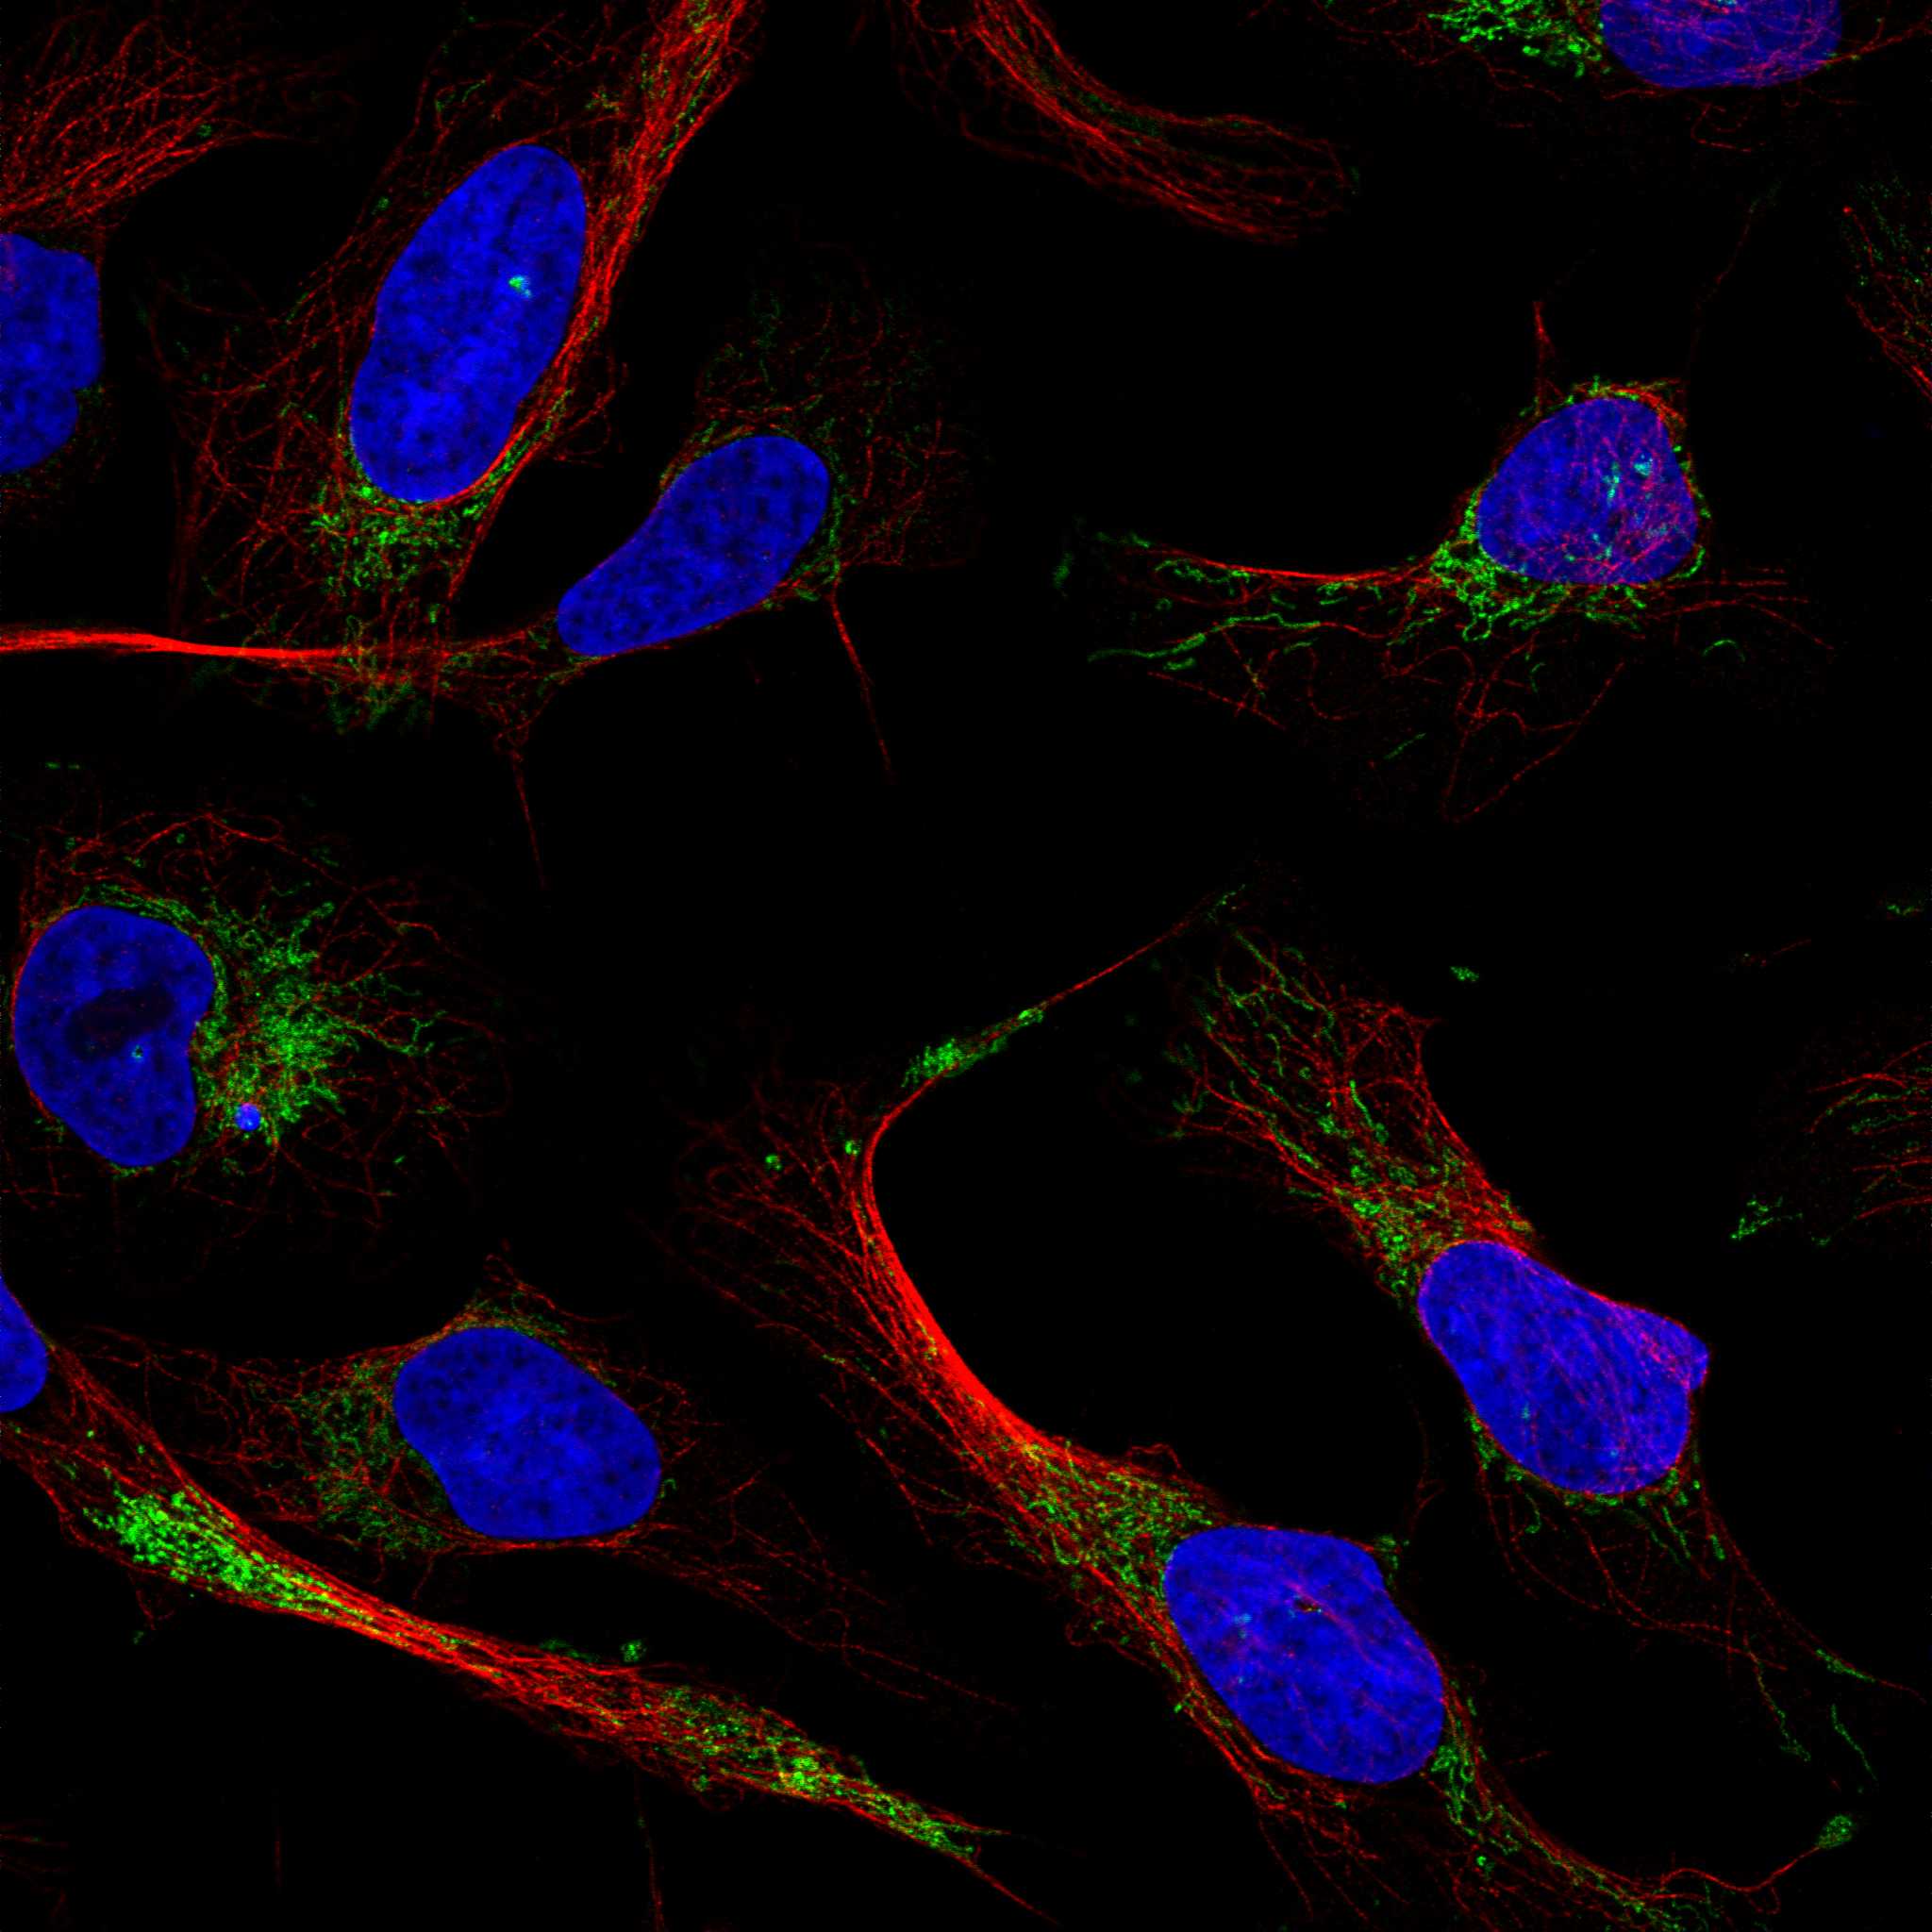
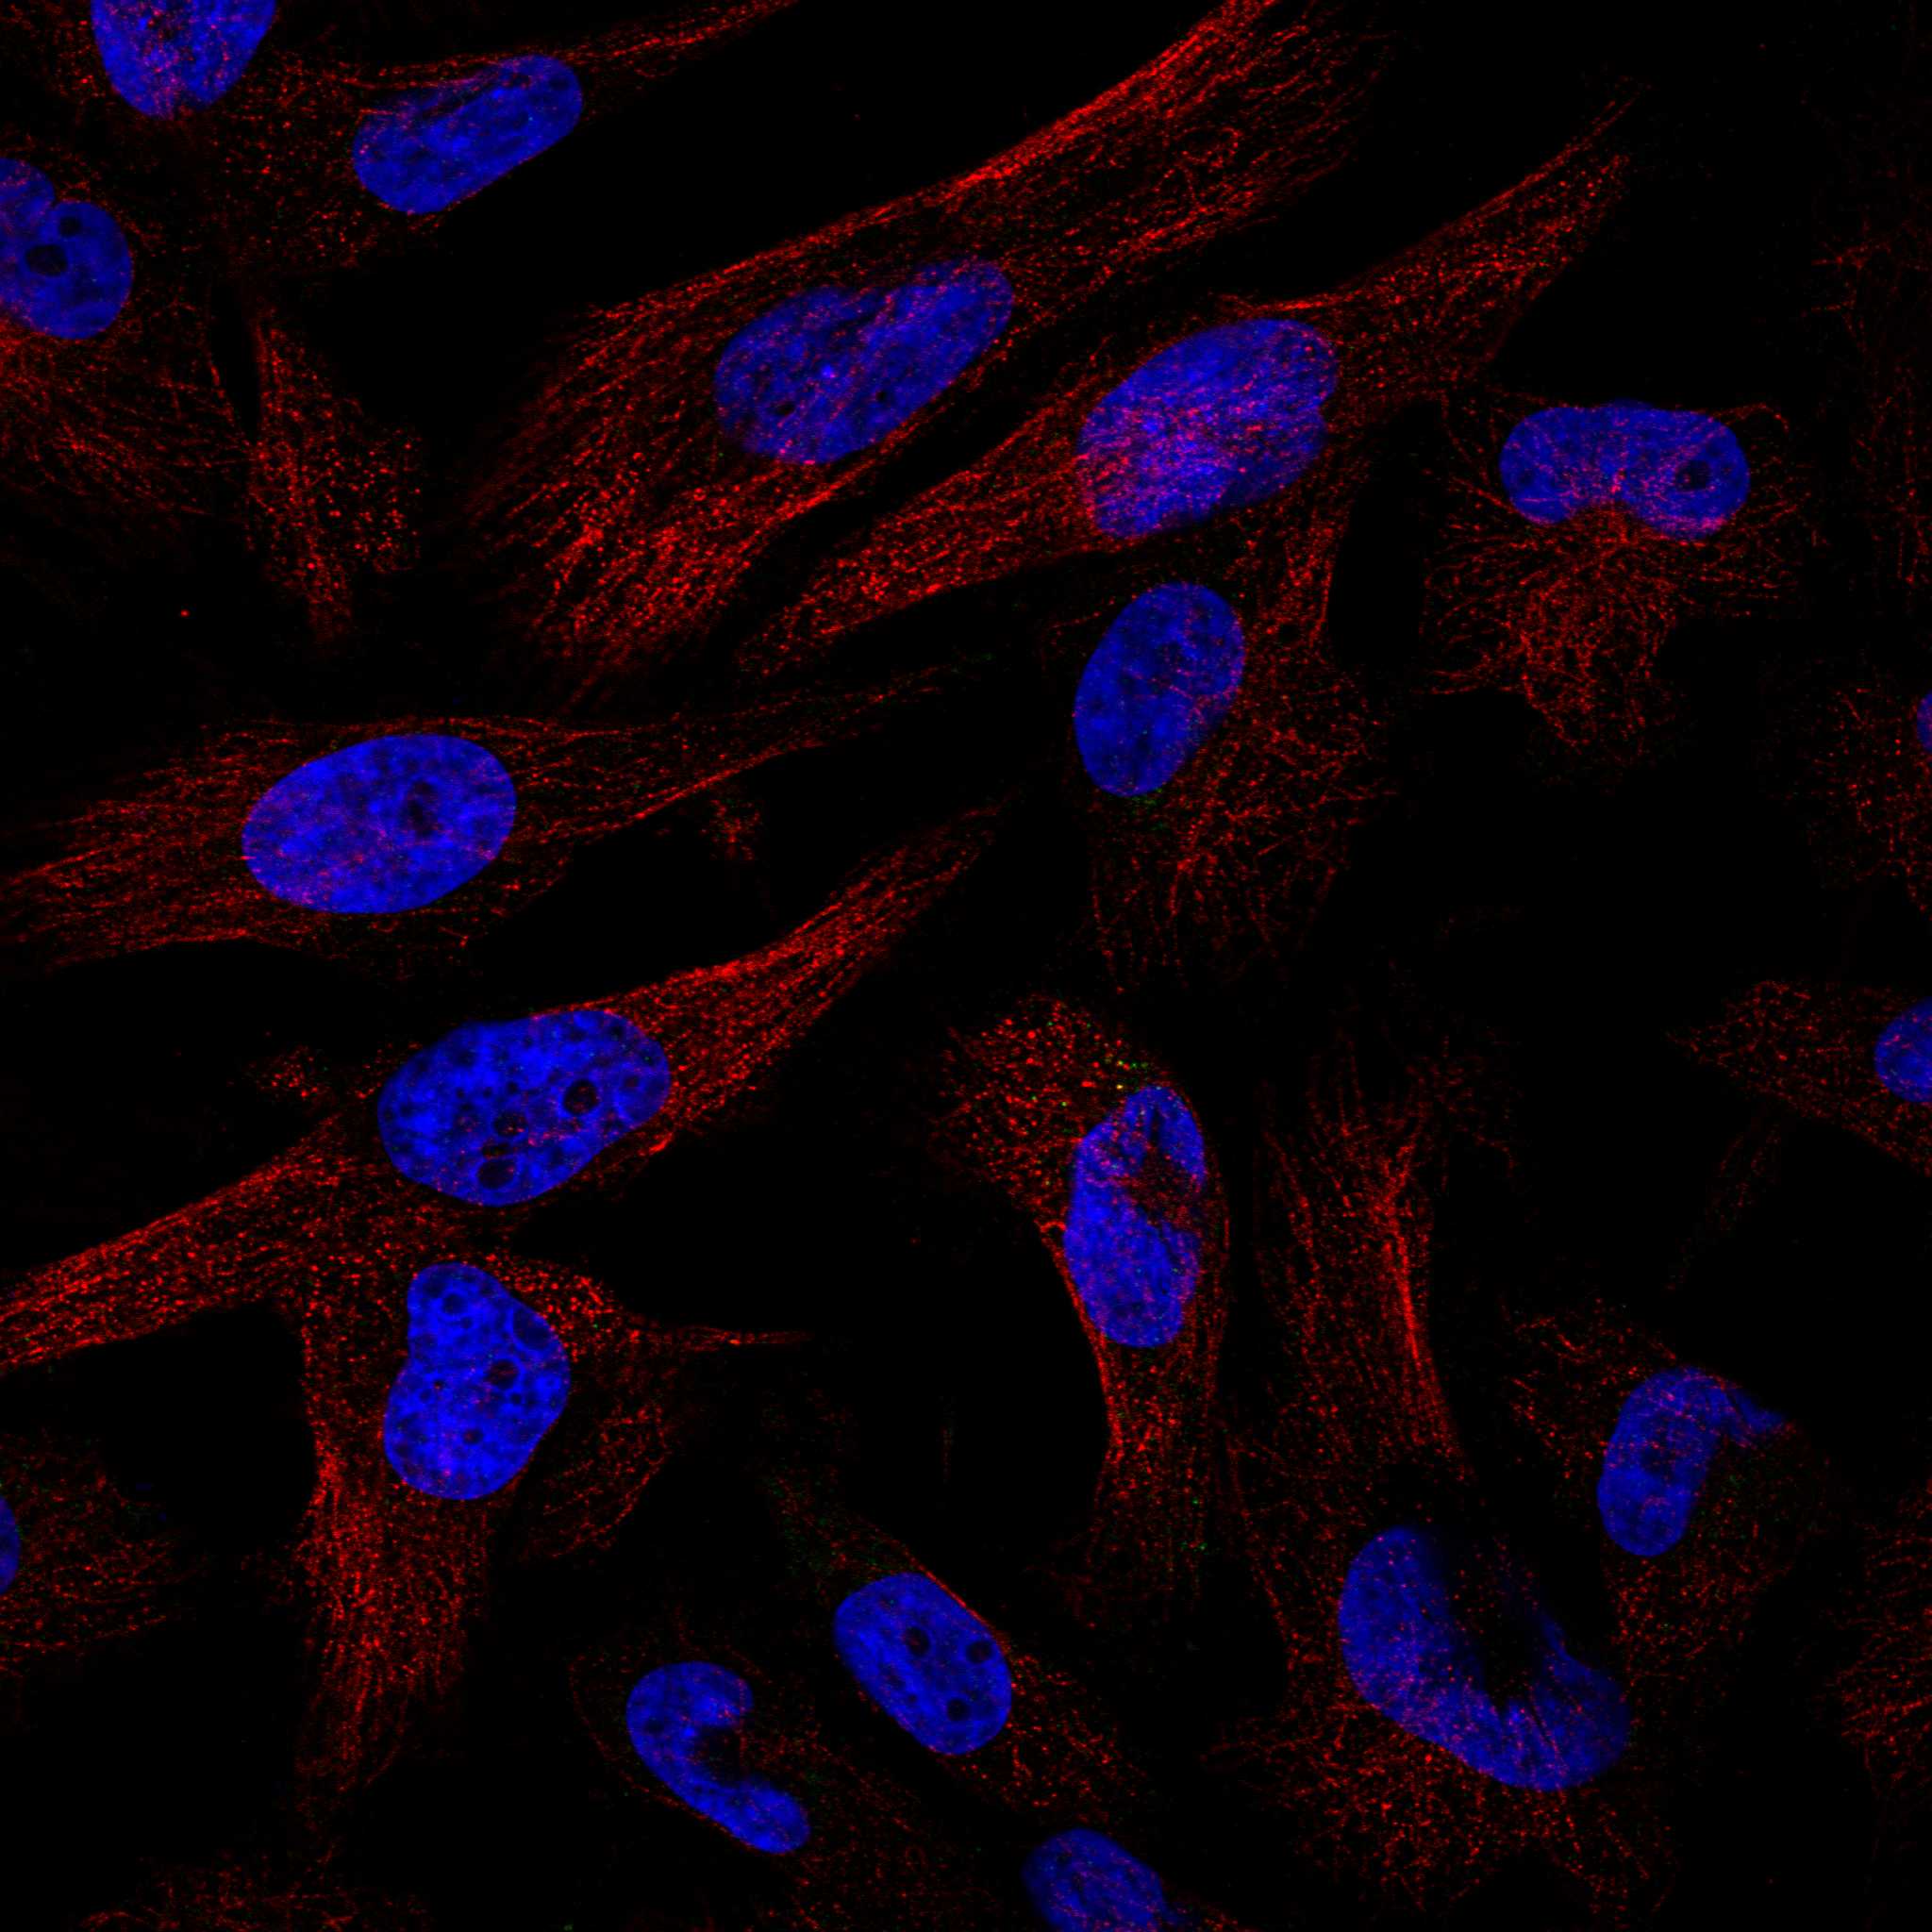
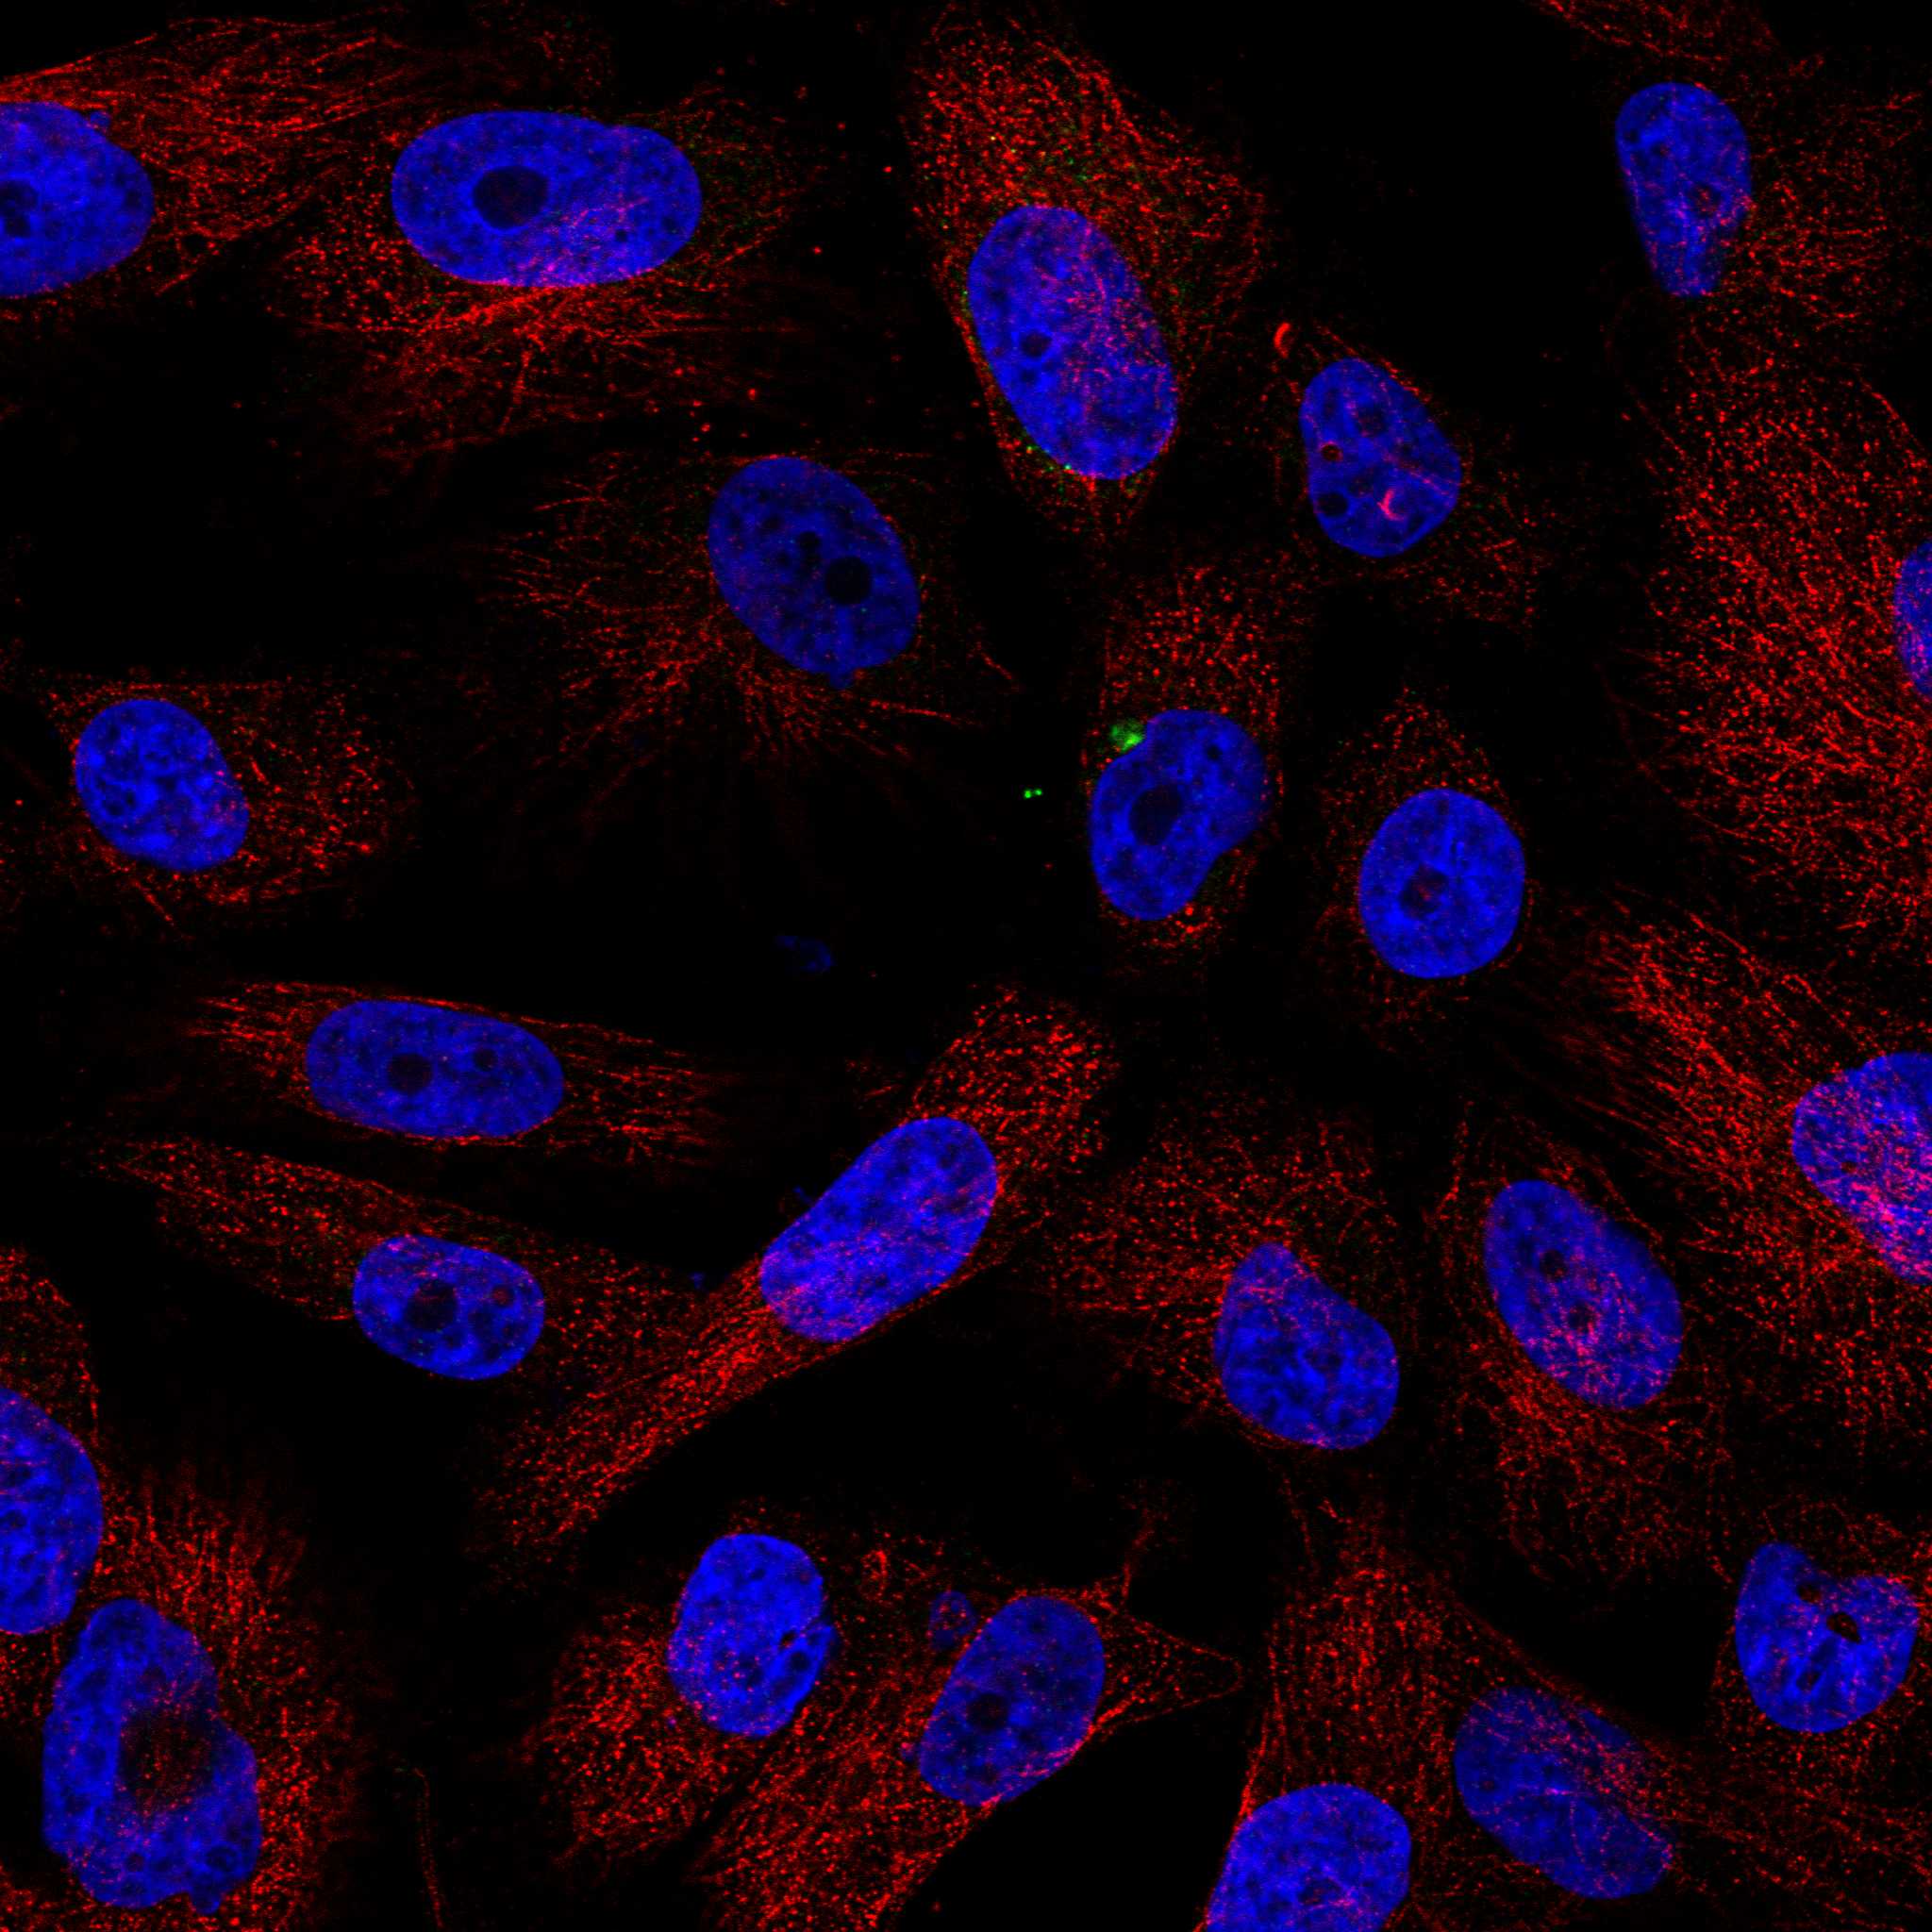
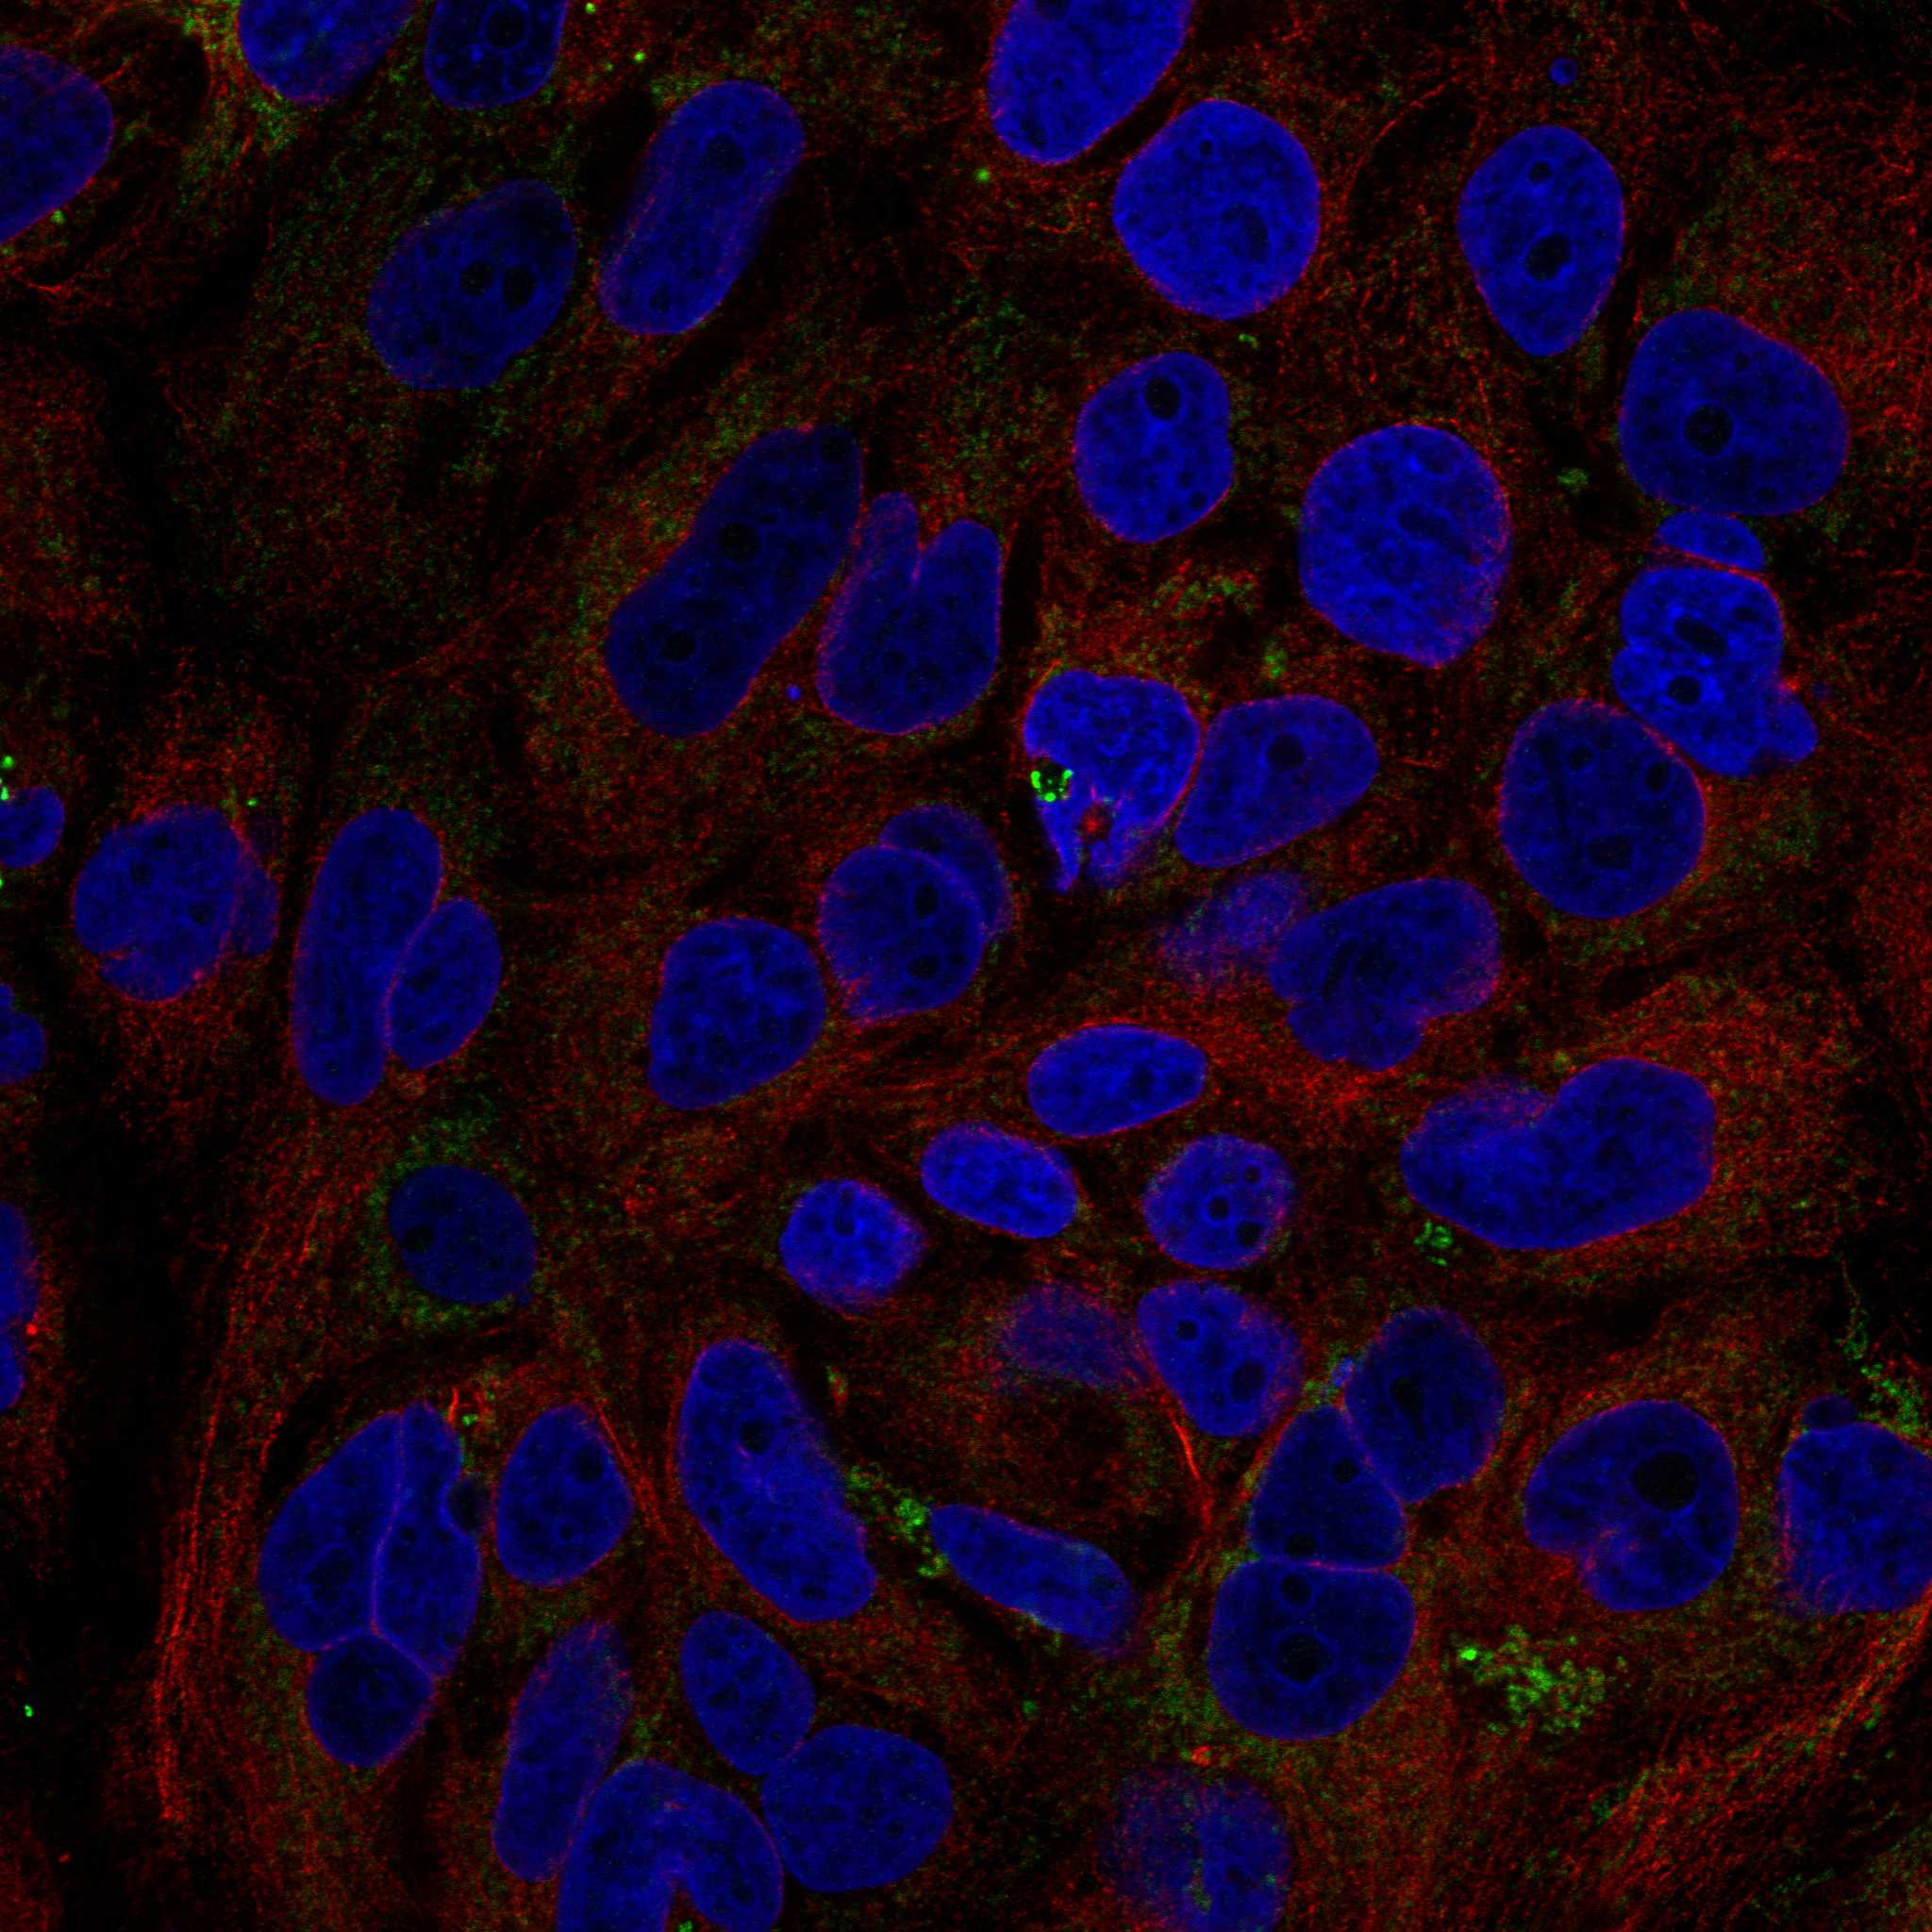
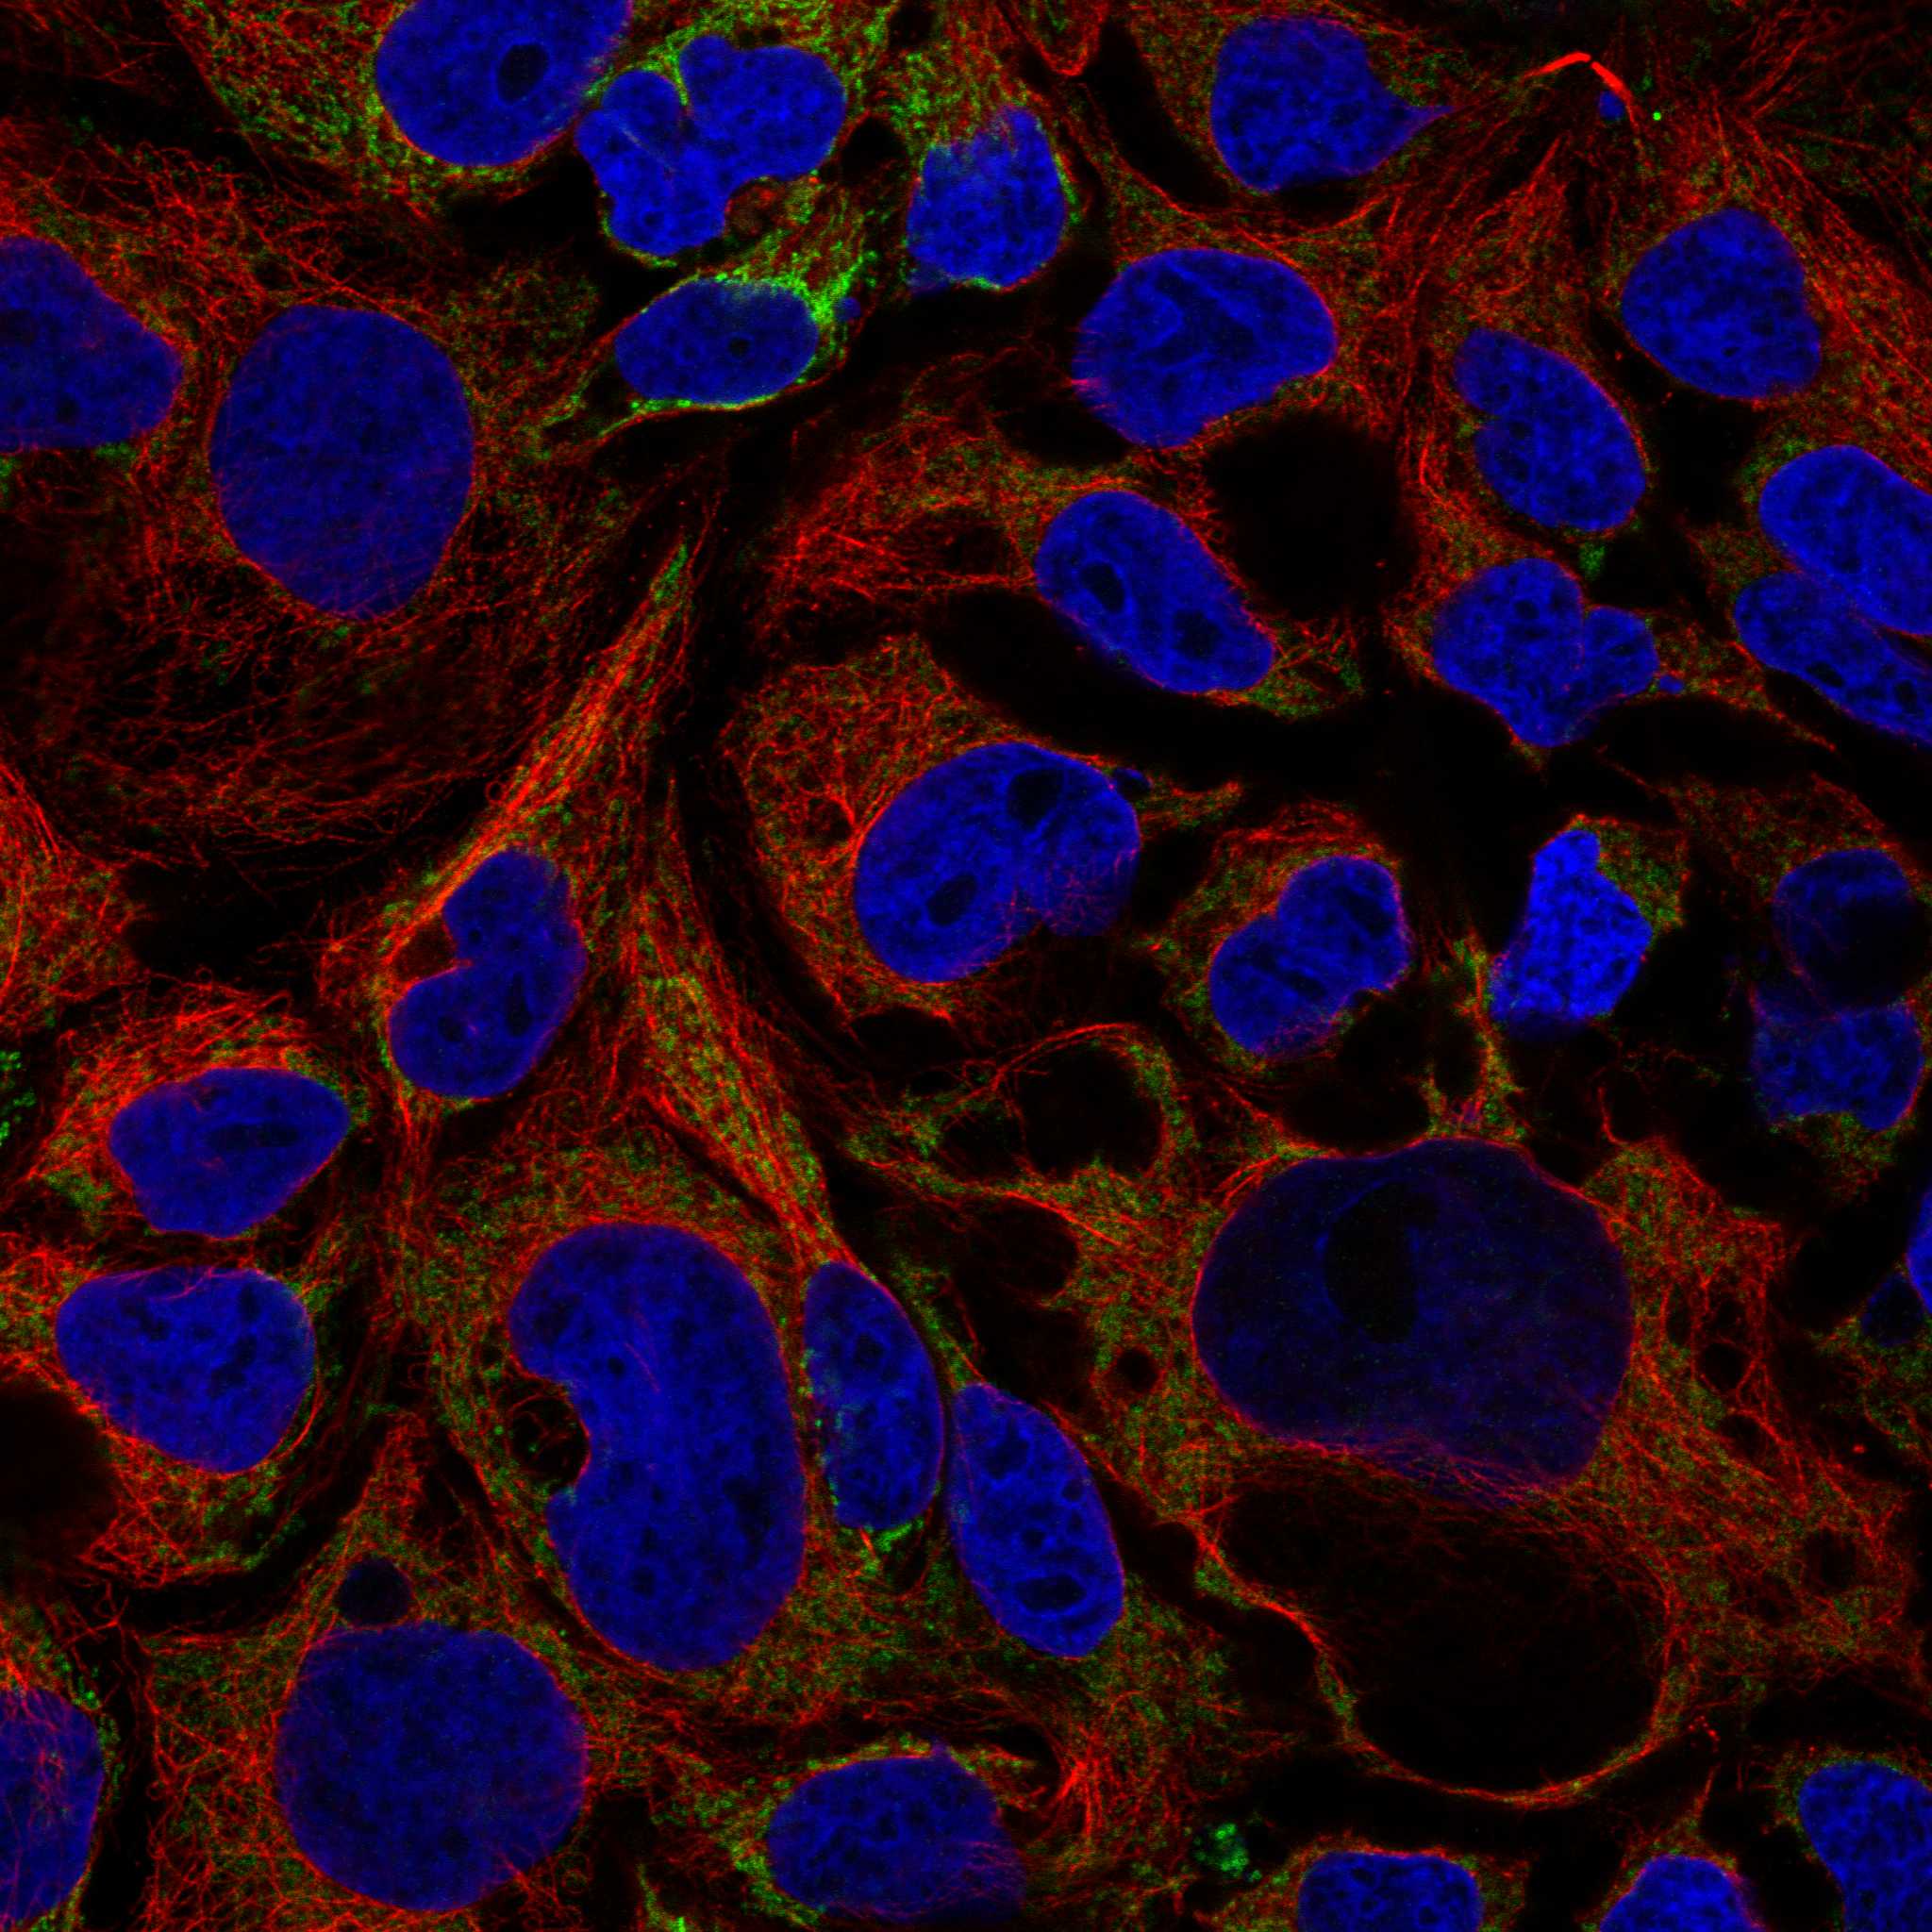
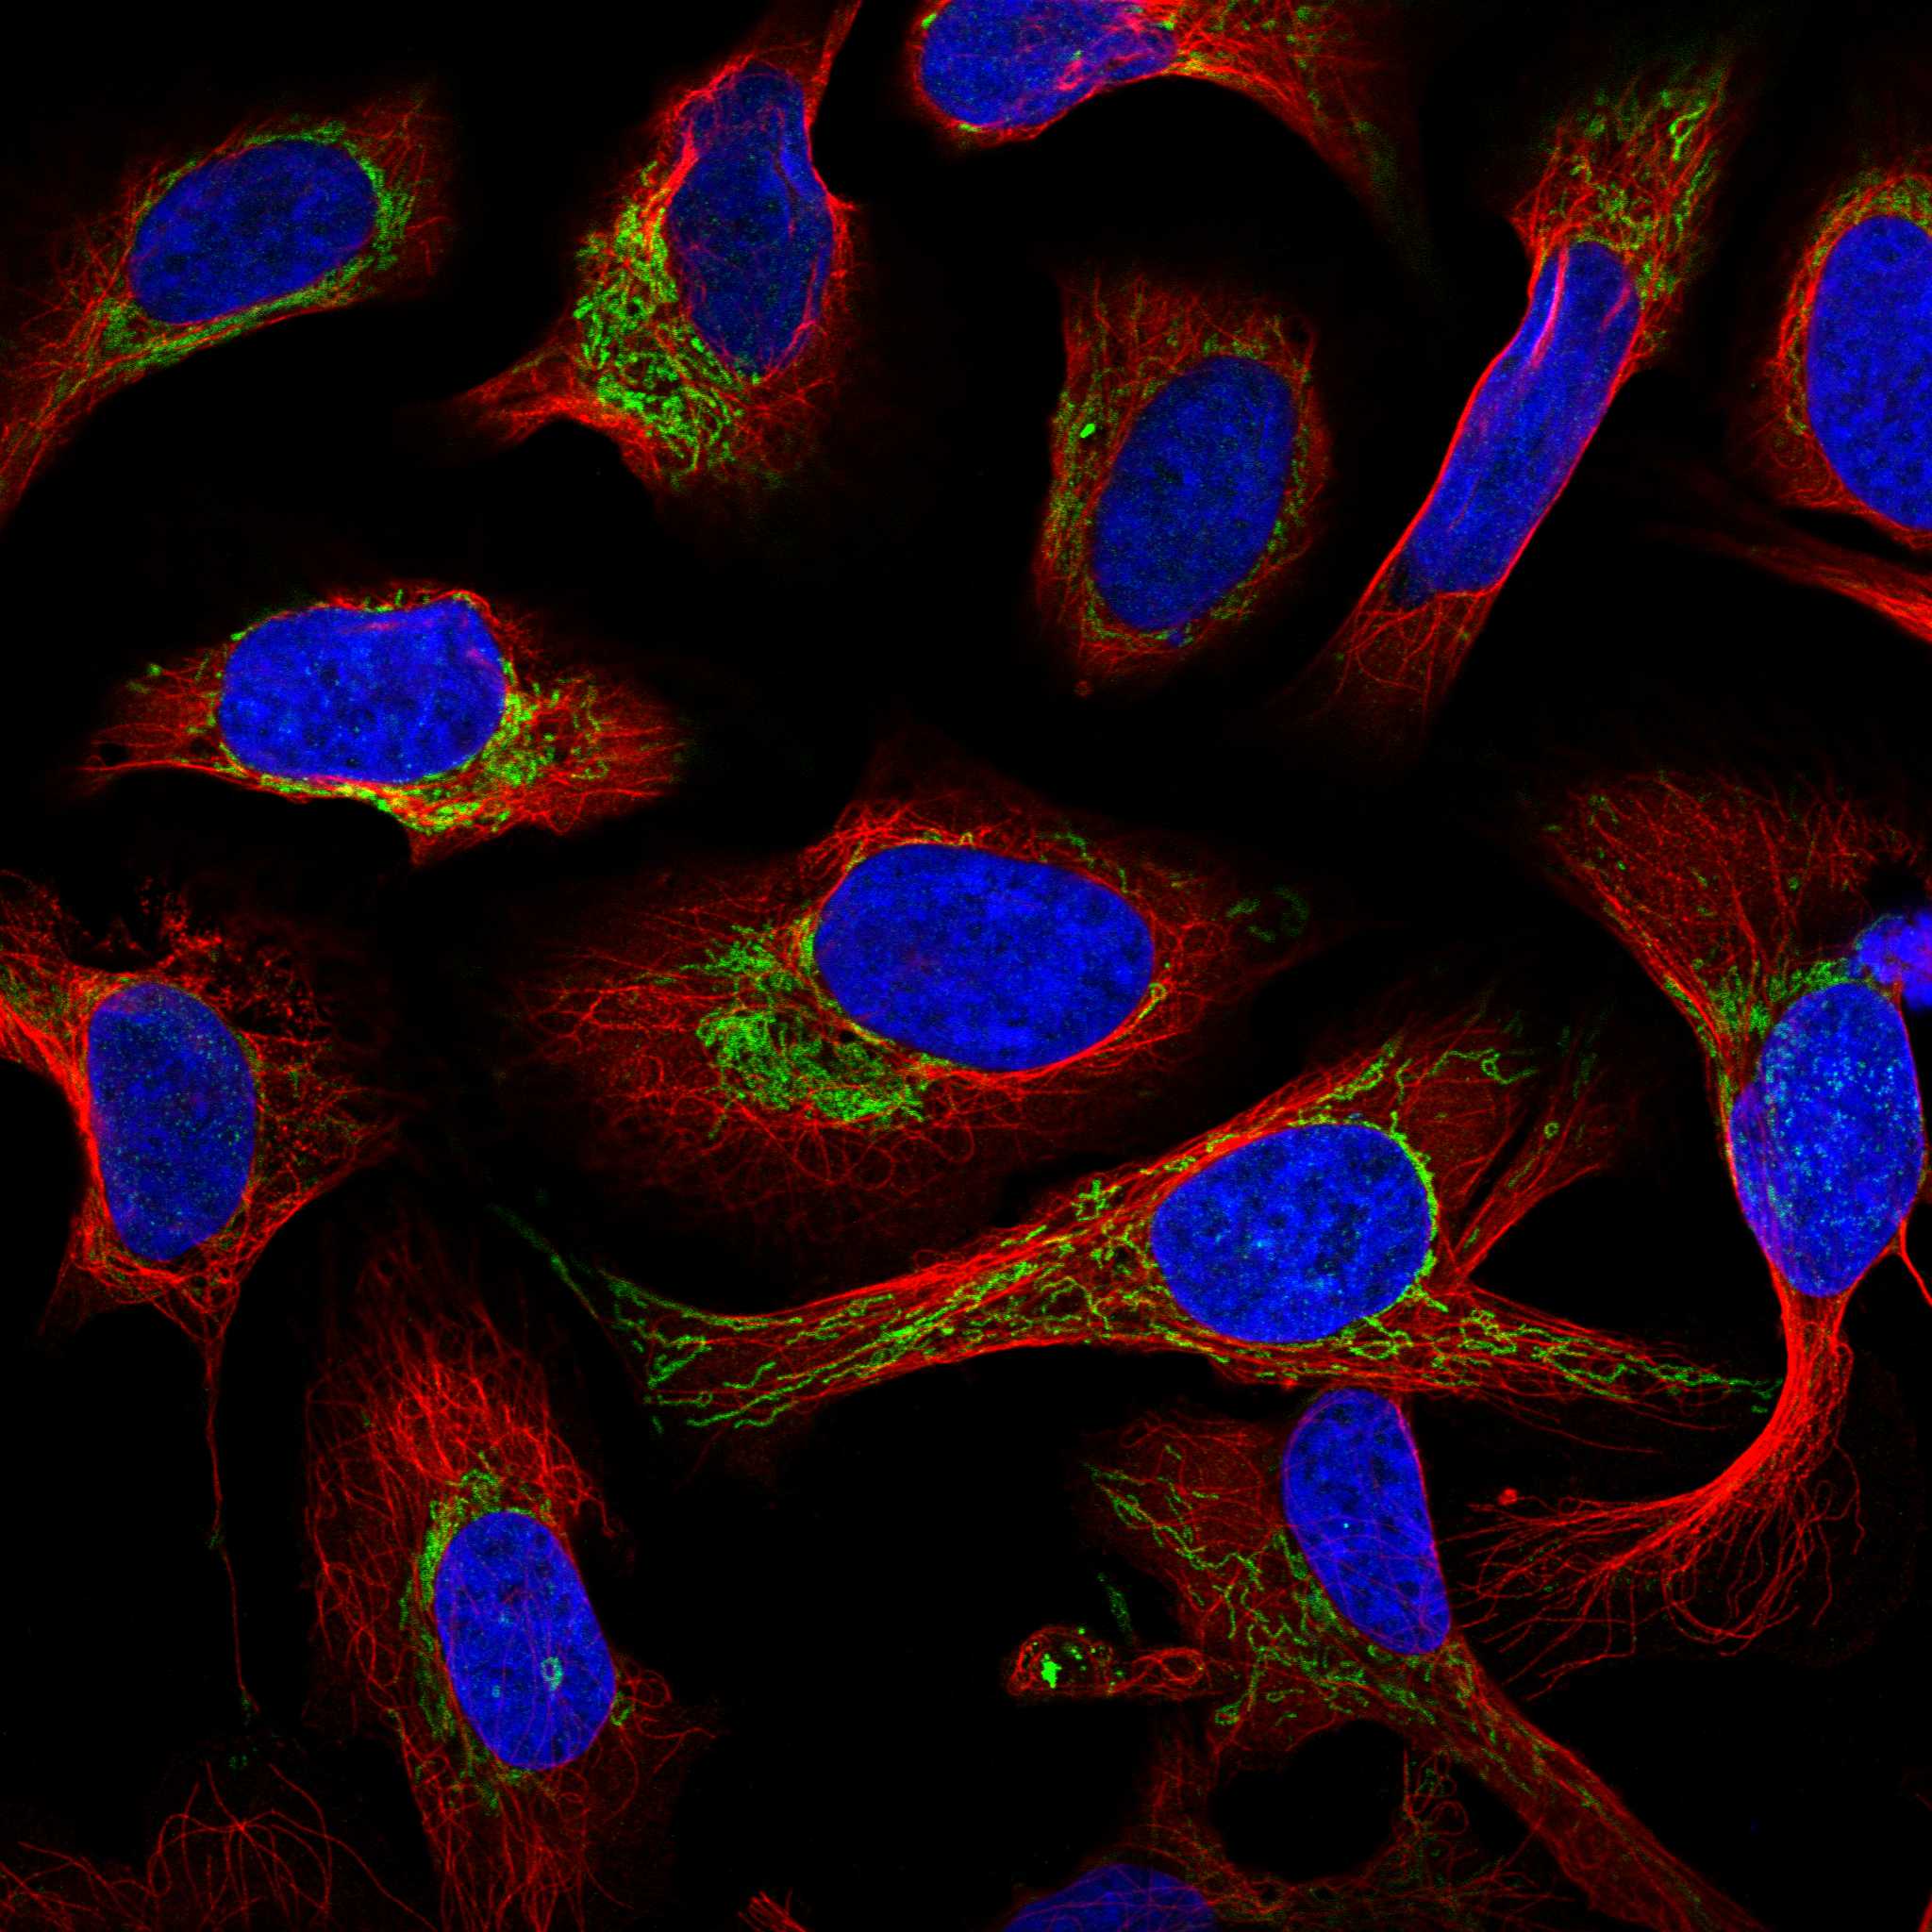
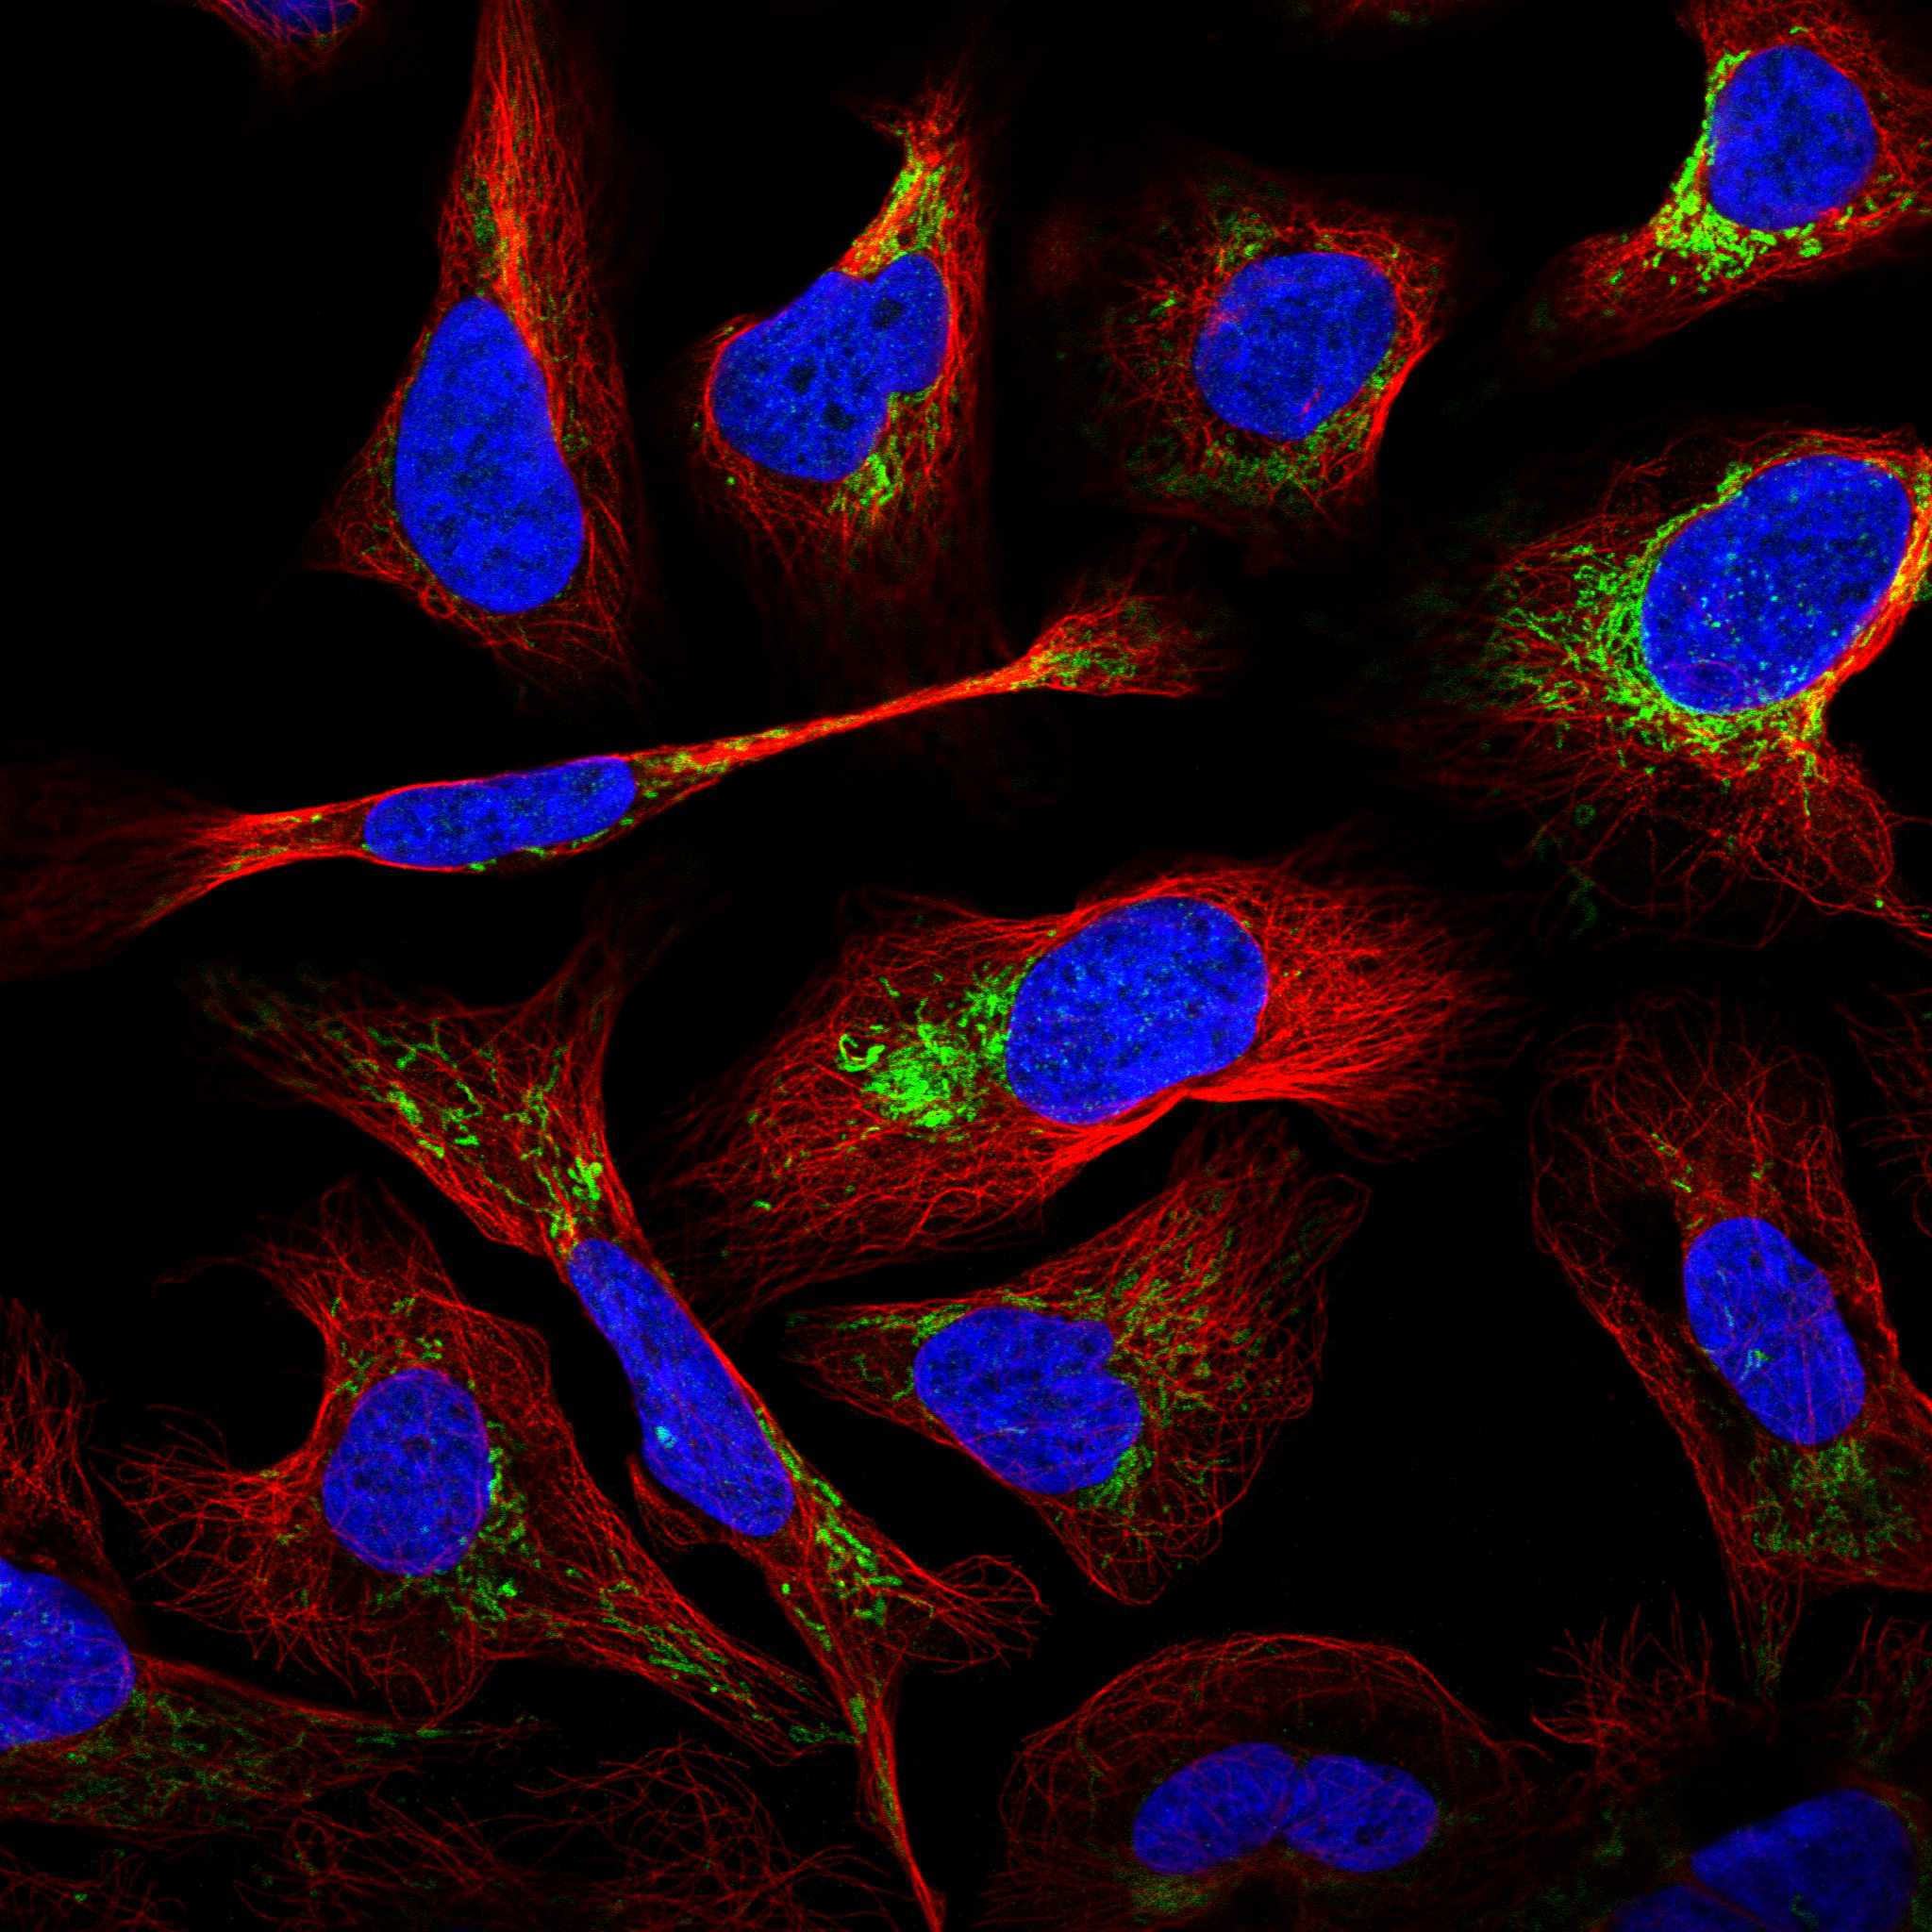
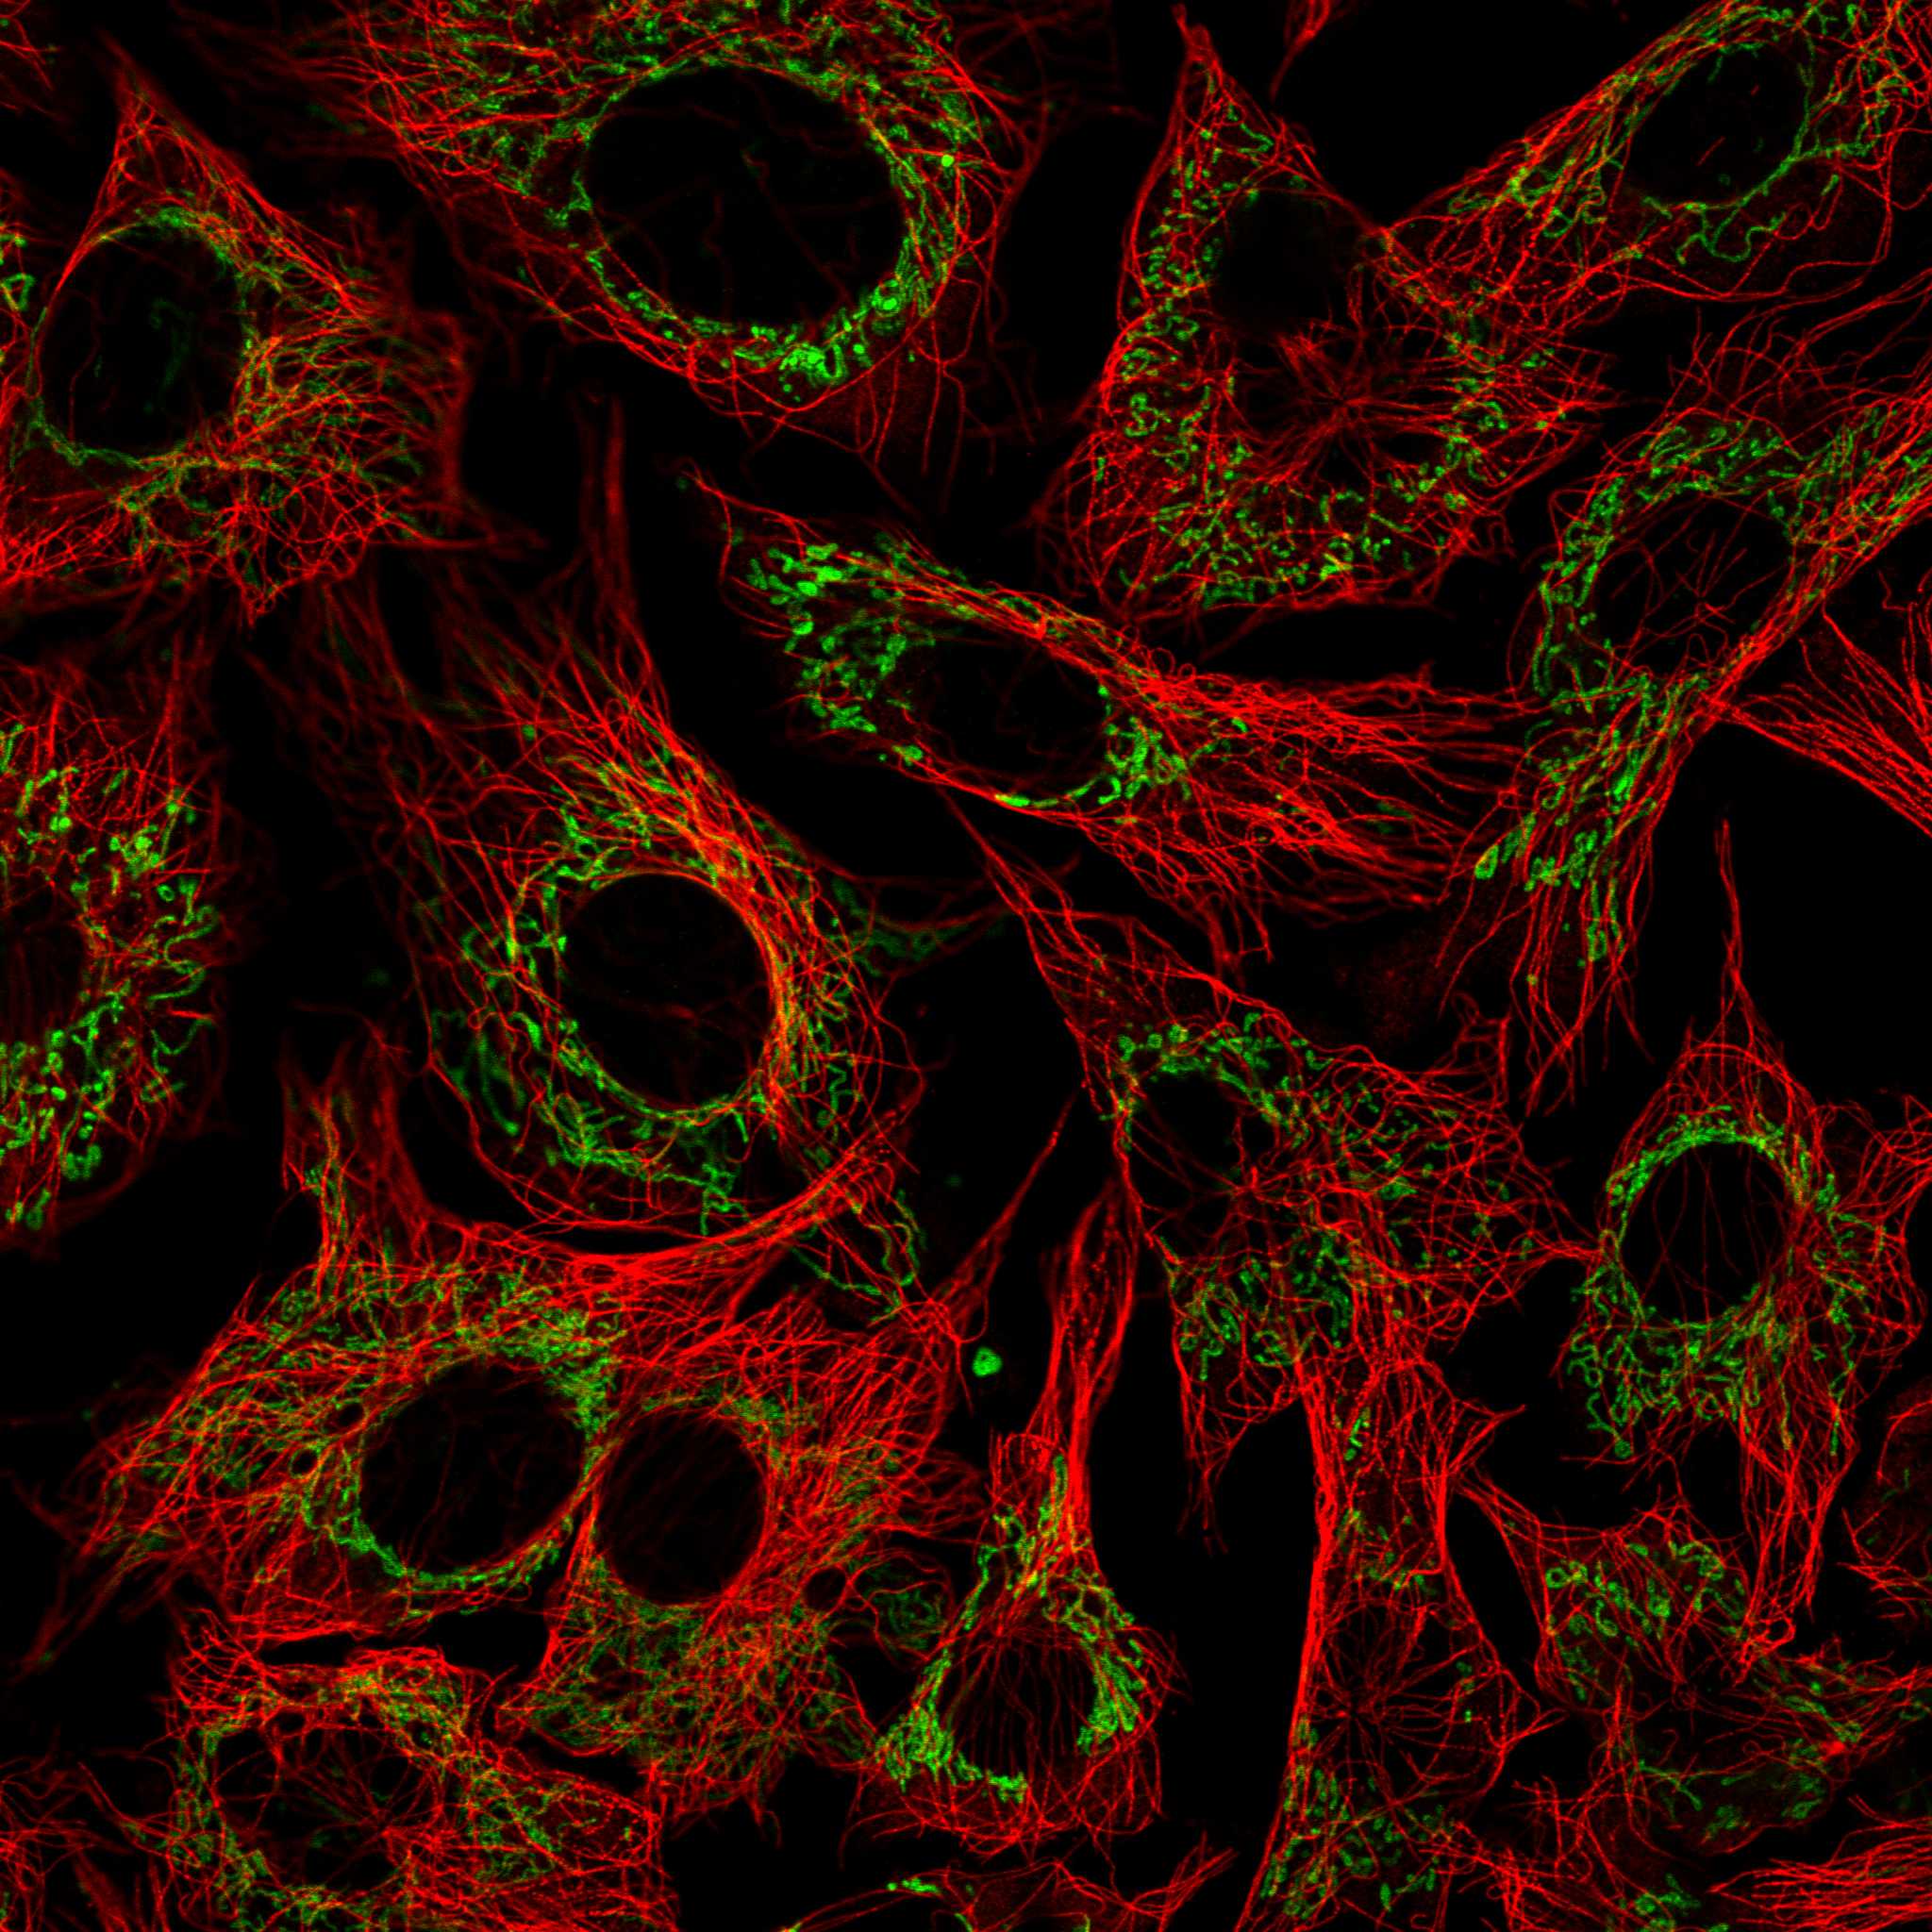
The "human cells" section gives an overview about the subcellular location of the protein of interest obtained by indirect immunofluorescence microscopy, an antibody-based protein-visualization technique. The immunofluorescent analysis is carried out in three different cell lines, one of them always being U-2 OS. A selection of immunofluorescent images is displayed below. Three different organelle probes are displayed as different channels in the multicolor images - nucleus stained in blue, microtubules in red and ER in yellow. The antibody staining targeting the protein of interest is shown in green. By using the toggle channel buttons, the different channels can be turned on and off. For the selection of the images to compare, use the checkboxes next to the images at the bottom. Three images can be compared at a time. All images are clickable for an enlarged view. The selected image will appear in large size and miniature images with all other staining results for this gene will be listed at the top left of the image. The selected miniature image has an orange overlay. For cell structure reference, visit the cell dictionary.
Summaryi
Summary of the immunofluorescent analysis in all studied cell lines with all tested antibodies.
Localized to the mitochondria.
Main locationi
The main location is characterized by presence in all tested cell lines and/or increased intensity compared to other locations.
Mitochondria (enhanced)
Toggle channelsi
Three different organelle probes are displayed as different channels in the multicolor images - nucleus stained in blue, microtubules in red and ER in yellow. The antibody staining targeting the protein of interest is shown in green. By using the "toggle channels"-buttons, the different channels can be turned on and off. The intensity toggle shows the pixel intensity range in 16 different colors for the selected channel. The object toggle shows the computational segmentation of the cells used for further analysis in the HPA project. For samples where cell cycle dependency for the protein is suggested according to a correlation assay the predicted cell cycle position of each cell is displayed when using the object toggle.
Low
High
G1
S
G2
M
N/A
Thumbnaili
Representative images for the assay. Three images can be compared at the same time. To change which images to compare, use the checkboxes next to the images below. All images are clickable for an enlarged view. The selected image will appear in large size and miniature images with all other staining results for this gene will be listed at the top left of the image. The selected miniature image has an orange overlay.
Antibodyi
Antibody used for analysis. Clicking the antibody ID links to the antibody validation page.
Cell linei
Cell line used for analysis. Read more about the cell lines in the Human Protein Atlas.
Locationi
Location(s) annotated in the corresponding cell line.
Single-cell variationi
As the images in the Cell Atlas provide single cell resolution, variations in protein expression patterns from cell to cell can be observed. A single-cell variation can either be observed in the intensity of the immunofluorescent signal or in the spatial distribution pattern of the protein. This column contains information about whether and for which of the annotated locations a single-cell variation pattern was manually annotated.
Cell cycle dependent variationi
A likely cause for single-cell variation in the immunofluorescent images is cell cycle dependency. This column contains information about whether the manually observed cell-to-cell variation pattern correlates with cell cycle progression.
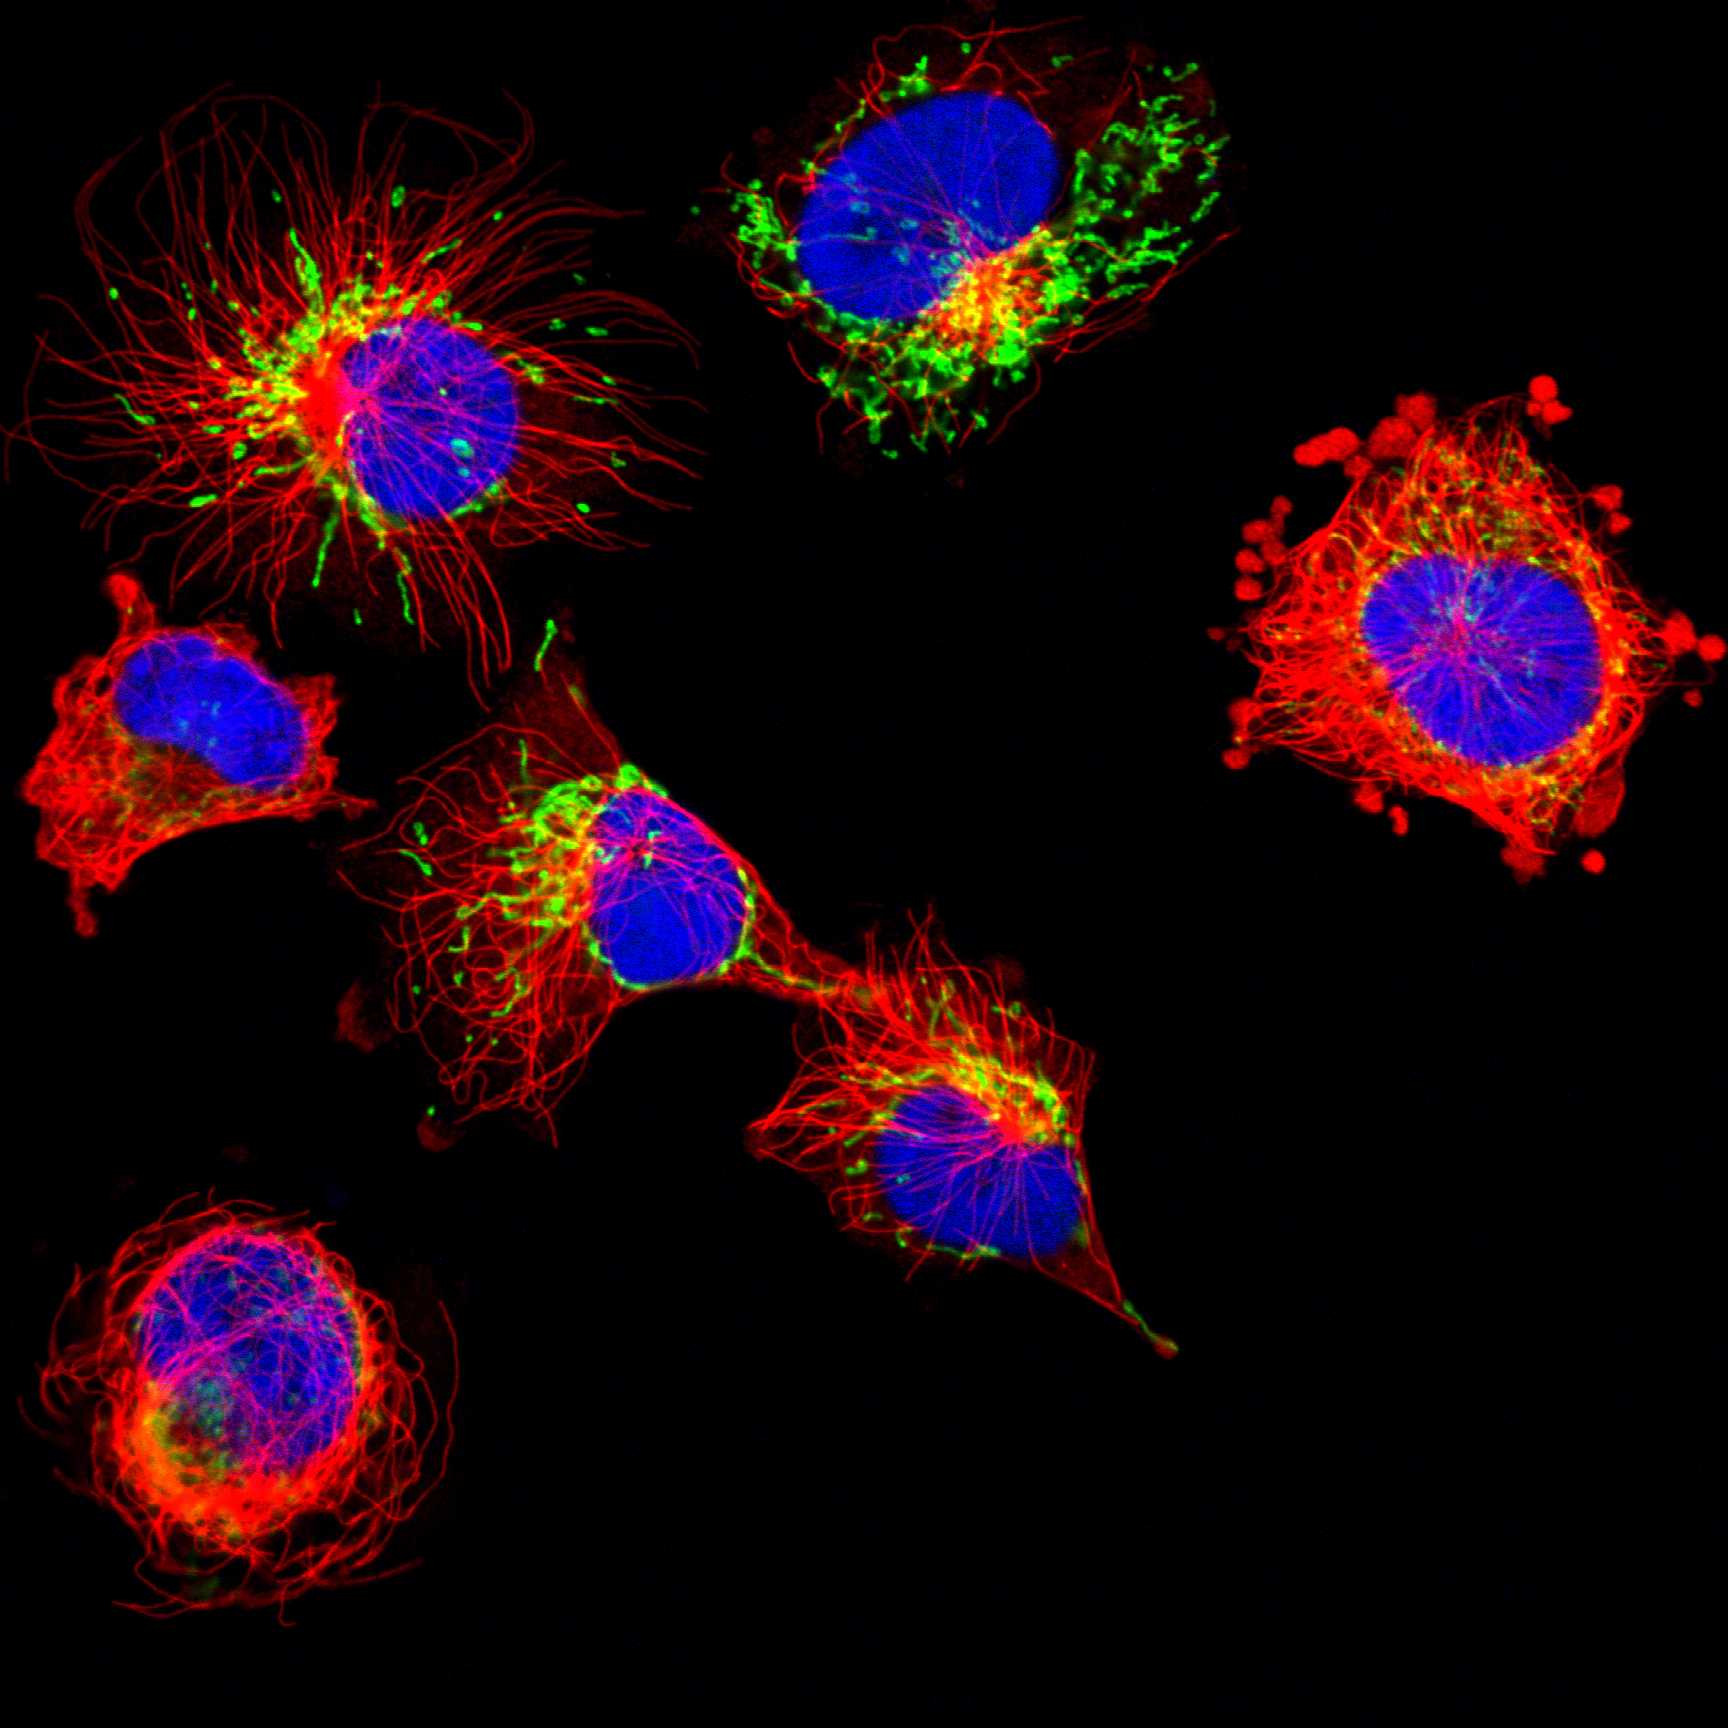
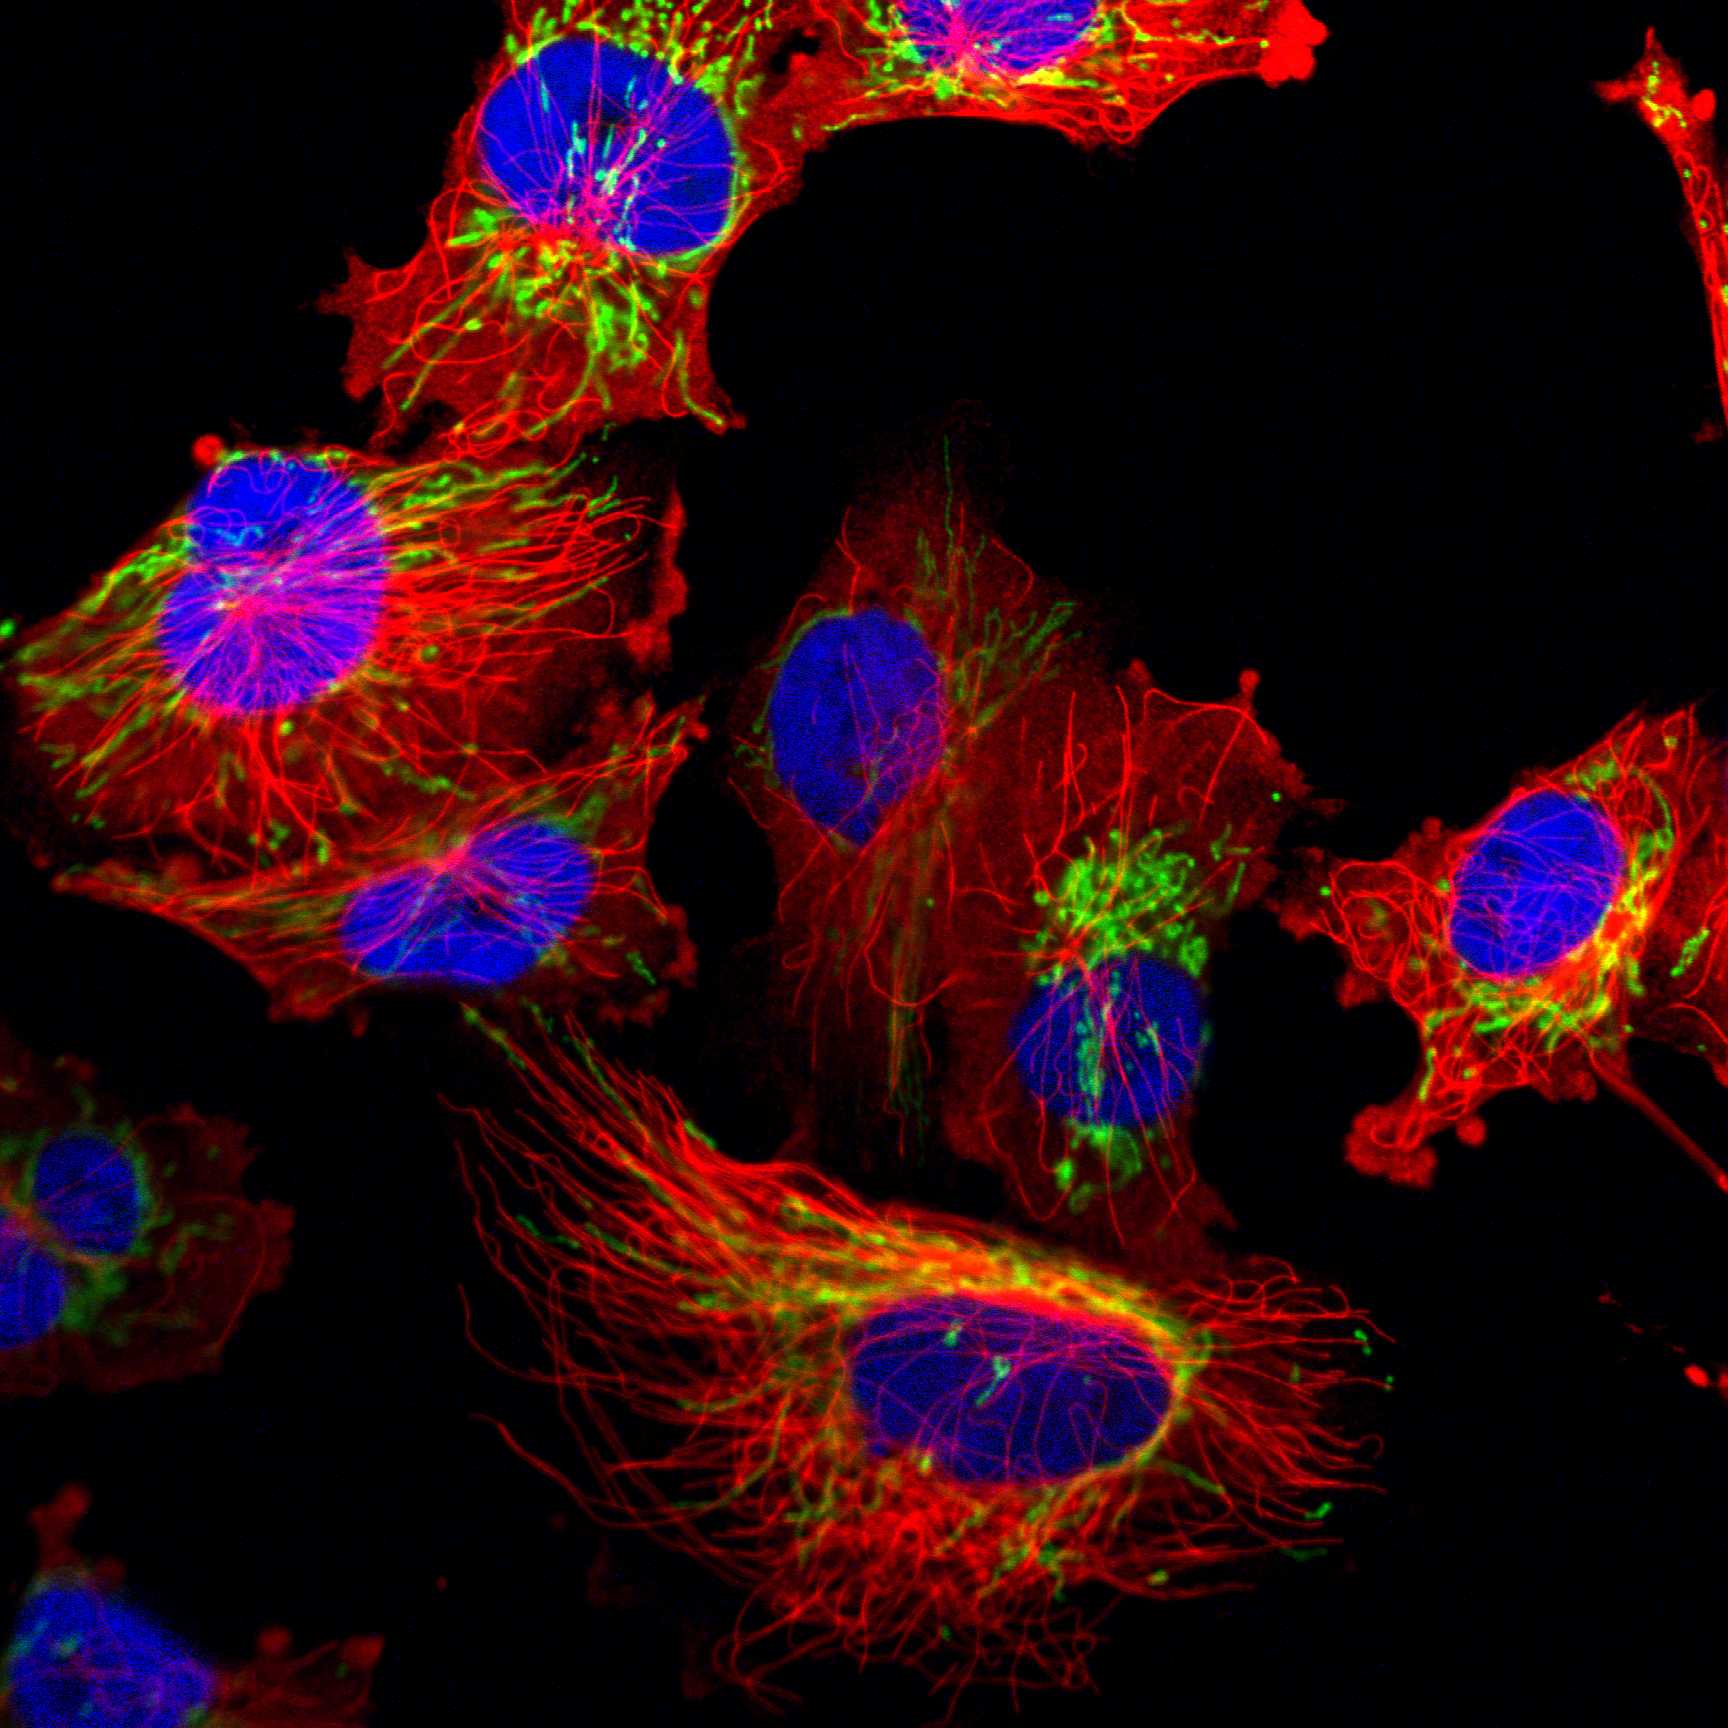
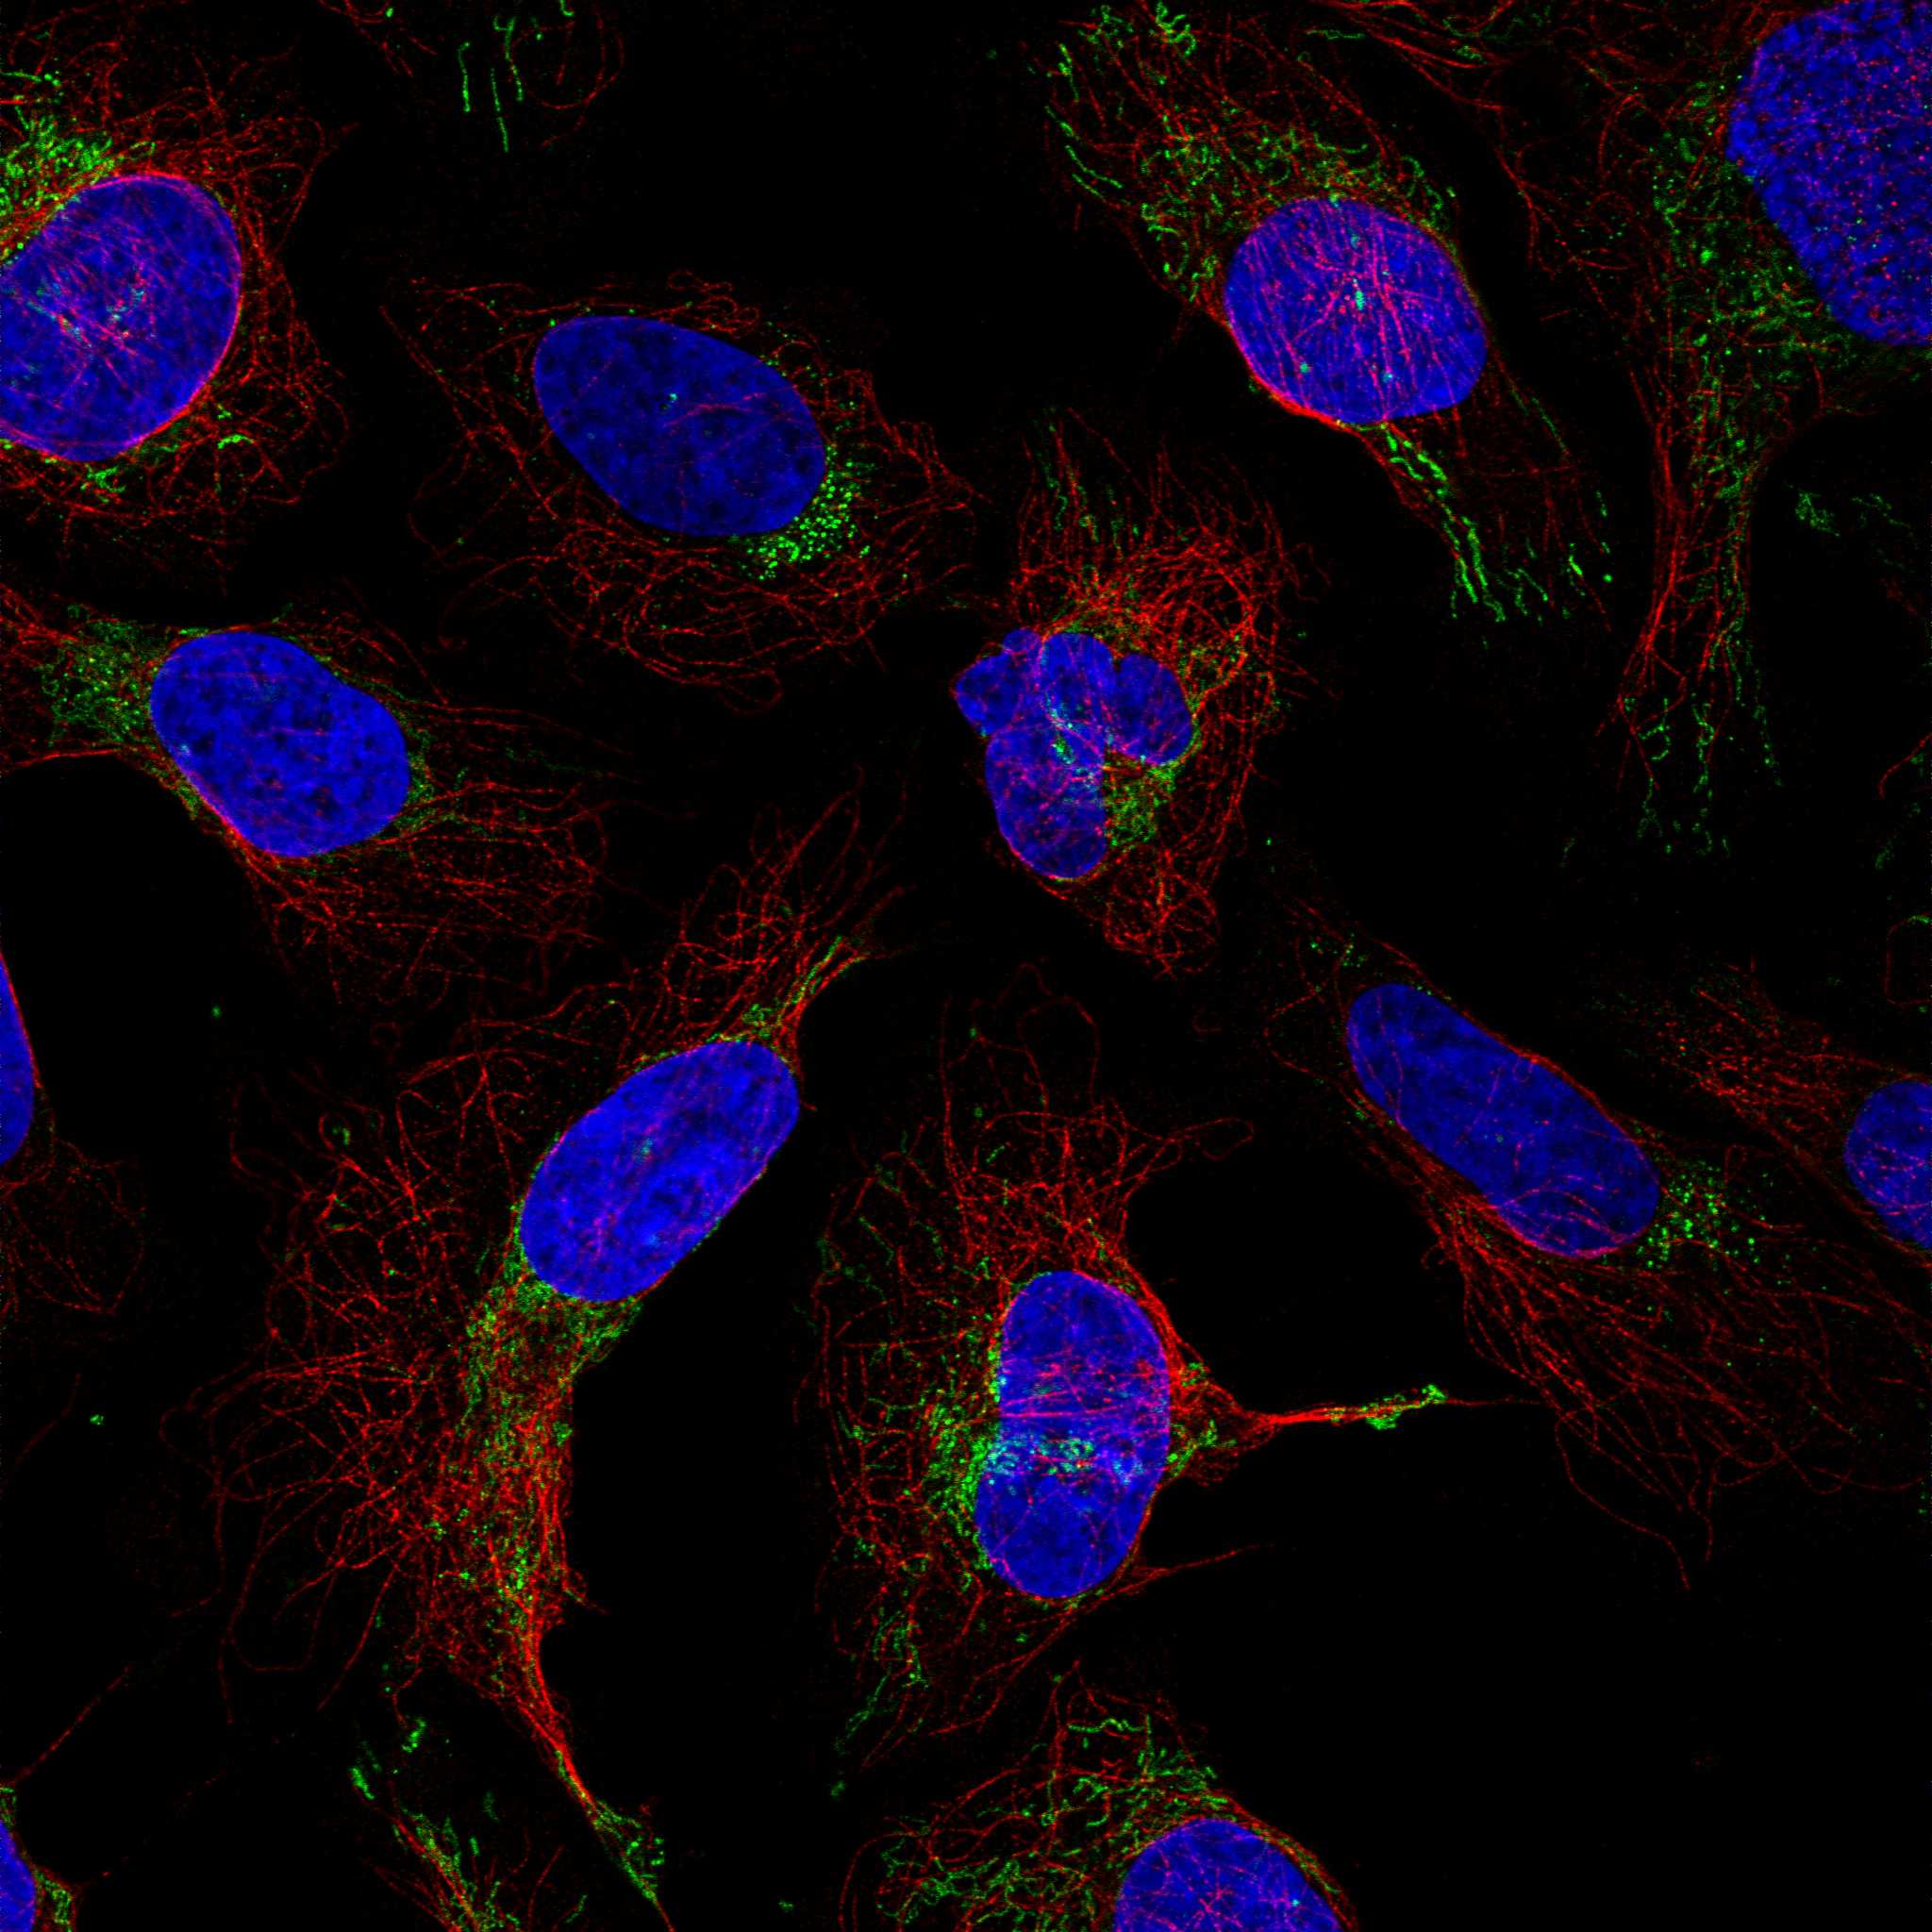
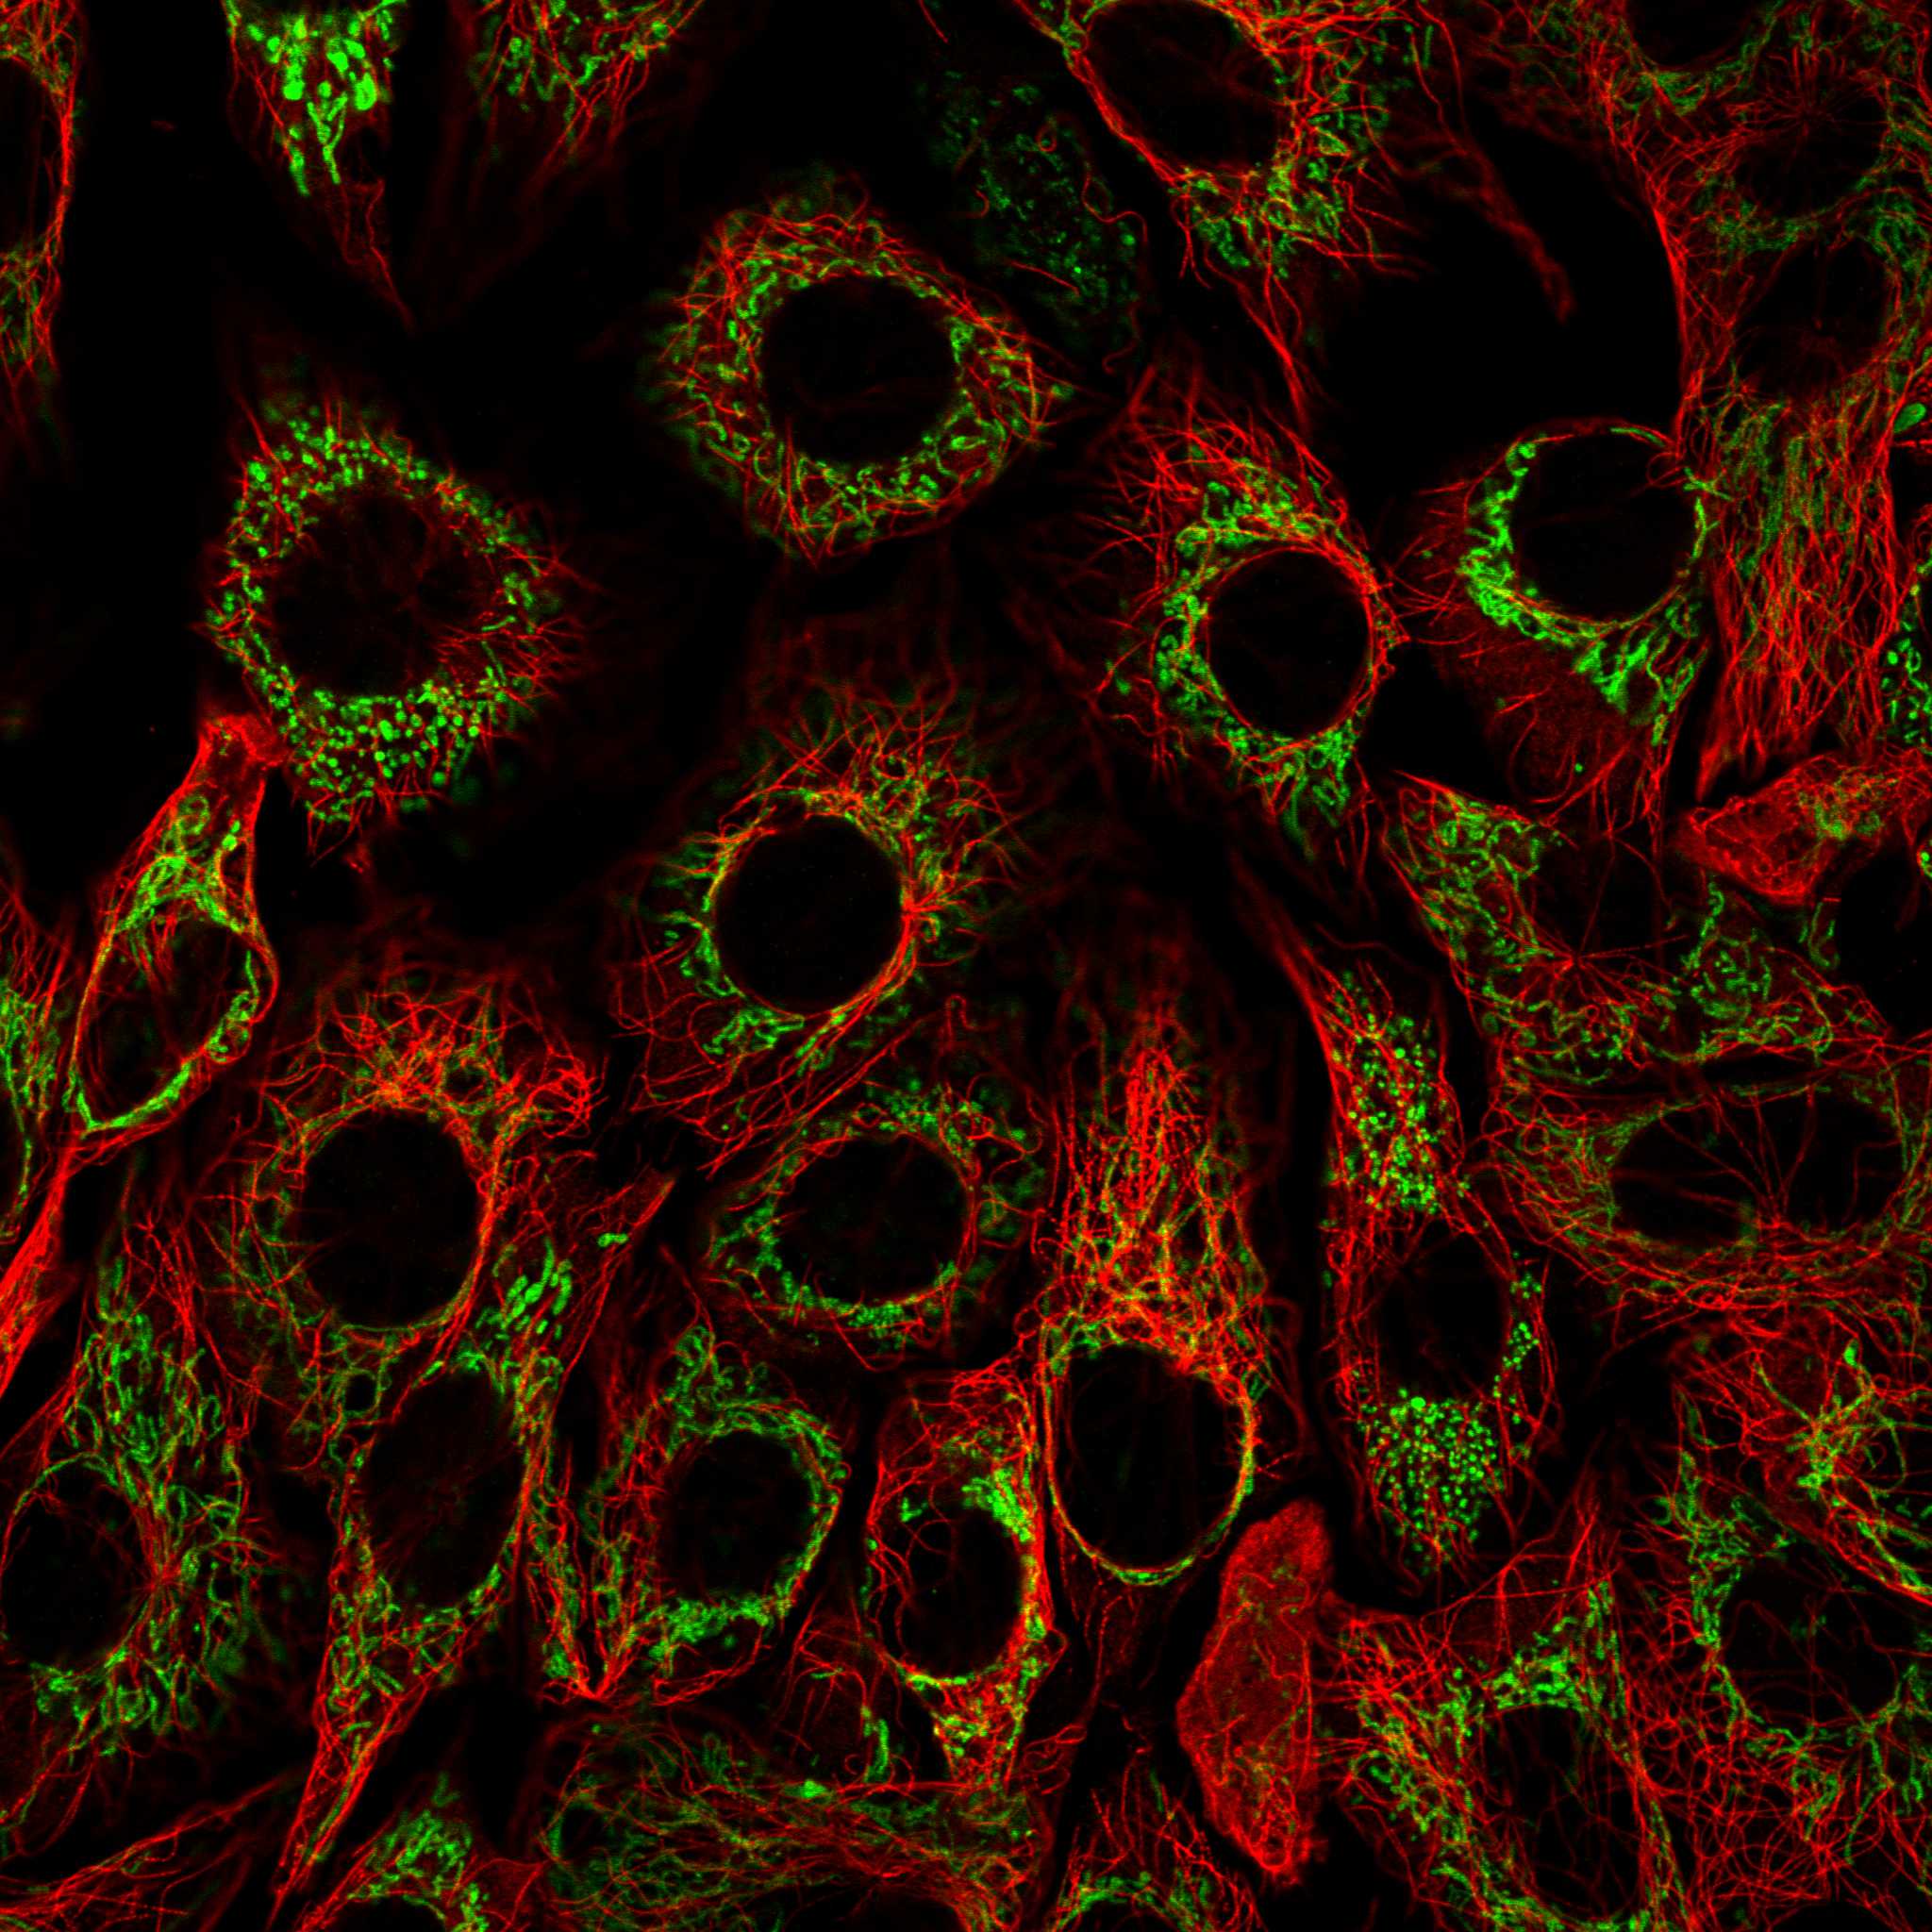
For the genes where the mouse and human genes are orthologues, the mouse cell line NIH 3T3 is also stained. The main subcellular location of the encoded proteins and any additional locations are reported as well as staining characteristics, staining intensity and validation score. Example images are shown below. To change which images to compare, use the checkboxes next to the images at the bottom. Three images can be compared at a time. All images are clickable for an enlarged view. The selected image will appear in large size and miniature images with all other staining results for this gene will be listed at the top left of the image. The selected miniature image has an orange overlay. For cell structure reference, visit the cell dictionary.
Main locationi
The main location is characterized by a higher intensity compared to other locations observed.
Three different organelle probes are displayed as different channels in the multicolor images - nucleus stained in blue, microtubules in red and ER in yellow. The HPA-antibody staining targeting the protein of interest is shown in green. By using the "toggle channels"-buttons, the different channels can be turned on and off. The intensity toggle shows the pixel intensity range in 16 different colors for the selected channel. The object toggle shows the computational segmentation of the cells used for further analysis in the HPA project. For samples where cell cycle dependency for the protein is suggested according to a correlation assay the predicted cell cycle position of each cell is displayed when using the object toggle.
Low
High
G1
S
G2
M
N/A
Thumbnaili
Representative images for the assay. Three images can be compared at the same time. To change which images to compare, use the checkboxes next to the images below. All images are clickable for an enlarged view. The selected image will appear in large size and miniature images with all other staining results for this gene will be listed at the top left of the image. The selected miniature image has an orange overlay.
Antibodyi
Antibody used for analysis. Clicking the antibody ID links to the antibody validation page.
Cell linei
Cell line used for analysis. Read more about the cell lines in the Human Protein Atlas.
Locationi
Location(s) annotated in the corresponding cell line.
Gene information from Ensembl and Entrez, as well as links to available gene identifiers are displayed here. Information was retrieved from Ensembl if not indicated otherwise.
Gene name
HSPD1 (HGNC Symbol)
Synonyms
GroEL, HSP60, SPG13
Description
Heat shock protein family D (Hsp60) member 1 (HGNC Symbol)
Entrez gene summary
This gene encodes a member of the chaperonin family. The encoded mitochondrial protein may function as a signaling molecule in the innate immune system. This protein is essential for the folding and assembly of newly imported proteins in the mitochondria. This gene is adjacent to a related family member and the region between the 2 genes functions as a bidirectional promoter. Several pseudogenes have been associated with this gene. Two transcript variants encoding the same protein have been identified for this gene. Mutations associated with this gene cause autosomal recessive spastic paraplegia 13. [provided by RefSeq, Jun 2010]
The protein browser displays the antigen location on the target protein(s) and the features of the target protein. The tabs at the top of the protein view section can be used to switch between the different splice variants to which an antigen has been mapped.
At the top of the view, the position of the antigen (identified by the corresponding HPA identifier) is shown as a green bar. A yellow triangle on the bar indicates a <100% sequence identity to the protein target.
Under the antigens, the maximum percent sequence identity of the protein to all other proteins from other human genes is displayed, using a sliding window of 10 aa residues (HsID 10) or 50 aa residues (HsID 50). The region with the lowest possible identity is always selected for antigen design, with a maximum identity of 60% allowed for designing a single-target antigen (read more).
The curve in blue displays the predicted antigenicity i.e. the tendency for different regions of the protein to generate an immune response, with peak regions being predicted to be more antigenic.The curve shows average values based on a sliding window approach using an in-house propensity scale. (read more).
If a signal peptide is predicted by a majority of the signal peptide predictors SPOCTOPUS, SignalP 4.0, and Phobius (turquoise) and/or transmembrane regions (orange) are predicted by MDM, these are displayed.
Low complexity regions are shown in yellow and InterPro regions in green. Common (purple) and unique (grey) regions between different splice variants of the gene are also displayed (read more), and at the bottom of the protein view is the protein scale.
HSPD1-001
HSPD1-006
HSPD1-009
HSPD1-010
HSPD1-011
HSPD1-012
HSPD1-013
HSPD1-201
PROTEIN INFORMATIONi
The protein information section displays alternative protein-coding transcripts (splice variants) encoded by this gene according to the Ensembl database.
The ENSP identifier links to the Ensembl website protein summary, while the ENST identifier links to the Ensembl website transcript summary for the selected splice variant. The data in the UniProt column can be expanded to show links to all matching UniProt identifiers for this protein.
The protein classes assigned to this protein are shown if expanding the data in the protein class column. Parent protein classes are in bold font and subclasses are listed under the parent class.
The Gene Ontology terms assigned to this protein are listed if expanding the Gene ontology column. The length of the protein (amino acid residues according to Ensembl), molecular mass (kDalton), predicted signal peptide (according to a majority of the signal peptide predictors SPOCTOPUS, SignalP 4.0, and Phobius) and the number of predicted transmembrane region(s) (according to MDM) are also reported.
Enzymes ENZYME proteins Hydrolases Predicted intracellular proteins Plasma proteins Cancer-related genes Candidate cancer biomarkers Disease related genes Potential drug targets Protein evidence (Kim et al 2014) Protein evidence (Ezkurdia et al 2014)
Show all
GO:0000166 [nucleotide binding] GO:0001530 [lipopolysaccharide binding] GO:0001666 [response to hypoxia] GO:0002020 [protease binding] GO:0002039 [p53 binding] GO:0002236 [detection of misfolded protein] GO:0002368 [B cell cytokine production] GO:0002755 [MyD88-dependent toll-like receptor signaling pathway] GO:0002842 [positive regulation of T cell mediated immune response to tumor cell] GO:0002931 [response to ischemia] GO:0003688 [DNA replication origin binding] GO:0003697 [single-stranded DNA binding] GO:0003723 [RNA binding] GO:0003725 [double-stranded RNA binding] GO:0005515 [protein binding] GO:0005524 [ATP binding] GO:0005615 [extracellular space] GO:0005737 [cytoplasm] GO:0005739 [mitochondrion] GO:0005743 [mitochondrial inner membrane] GO:0005759 [mitochondrial matrix] GO:0005769 [early endosome] GO:0005782 [peroxisomal matrix] GO:0005791 [rough endoplasmic reticulum] GO:0005794 [Golgi apparatus] GO:0005829 [cytosol] GO:0005886 [plasma membrane] GO:0005905 [clathrin-coated pit] GO:0006357 [regulation of transcription from RNA polymerase II promoter] GO:0006457 [protein folding] GO:0006458 ['de novo' protein folding] GO:0006919 [activation of cysteine-type endopeptidase activity involved in apoptotic process] GO:0006986 [response to unfolded protein] GO:0008637 [apoptotic mitochondrial changes] GO:0009408 [response to heat] GO:0009409 [response to cold] GO:0009986 [cell surface] GO:0010033 [response to organic substance] GO:0014070 [response to organic cyclic compound] GO:0014823 [response to activity] GO:0016020 [membrane] GO:0016032 [viral process] GO:0016787 [hydrolase activity] GO:0016887 [ATPase activity] GO:0019907 [cyclin-dependent protein kinase activating kinase holoenzyme complex] GO:0030061 [mitochondrial crista] GO:0030135 [coated vesicle] GO:0030141 [secretory granule] GO:0031012 [extracellular matrix] GO:0031625 [ubiquitin protein ligase binding] GO:0032403 [protein complex binding] GO:0032496 [response to lipopolysaccharide] GO:0032727 [positive regulation of interferon-alpha production] GO:0032729 [positive regulation of interferon-gamma production] GO:0032733 [positive regulation of interleukin-10 production] GO:0032735 [positive regulation of interleukin-12 production] GO:0032755 [positive regulation of interleukin-6 production] GO:0033198 [response to ATP] GO:0042026 [protein refolding] GO:0042100 [B cell proliferation] GO:0042110 [T cell activation] GO:0042113 [B cell activation] GO:0042220 [response to cocaine] GO:0042493 [response to drug] GO:0042542 [response to hydrogen peroxide] GO:0042588 [zymogen granule] GO:0043032 [positive regulation of macrophage activation] GO:0043065 [positive regulation of apoptotic process] GO:0043066 [negative regulation of apoptotic process] GO:0043209 [myelin sheath] GO:0043231 [intracellular membrane-bounded organelle] GO:0043234 [protein complex] GO:0043524 [negative regulation of neuron apoptotic process] GO:0043559 [insulin binding] GO:0043627 [response to estrogen] GO:0044183 [protein binding involved in protein folding] GO:0045041 [protein import into mitochondrial intermembrane space] GO:0045121 [membrane raft] GO:0046696 [lipopolysaccharide receptor complex] GO:0046982 [protein heterodimerization activity] GO:0048291 [isotype switching to IgG isotypes] GO:0050729 [positive regulation of inflammatory response] GO:0050821 [protein stabilization] GO:0050870 [positive regulation of T cell activation] GO:0051082 [unfolded protein binding] GO:0051085 [chaperone mediated protein folding requiring cofactor] GO:0051087 [chaperone binding] GO:0051131 [chaperone-mediated protein complex assembly] GO:0051384 [response to glucocorticoid] GO:0051604 [protein maturation] GO:0051787 [misfolded protein binding] GO:0061077 [chaperone-mediated protein folding] GO:0070062 [extracellular exosome] GO:0071866 [negative regulation of apoptotic process in bone marrow] GO:1903427 [negative regulation of reactive oxygen species biosynthetic process] GO:1904469 [positive regulation of tumor necrosis factor secretion] GO:2000778 [positive regulation of interleukin-6 secretion]
Enzymes ENZYME proteins Hydrolases Predicted intracellular proteins Plasma proteins Cancer-related genes Candidate cancer biomarkers Disease related genes Potential drug targets Protein evidence (Kim et al 2014) Protein evidence (Ezkurdia et al 2014)
Show all
GO:0000166 [nucleotide binding] GO:0001530 [lipopolysaccharide binding] GO:0002039 [p53 binding] GO:0002368 [B cell cytokine production] GO:0002755 [MyD88-dependent toll-like receptor signaling pathway] GO:0002842 [positive regulation of T cell mediated immune response to tumor cell] GO:0003688 [DNA replication origin binding] GO:0003697 [single-stranded DNA binding] GO:0003723 [RNA binding] GO:0003725 [double-stranded RNA binding] GO:0005515 [protein binding] GO:0005524 [ATP binding] GO:0005615 [extracellular space] GO:0005737 [cytoplasm] GO:0005739 [mitochondrion] GO:0005743 [mitochondrial inner membrane] GO:0005759 [mitochondrial matrix] GO:0005769 [early endosome] GO:0005829 [cytosol] GO:0005905 [clathrin-coated pit] GO:0006357 [regulation of transcription from RNA polymerase II promoter] GO:0006457 [protein folding] GO:0006458 ['de novo' protein folding] GO:0006919 [activation of cysteine-type endopeptidase activity involved in apoptotic process] GO:0006986 [response to unfolded protein] GO:0008637 [apoptotic mitochondrial changes] GO:0009409 [response to cold] GO:0009986 [cell surface] GO:0016020 [membrane] GO:0016032 [viral process] GO:0016787 [hydrolase activity] GO:0016887 [ATPase activity] GO:0019907 [cyclin-dependent protein kinase activating kinase holoenzyme complex] GO:0030135 [coated vesicle] GO:0030141 [secretory granule] GO:0031012 [extracellular matrix] GO:0031625 [ubiquitin protein ligase binding] GO:0032727 [positive regulation of interferon-alpha production] GO:0032729 [positive regulation of interferon-gamma production] GO:0032733 [positive regulation of interleukin-10 production] GO:0032735 [positive regulation of interleukin-12 production] GO:0032755 [positive regulation of interleukin-6 production] GO:0042026 [protein refolding] GO:0042100 [B cell proliferation] GO:0042110 [T cell activation] GO:0042113 [B cell activation] GO:0043032 [positive regulation of macrophage activation] GO:0043065 [positive regulation of apoptotic process] GO:0043066 [negative regulation of apoptotic process] GO:0043234 [protein complex] GO:0044183 [protein binding involved in protein folding] GO:0045041 [protein import into mitochondrial intermembrane space] GO:0046696 [lipopolysaccharide receptor complex] GO:0048291 [isotype switching to IgG isotypes] GO:0050821 [protein stabilization] GO:0050870 [positive regulation of T cell activation] GO:0051082 [unfolded protein binding] GO:0051087 [chaperone binding] GO:0051131 [chaperone-mediated protein complex assembly] GO:0051604 [protein maturation] GO:0061077 [chaperone-mediated protein folding] GO:0070062 [extracellular exosome]
 The Human Protein Atlas project is funded


 MENU
MENU