We use cookies to enhance the usability of our website. If you continue, we'll assume that you are happy to receive all cookies. More information. Don't show this again.
The protein expression bar, with the units not detected (n), low (l), medium (m) and high (h), is based on a best estimate of the true protein expression for proteins where the antibody staining pattern has been analyzed by knowledge-based annotation. For genes where more than one antibody has been used, a collective score is set. For details, see Assays & annotation.
h
m
l
n
RNA expressioni
RNA expression shows average values based on RNA-seq data generated by HPA, the Genotype-Tissue Expression (GTEx) consortium or the FANTOM5 consortium.
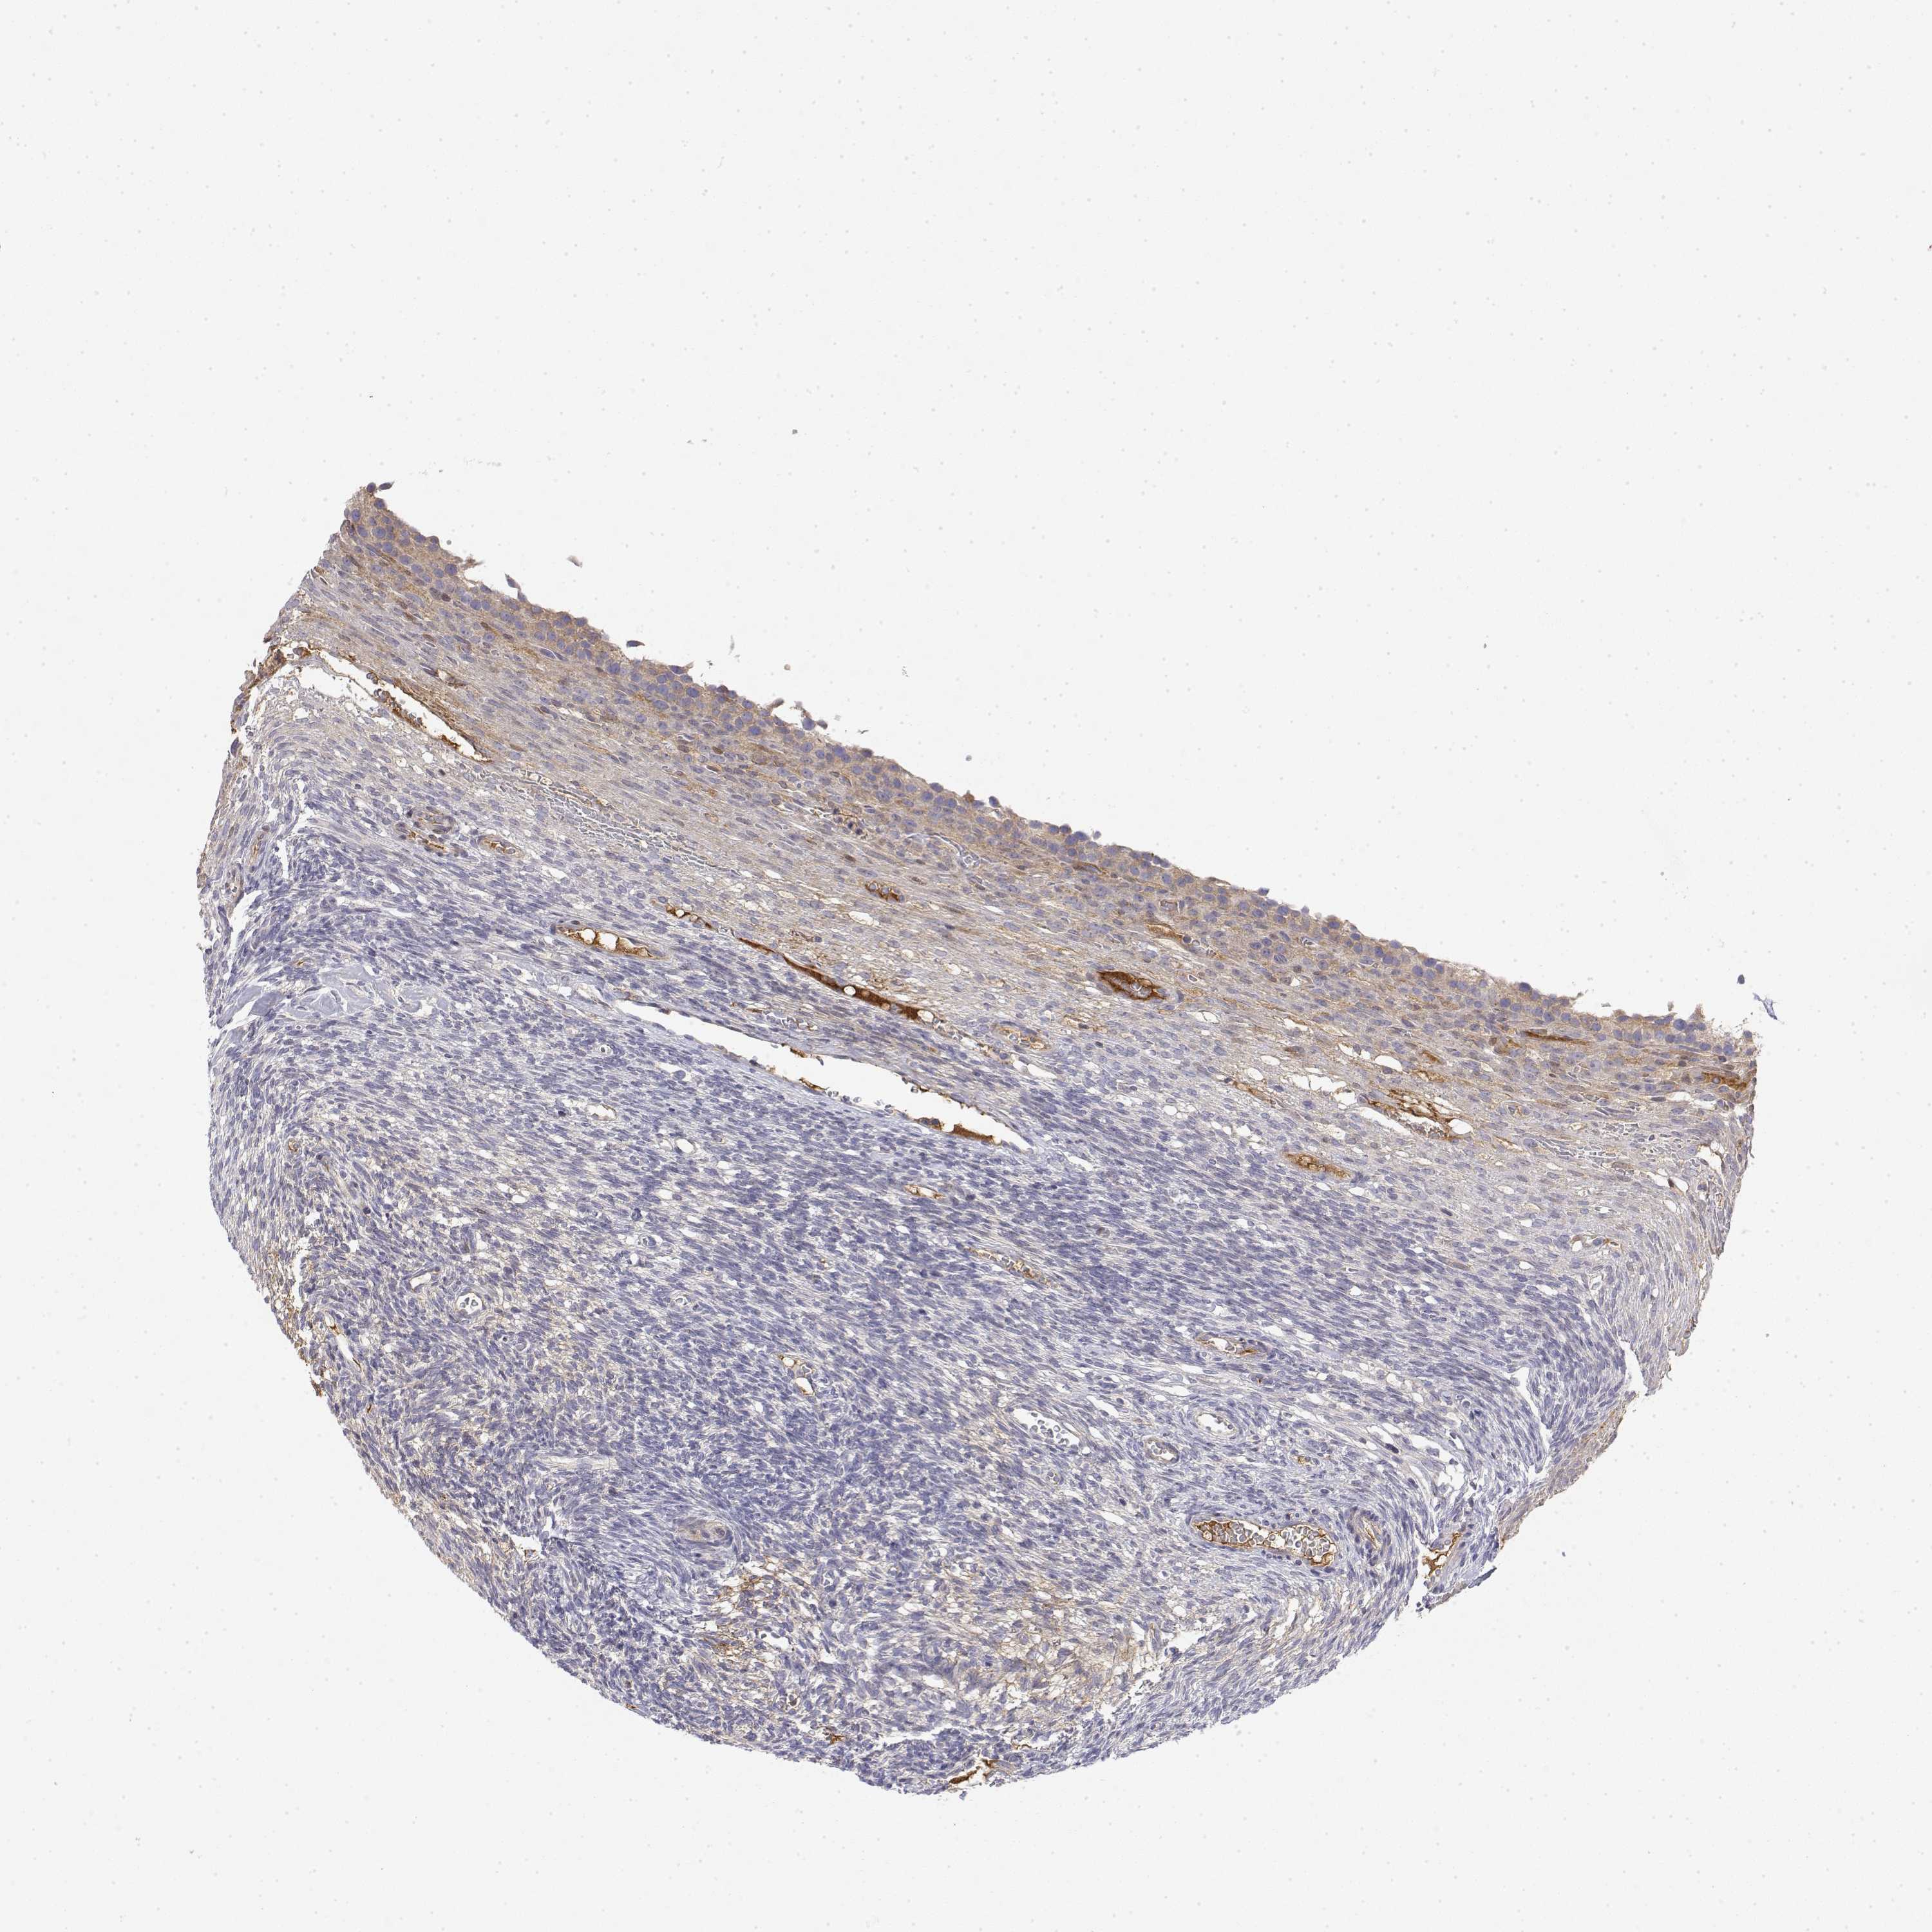
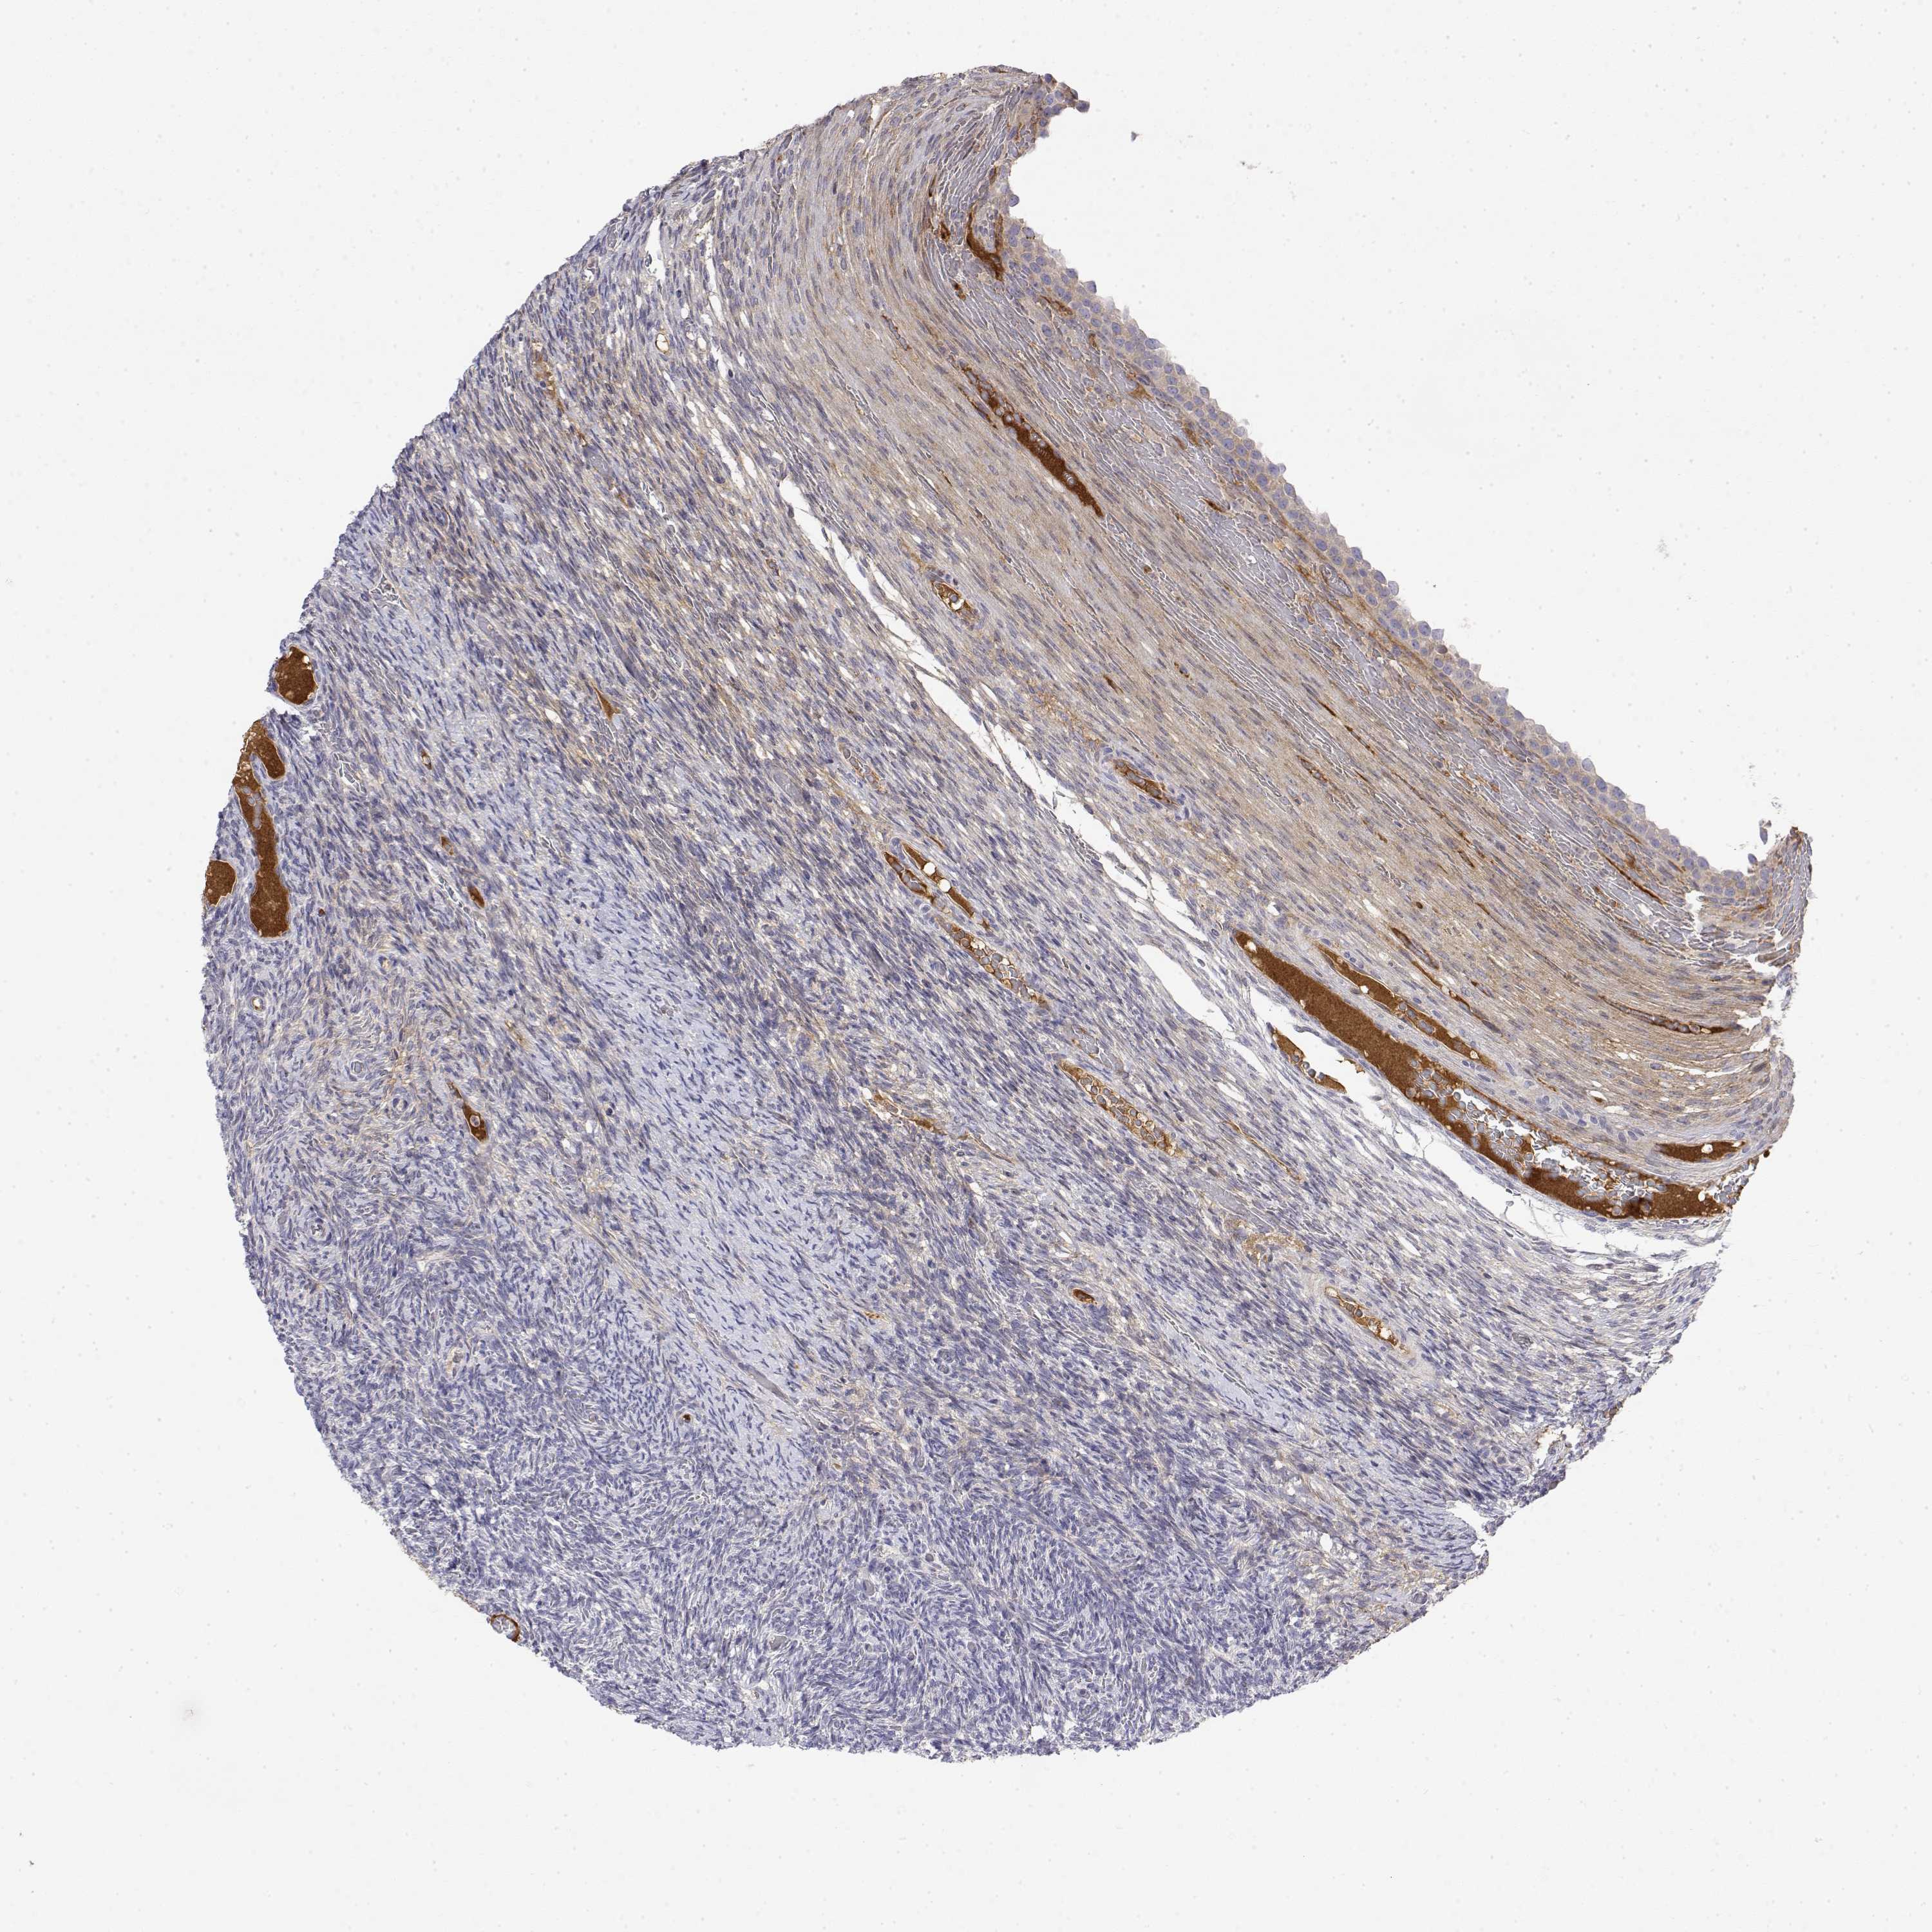
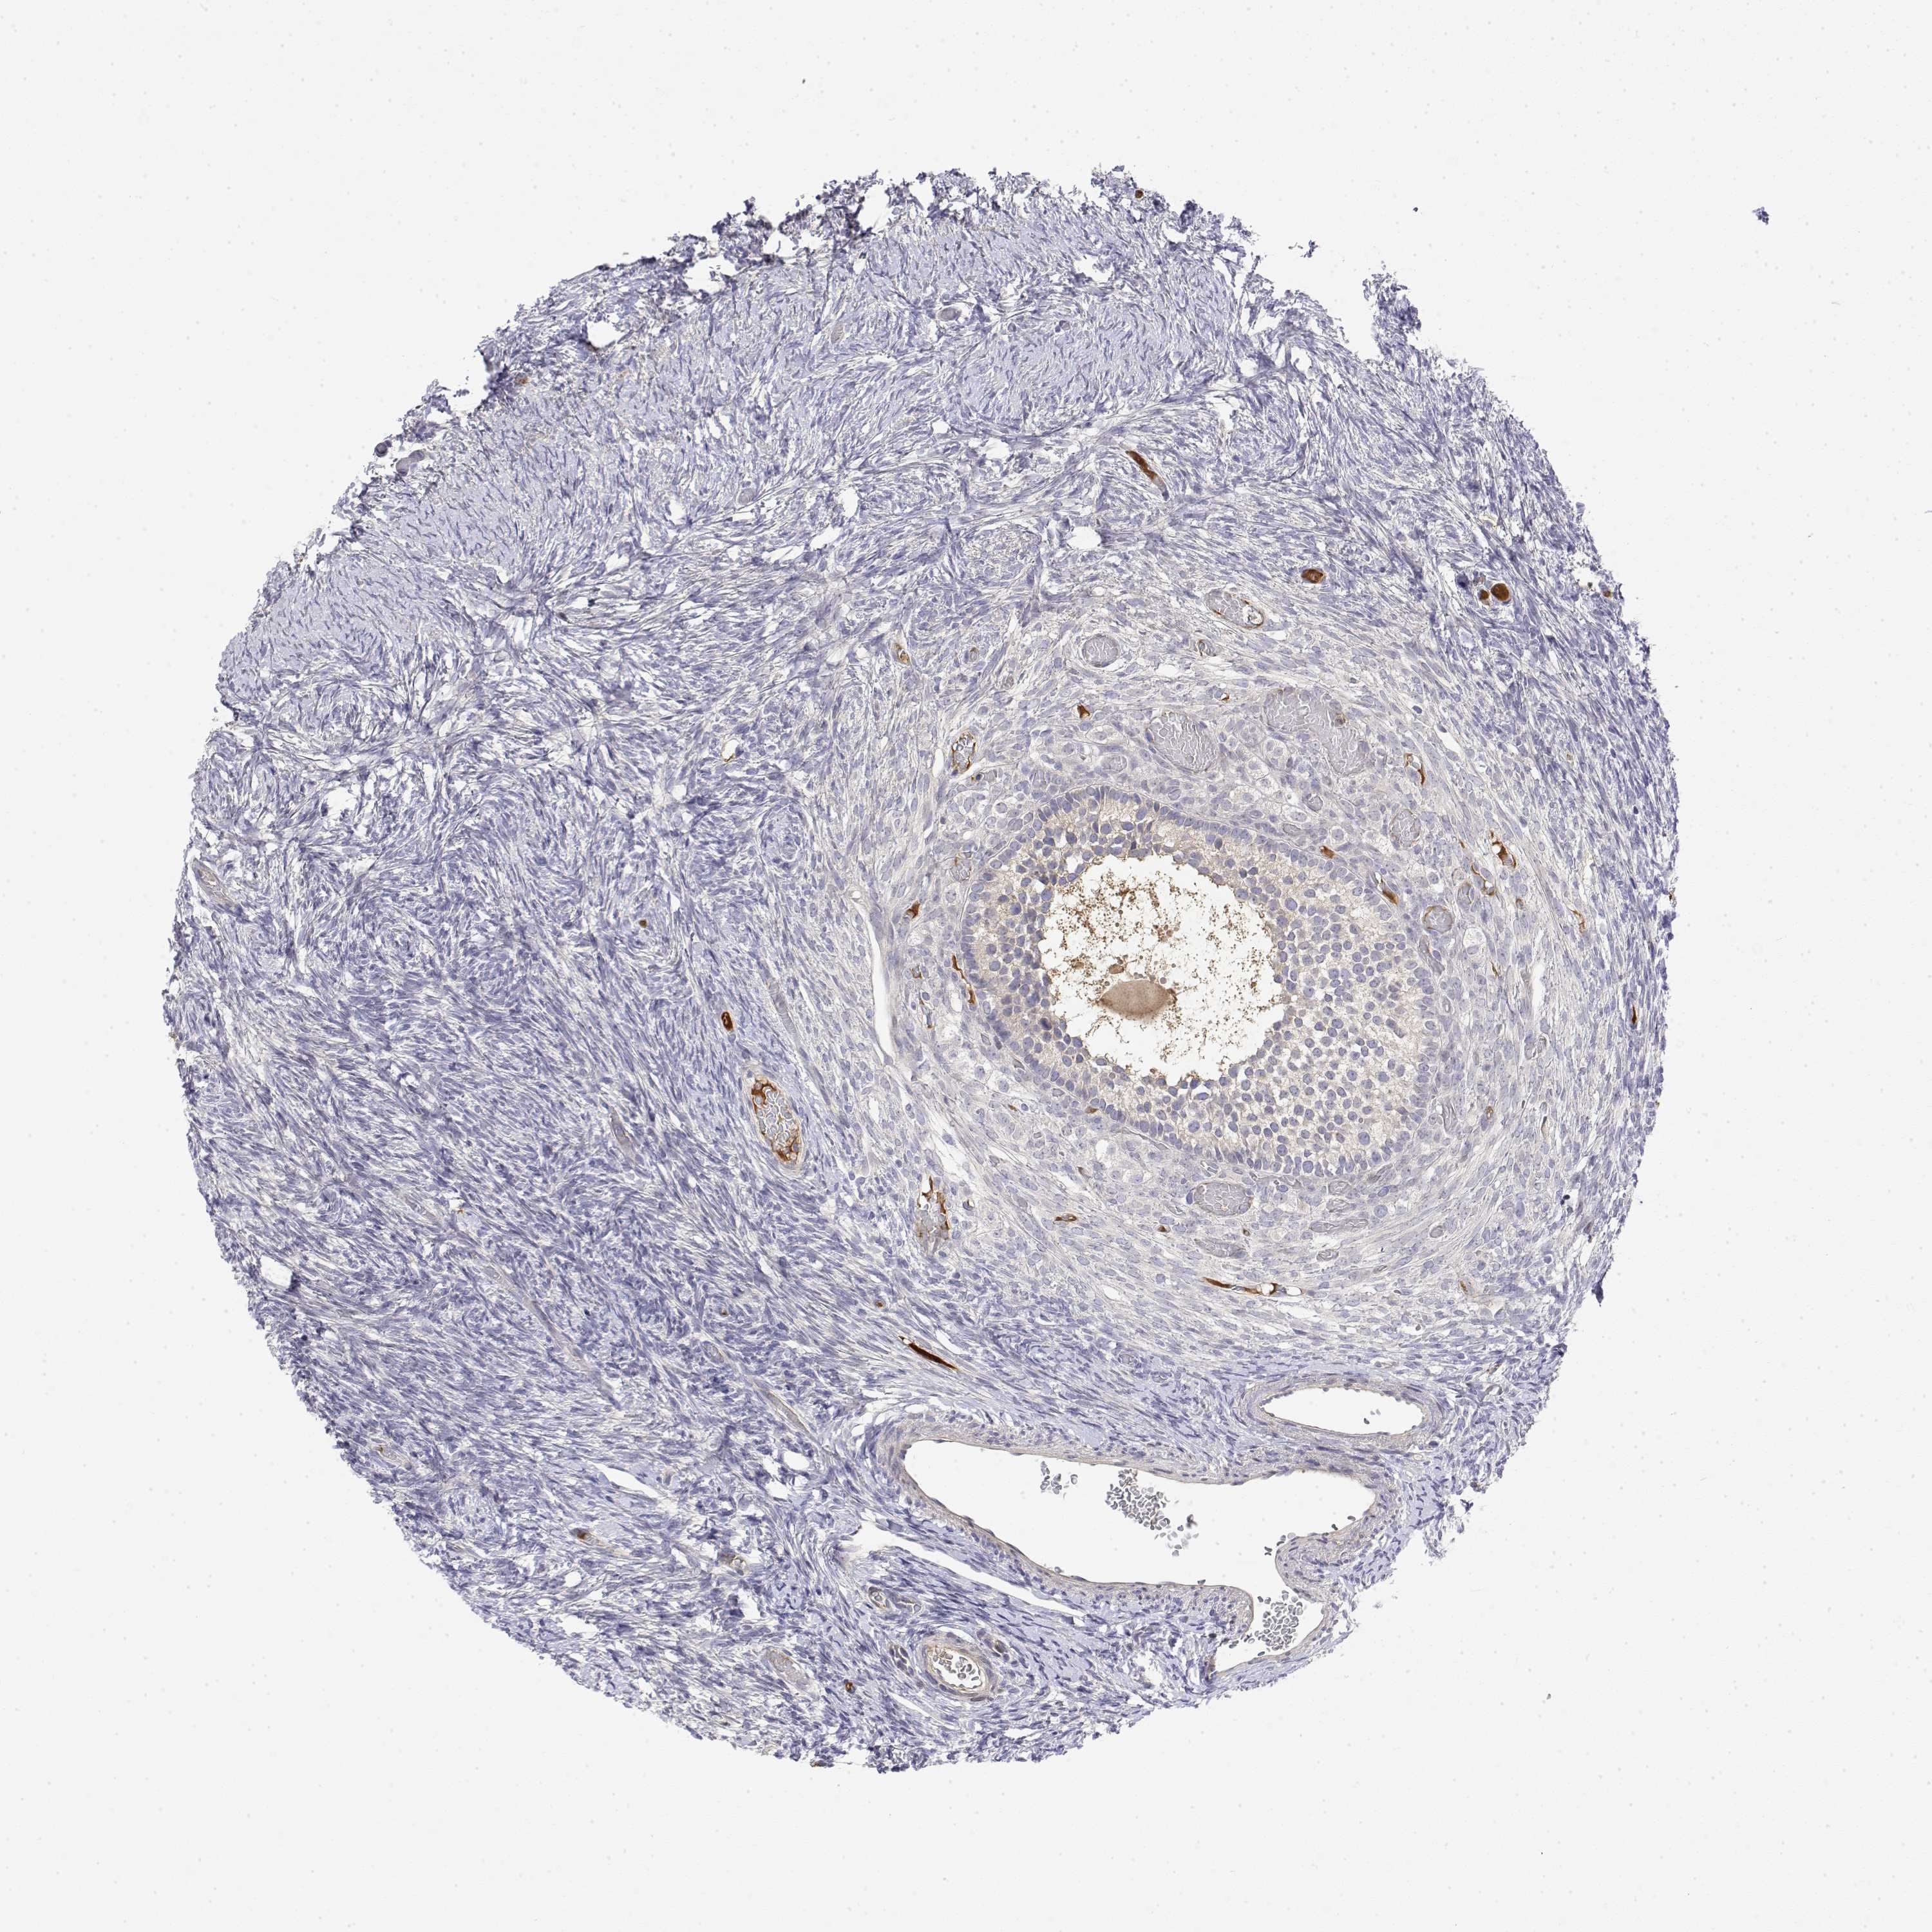
The detailed normal tissue page shows images of the stained tissue, together with antibody staining and expression level of the cell types. A knowledge-based annotated protein expression is provided for each cell type at the top of the page and the staining level of the individual antibodies is given underneath each antibody ID.
Samples from up to three different individuals have been stained for each antibody. The gender, age and tissue characterization are reported for each individual (patient) and are viewable when clicking on the image for magnification.
The images can be clicked for an enlarged view that can be panned. From the enlarged view, all stained images for all antibodies can be browsed (represented by miniature images). The miniature image with an orange overlay is the currently displayed image.
This score describes the level of antibody staining observed in the annotated cell types as not detected, low, medium, or high. It is based on the staining intensity and fraction of stained cells.
The RNA-seq details section shows detailed information about the individual samples used for the transcript profiling and results of the RNA-seq analysis.
Information about each individual sample is listed below, including gender, age, a tissue section image and estimated fractions of cell types. TPM (transcripts per million) values give a quantification of the gene abundance which is comparable between different genes and samples.
RNA-Seq data is reported as average RPKM (reads per kilobase per million mapped reads), generated by the Genotype-Tissue Expression (GTEx) project. More information can be found on the GTEx portal.
Normal distribution across the dataset is visualized with box plots, shown as median and 25th and 75th percentiles. Points are displayed as outliers if they are above or below 1.5 times the interquartile range. RPKM values of the individual samples are presented next to the box plot.
Max RPKM: 3025.3
Min RPKM: 176.6
Std RPKM: 480.2
Median RPKM: 872.8
GTEX-WI4N-2526-SM-4OOSE
40-49 years, female
3025.3
GTEX-13X6H-1026-SM-5SIBE
50-59 years, female
2314.7
GTEX-X15G-1726-SM-4PQZN
50-59 years, female
2266.2
GTEX-OHPL-2426-SM-48TDN
60-69 years, female
2164.6
GTEX-ZLWG-0926-SM-4WWC3
50-59 years, female
1848.0
GTEX-ZYY3-2726-SM-5EGH4
60-69 years, female
1769.8
GTEX-12WSG-1426-SM-5FQUK
50-59 years, female
1754.3
GTEX-146FH-2526-SM-5Q5BP
50-59 years, female
1739.6
GTEX-QCQG-1426-SM-48U22
50-59 years, female
1706.0
GTEX-POMQ-1426-SM-3P61D
20-29 years, female
1660.4
GTEX-RWS6-1026-SM-47JXD
60-69 years, female
1649.4
GTEX-133LE-1226-SM-5IFGC
20-29 years, female
1609.3
GTEX-ZAJG-2726-SM-5S2MU
50-59 years, female
1573.3
GTEX-ZZPU-2126-SM-5EGIU
50-59 years, female
1523.9
GTEX-ZC5H-2026-SM-5CVN2
40-49 years, female
1493.9
GTEX-S32W-1226-SM-4AD67
50-59 years, female
1482.1
GTEX-11ZTS-1926-SM-5CVLA
60-69 years, female
1475.2
GTEX-13OVJ-2426-SM-5KM3I
50-59 years, female
1473.4
GTEX-S4P3-0926-SM-4AD54
50-59 years, female
1449.7
GTEX-ZYWO-1926-SM-5E456
40-49 years, female
1432.0
GTEX-Y114-1726-SM-4TT7U
50-59 years, female
1361.4
GTEX-139D8-2426-SM-5KM3A
30-39 years, female
1340.9
GTEX-XV7Q-1426-SM-4BRWA
40-49 years, female
1311.0
GTEX-11P81-1526-SM-5P9GS
30-39 years, female
1306.4
GTEX-XYKS-1726-SM-4E3IO
60-69 years, female
1282.6
GTEX-P4PP-2426-SM-3P61L
30-39 years, female
1281.0
GTEX-11GSP-0226-SM-5A5KV
60-69 years, female
1253.8
GTEX-11I78-1926-SM-59878
50-59 years, female
1223.5
GTEX-S341-0726-SM-4AD5R
40-49 years, female
1208.1
GTEX-PLZ4-2826-SM-3P617
50-59 years, female
1196.3
GTEX-13OVI-0726-SM-5L3DD
60-69 years, female
1166.6
GTEX-11XUK-1626-SM-5GU5O
40-49 years, female
1166.2
GTEX-13W3W-1526-SM-5LU5I
60-69 years, female
1152.4
GTEX-ZPIC-1426-SM-4WWCP
40-49 years, female
1150.2
GTEX-13U4I-2126-SM-5LU55
40-49 years, female
1069.6
GTEX-11DXX-1426-SM-5GIDU
60-69 years, female
1061.9
GTEX-RU72-2226-SM-46MUE
50-59 years, female
1039.4
GTEX-13N11-0526-SM-5IJFI
50-59 years, female
1026.0
GTEX-X8HC-2726-SM-46MUA
50-59 years, female
1019.8
GTEX-12WSJ-1226-SM-5LU91
40-49 years, female
1013.0
GTEX-145ME-1226-SM-5SIB6
40-49 years, female
997.8
GTEX-11VI4-1026-SM-5EQM1
40-49 years, female
986.5
GTEX-XUW1-0126-SM-4BOOQ
50-59 years, female
985.2
GTEX-12WSB-2226-SM-5GCOS
60-69 years, female
960.3
GTEX-OHPK-2426-SM-3MJGH
50-59 years, female
932.2
GTEX-13D11-1126-SM-5KLYS
50-59 years, female
928.2
GTEX-132AR-1426-SM-5IFF1
50-59 years, female
923.5
GTEX-W5WG-0926-SM-4RTX9
50-59 years, female
884.1
GTEX-13QBU-1526-SM-5LU3W
40-49 years, female
872.8
GTEX-13O3O-2726-SM-5KM35
60-69 years, female
872.5
GTEX-1313W-2726-SM-5P9IX
50-59 years, female
870.3
GTEX-Y3IK-2026-SM-4YCDG
50-59 years, female
869.5
GTEX-QVJO-3126-SM-4R1KC
60-69 years, female
857.1
GTEX-13FTX-0926-SM-5IFF7
20-29 years, female
850.2
GTEX-11ZTT-1826-SM-5CVLN
60-69 years, female
849.2
GTEX-PX3G-2426-SM-48TZZ
20-29 years, female
835.4
GTEX-ZP4G-0626-SM-4WWF1
20-29 years, female
834.6
GTEX-T5JW-0426-SM-4DM7M
20-29 years, female
828.9
GTEX-X4EO-2426-SM-4QASD
60-69 years, female
824.8
GTEX-XUZC-1026-SM-4BOPY
30-39 years, female
814.6
GTEX-P78B-1926-SM-3P616
40-49 years, female
814.3
GTEX-TML8-0926-SM-4DXSJ
40-49 years, female
805.5
GTEX-PWN1-2426-SM-48TDD
40-49 years, female
804.0
GTEX-U3ZN-1026-SM-4DXTC
30-39 years, female
794.5
GTEX-13PVR-1226-SM-5RQJ2
60-69 years, female
760.2
GTEX-12ZZX-2026-SM-5LZV9
40-49 years, female
756.4
GTEX-ZVT3-2626-SM-5GU5L
60-69 years, female
730.7
GTEX-1399S-2126-SM-5J2MH
30-39 years, female
721.8
GTEX-1269C-1826-SM-5N9E1
60-69 years, female
711.4
GTEX-RU1J-0826-SM-46MUU
20-29 years, female
699.1
GTEX-131YS-2226-SM-5P9G8
60-69 years, female
692.4
GTEX-11EM3-1726-SM-5N9D1
20-29 years, female
678.7
GTEX-Q734-0726-SM-48TZP
40-49 years, female
673.0
GTEX-XUJ4-1326-SM-4BOQ9
60-69 years, female
670.1
GTEX-TMMY-1726-SM-4DXTD
40-49 years, female
665.1
GTEX-13VXT-1526-SM-5LU3J
20-29 years, female
664.6
GTEX-ZVT2-0326-SM-5E44G
50-59 years, female
661.6
GTEX-TSE9-2226-SM-4DXUR
60-69 years, female
658.2
GTEX-11ZVC-1426-SM-5EGGA
50-59 years, female
653.5
GTEX-YFC4-2726-SM-5IFJW
40-49 years, female
644.3
GTEX-11EMC-1726-SM-5H11P
60-69 years, female
639.3
GTEX-T6MO-1126-SM-4DM5D
40-49 years, female
632.6
GTEX-YJ8O-1026-SM-5CVM5
40-49 years, female
616.7
GTEX-XMD3-2326-SM-4AT5H
50-59 years, female
598.7
GTEX-RTLS-2326-SM-46MUH
60-69 years, female
596.8
GTEX-PWCY-1326-SM-48TCU
20-29 years, female
565.1
GTEX-13PL7-2326-SM-5L3FY
60-69 years, female
546.9
GTEX-UJHI-1226-SM-4IHLR
50-59 years, female
532.9
GTEX-ZYFG-1726-SM-5GZZB
60-69 years, female
511.1
GTEX-T2IS-2026-SM-4DM6W
20-29 years, female
510.9
GTEX-12WSD-2726-SM-59HLR
60-69 years, female
460.6
GTEX-13QIC-1526-SM-5IJFL
60-69 years, female
454.8
GTEX-WWYW-2726-SM-4MVOP
50-59 years, female
407.5
GTEX-14AS3-1326-SM-5RQJE
40-49 years, female
380.6
GTEX-S7SF-1326-SM-4AD4P
20-29 years, female
370.4
GTEX-P4QT-2426-SM-3NMCL
50-59 years, female
353.9
GTEX-12WSK-1926-SM-5LZVK
40-49 years, female
176.6
Show all
OVARY - FANTOM5 CAGEi
Tissue data obtained through Cap Analysis of Gene Expression (CAGE) are reported as Tags Per Million, generated by the FANTOM5 project. More information can be found here.
 The Human Protein Atlas project is funded


 MENU
MENU