We use cookies to enhance the usability of our website. If you continue, we'll assume that you are happy to receive all cookies. More information. Don't show this again.
The protein expression bar, with the units not detected (n), low (l), medium (m) and high (h), is based on a best estimate of the true protein expression for proteins where the antibody staining pattern has been analyzed by knowledge-based annotation. For genes where more than one antibody has been used, a collective score is set. For details, see Assays & annotation.
h
m
l
n
RNA expressioni
RNA expression shows average values based on RNA-seq data generated by HPA, the Genotype-Tissue Expression (GTEx) consortium or the FANTOM5 consortium.
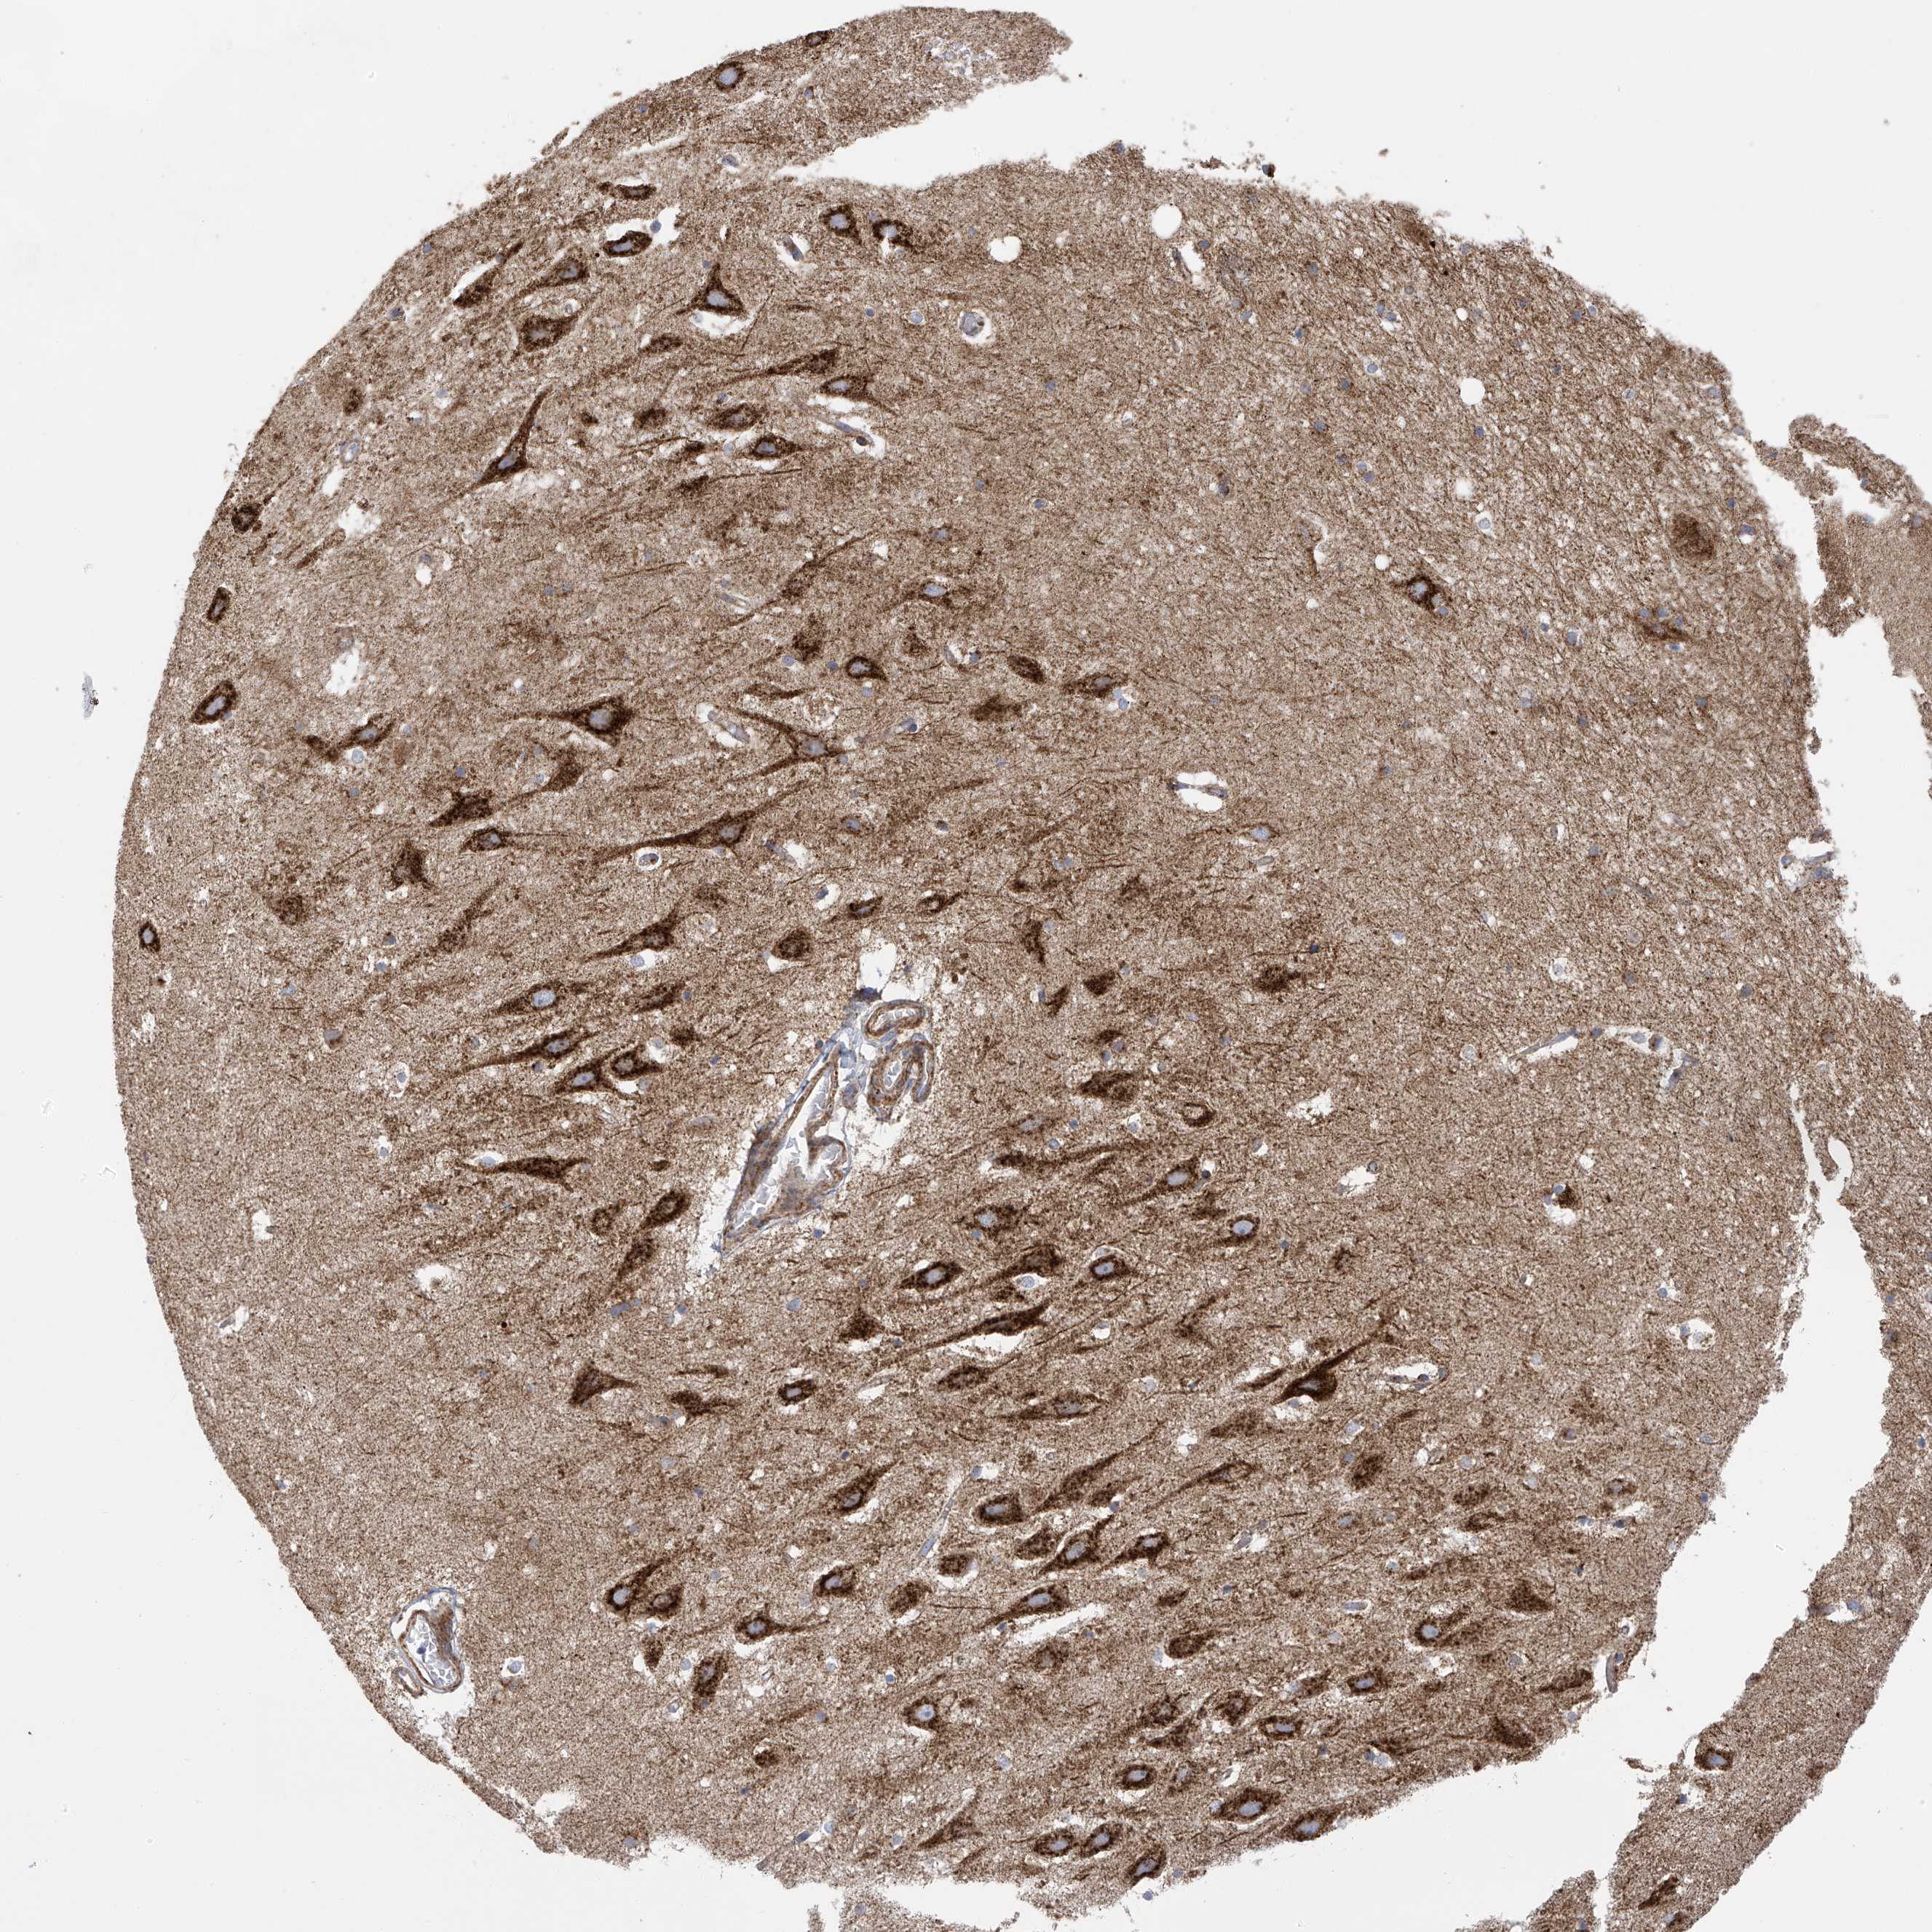
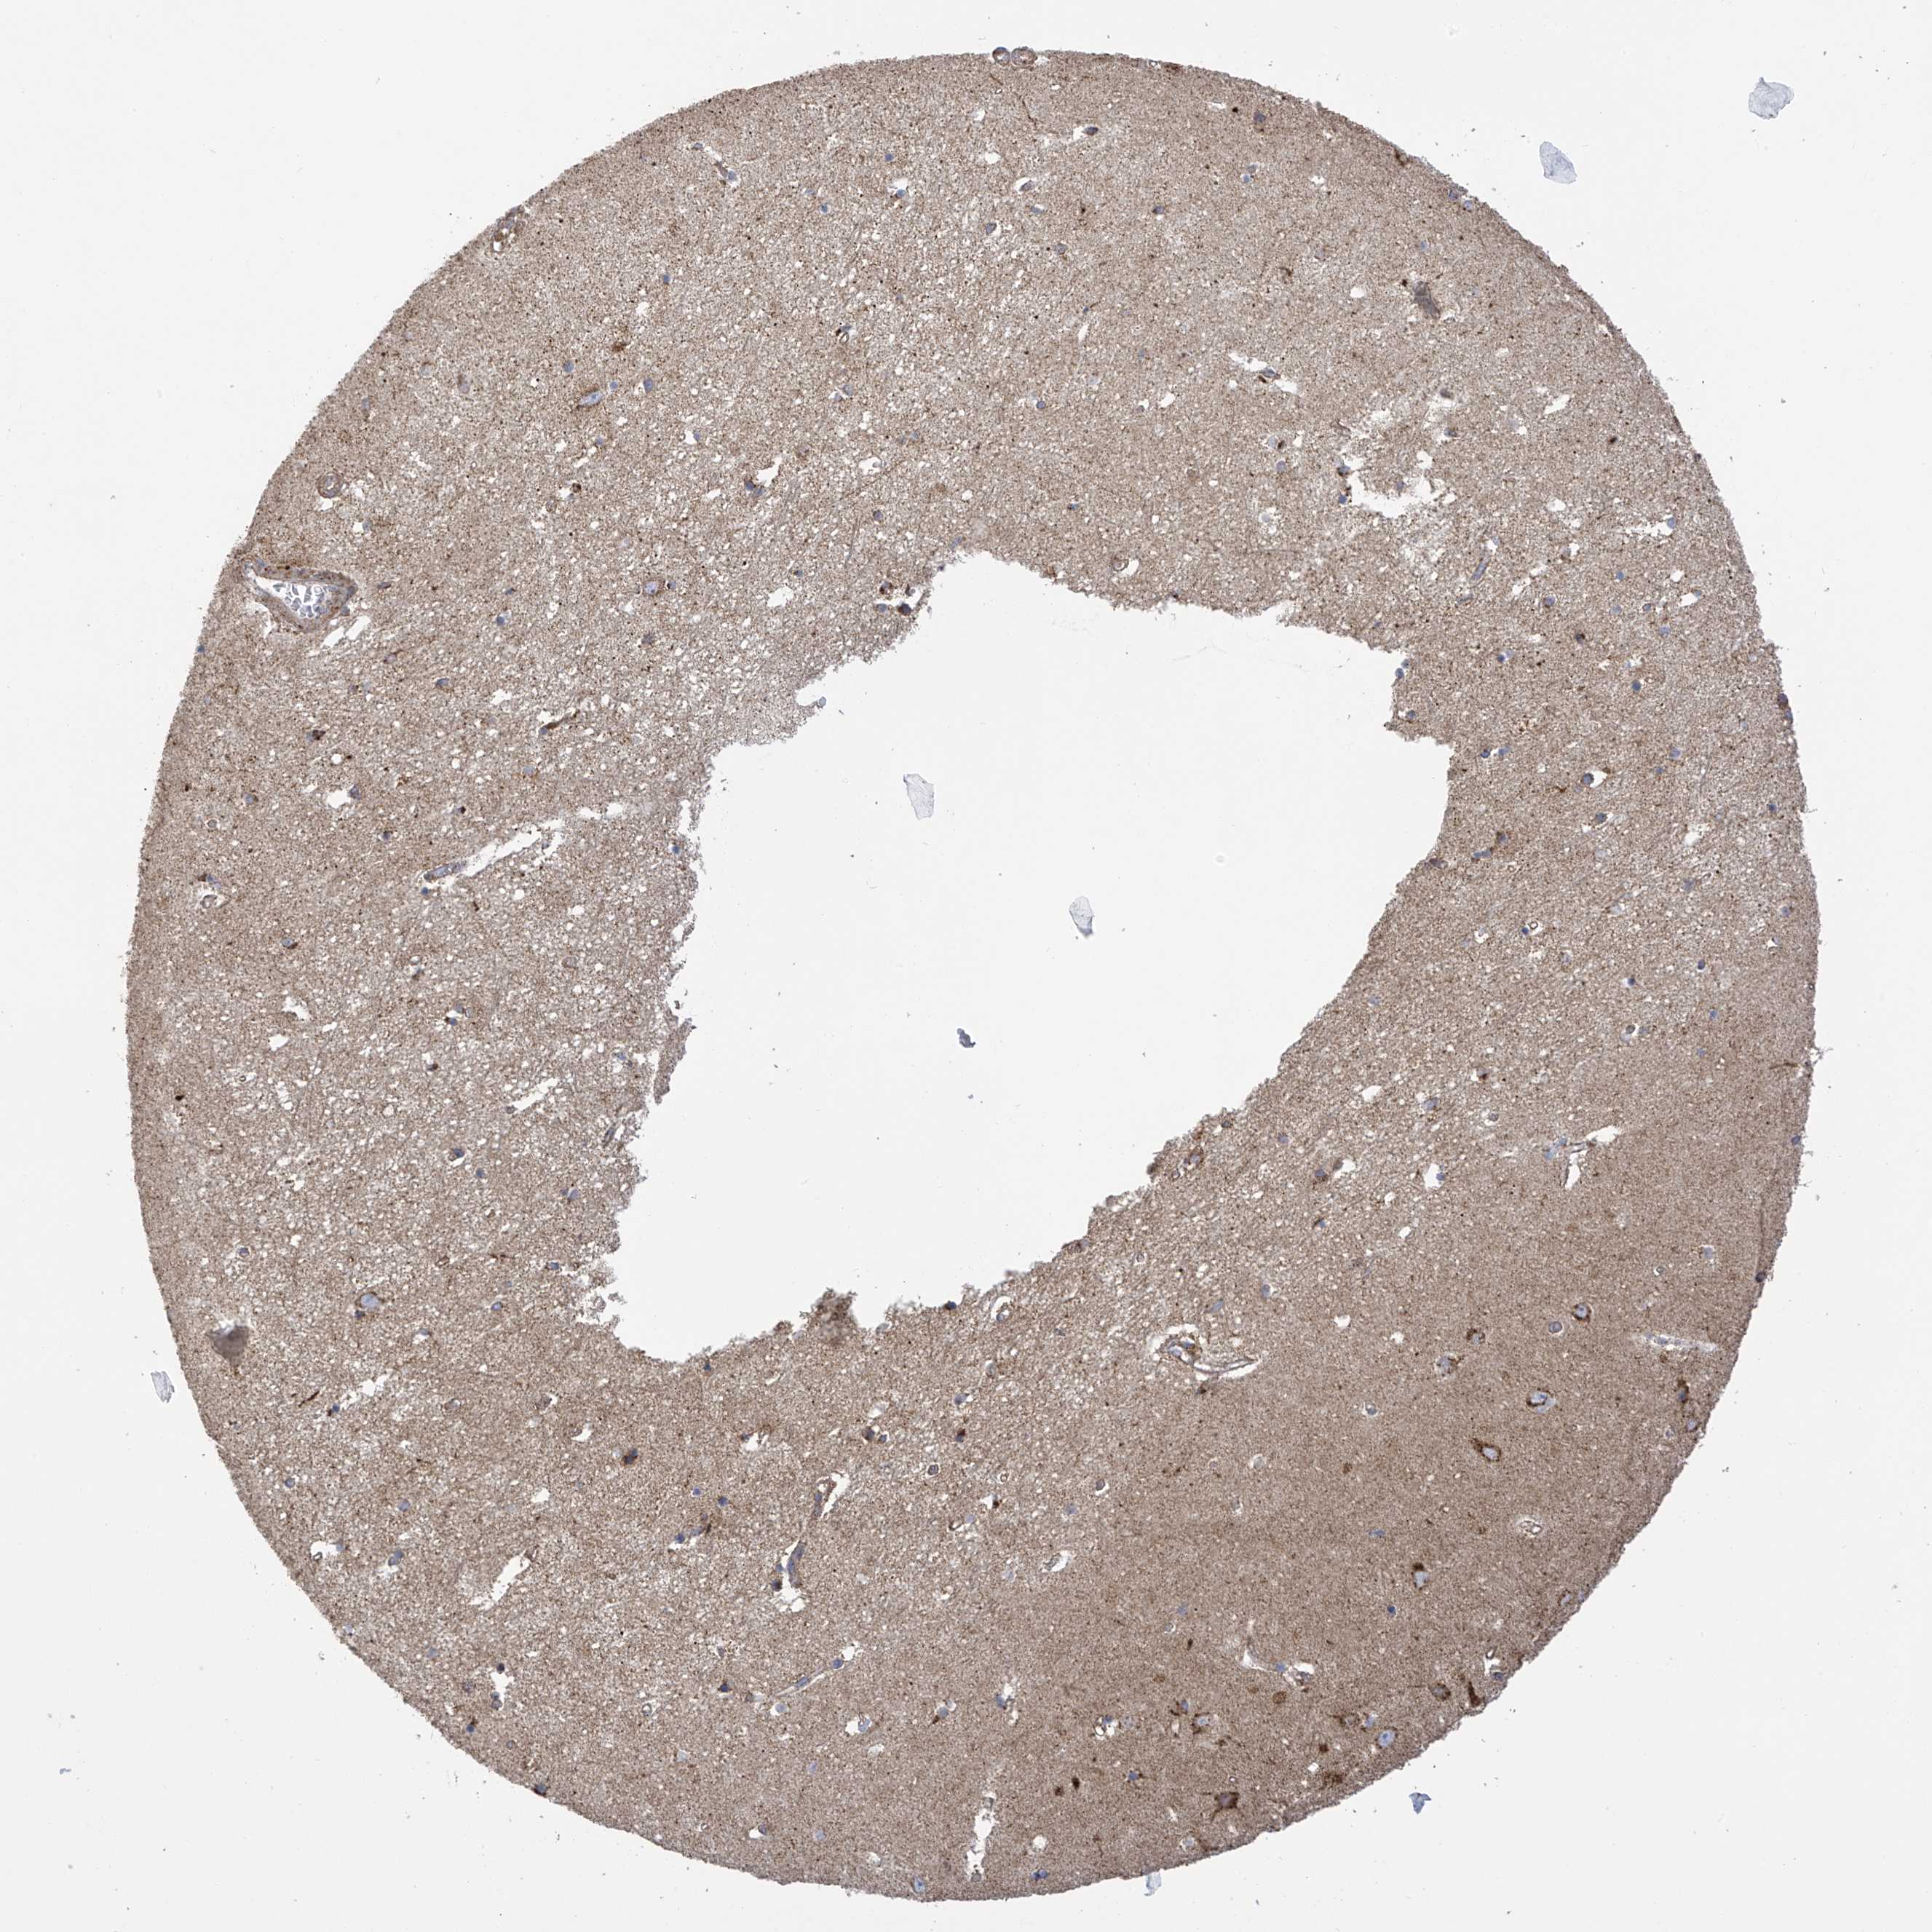
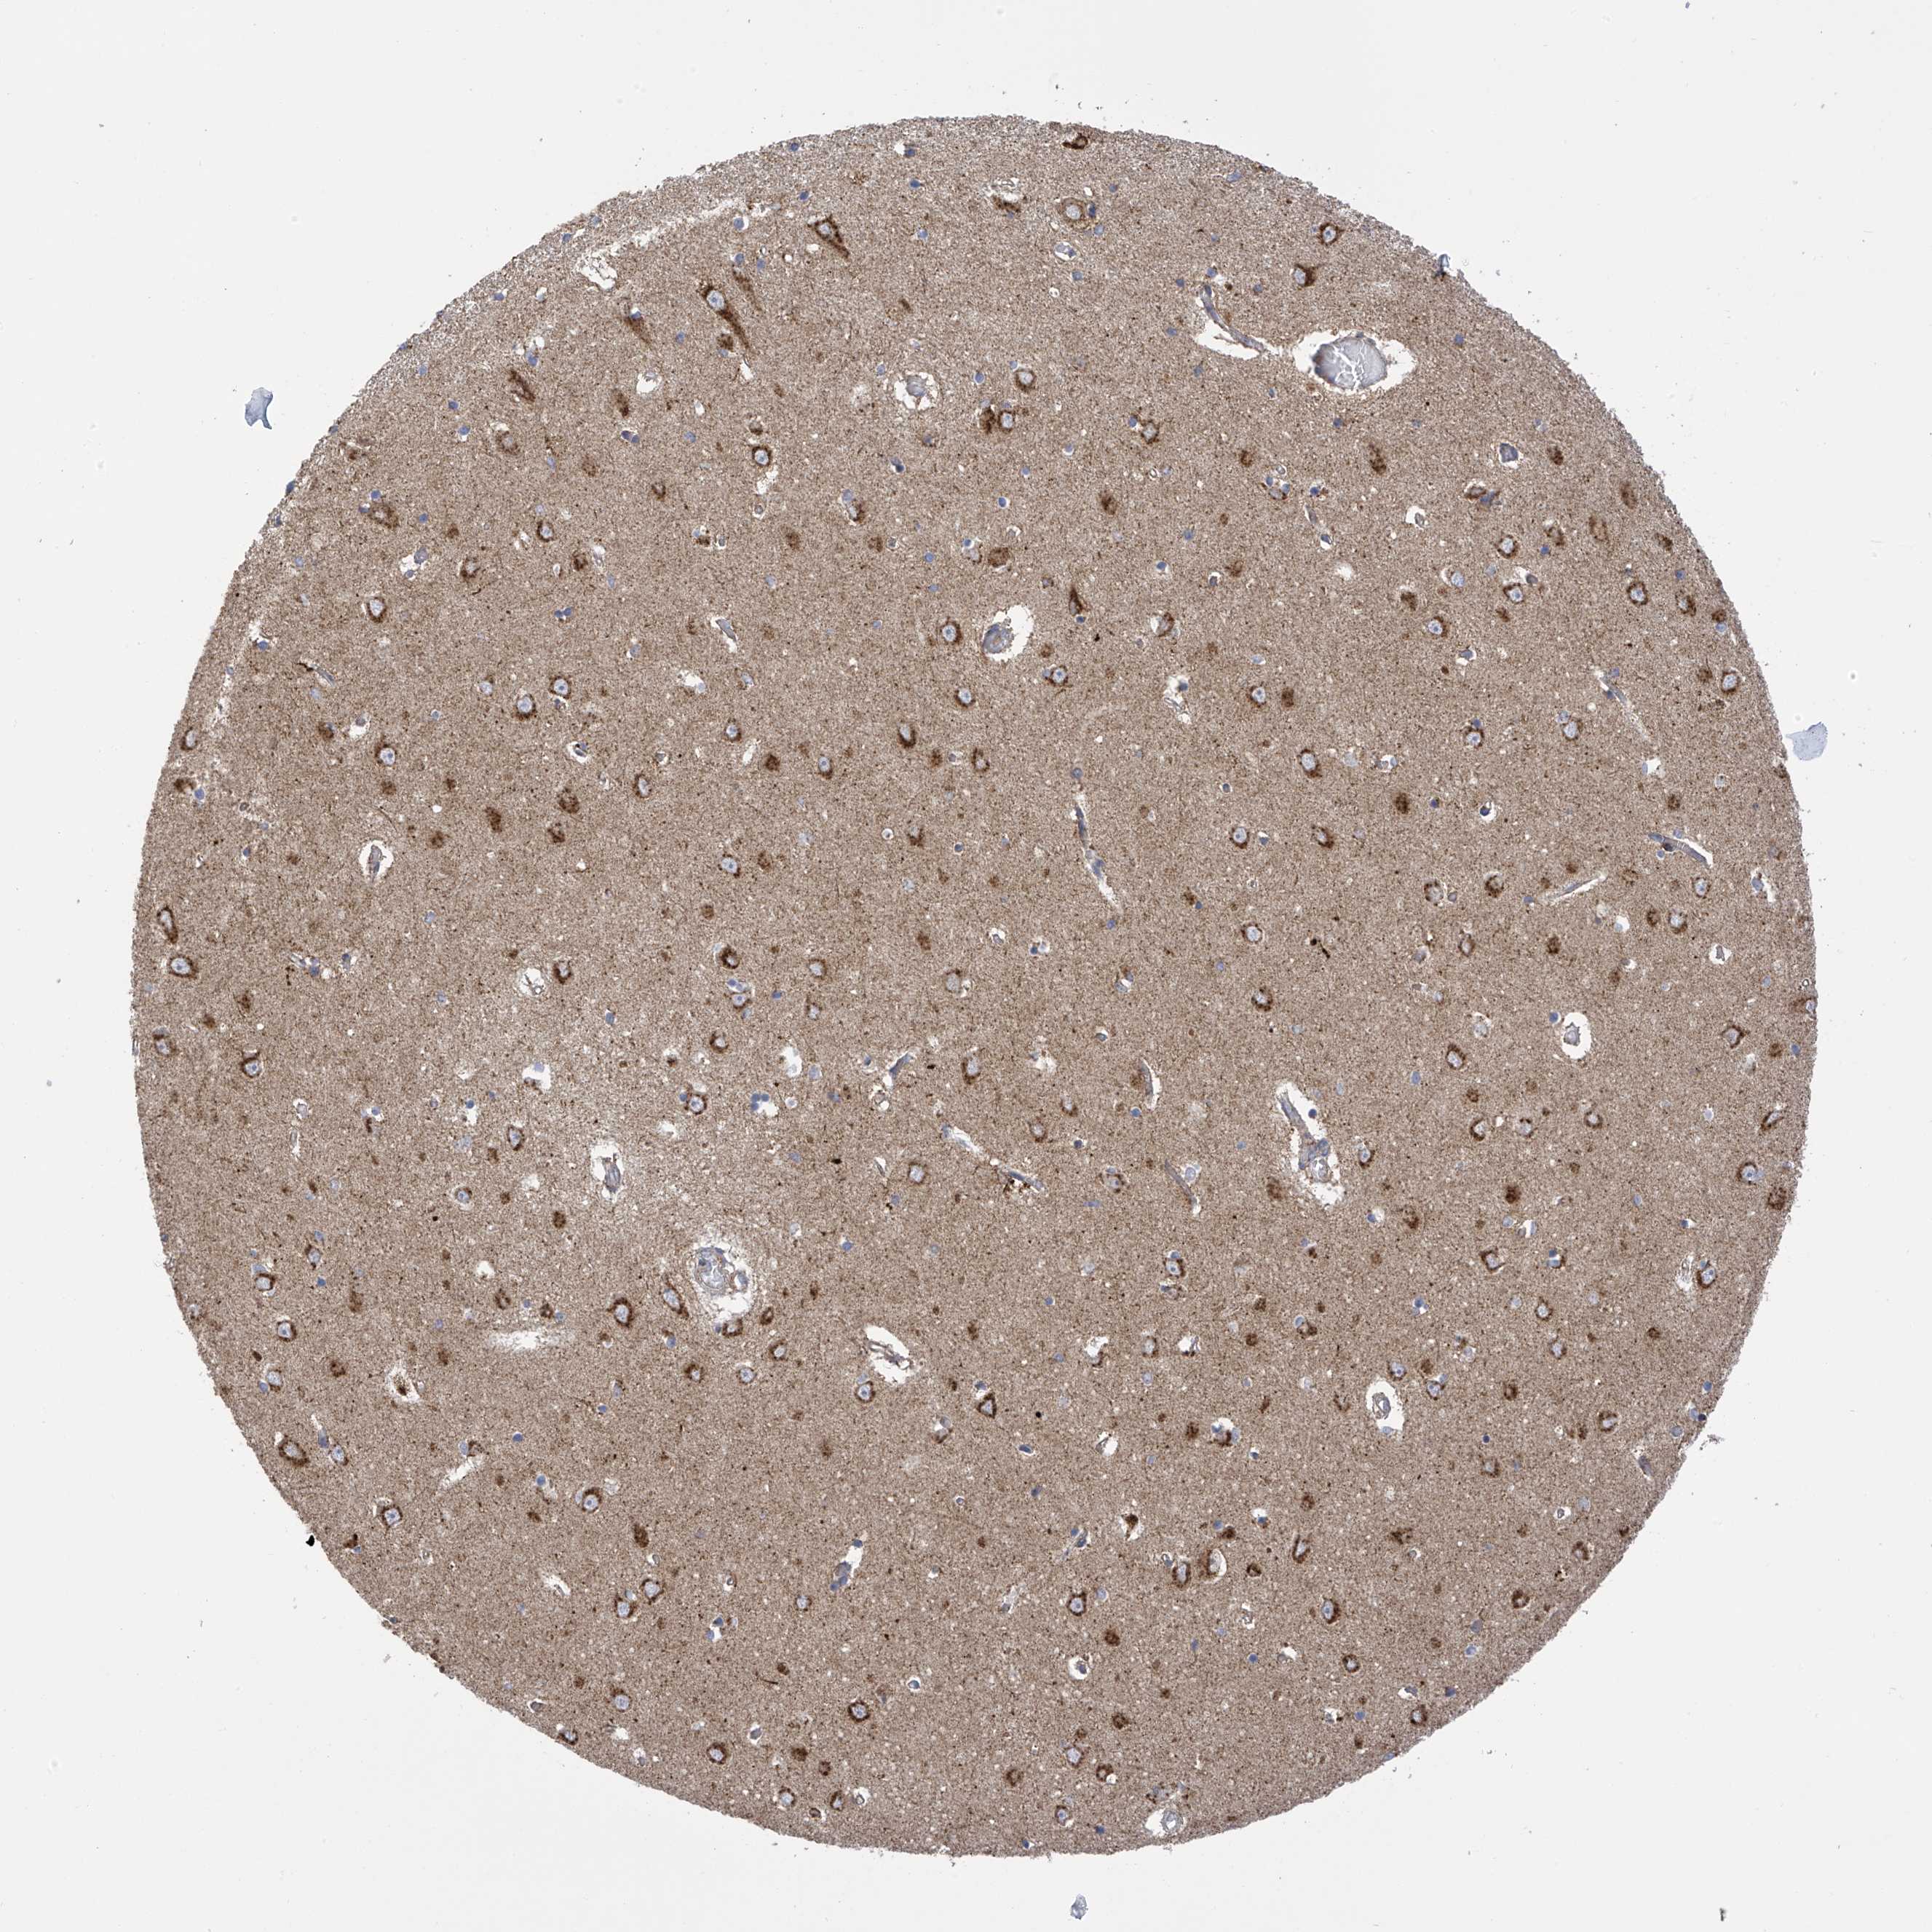
The detailed normal tissue page shows images of the stained tissue, together with antibody staining and expression level of the cell types. A knowledge-based annotated protein expression is provided for each cell type at the top of the page and the staining level of the individual antibodies is given underneath each antibody ID.
Samples from up to three different individuals have been stained for each antibody. The gender, age and tissue characterization are reported for each individual (patient) and are viewable when clicking on the image for magnification.
The images can be clicked for an enlarged view that can be panned. From the enlarged view, all stained images for all antibodies can be browsed (represented by miniature images). The miniature image with an orange overlay is the currently displayed image.
This score describes the level of antibody staining observed in the annotated cell types as not detected, low, medium, or high. It is based on the staining intensity and fraction of stained cells.
The RNA-seq details section shows detailed information about the individual samples used for the transcript profiling and results of the RNA-seq analysis.
Information about each individual sample is listed below, including gender, age, a tissue section image and estimated fractions of cell types. TPM (transcripts per million) values give a quantification of the gene abundance which is comparable between different genes and samples.
RNA-Seq data is reported as average RPKM (reads per kilobase per million mapped reads), generated by the Genotype-Tissue Expression (GTEx) project. More information can be found on the GTEx portal.
Normal distribution across the dataset is visualized with box plots, shown as median and 25th and 75th percentiles. Points are displayed as outliers if they are above or below 1.5 times the interquartile range. RPKM values of the individual samples are presented next to the box plot.
Max RPKM: 436.0
Min RPKM: 41.4
Std RPKM: 78.0
Median RPKM: 164.8
GTEX-13O3O-0011-R1b-SM-5KM2K
60-69 years, female
436.0
GTEX-N7MS-0011-R1a-SM-2HMJG
60-69 years, male
368.6
GTEX-13JUV-0011-R1a-SM-5LZY4
40-49 years, female
354.9
GTEX-QVUS-0011-R1A-SM-3GAD2
60-69 years, female
353.1
GTEX-12ZZX-0011-R1a-SM-5EQ6B
40-49 years, female
345.0
GTEX-PVOW-0011-R1A-SM-32PL6
40-49 years, male
318.0
GTEX-WHSE-0011-R1A-SM-3P5ZK
20-29 years, male
312.0
GTEX-N7MT-0011-R1a-SM-5SI7S
60-69 years, female
308.6
GTEX-139TT-0011-R1a-SM-5LZVD
60-69 years, male
308.4
GTEX-144GL-0011-R1a-SM-5PNZ5
50-59 years, male
295.8
GTEX-13G51-0011-R1a-SM-5LZYR
60-69 years, male
283.5
GTEX-13OVJ-0011-R1b-SM-5L3I6
50-59 years, female
280.2
GTEX-P44H-0011-R1A-SM-3NM8J
40-49 years, male
278.5
GTEX-131XH-0011-R1a-SM-5DUWA
50-59 years, male
278.2
GTEX-T6MN-0011-R1A-SM-32QOY
50-59 years, male
268.5
GTEX-13N1W-0011-R1b-SM-5MR4T
70-79 years, male
266.0
GTEX-YFC4-0011-R1a-SM-4V6EH
40-49 years, female
265.4
GTEX-14ASI-0011-R1b-SM-5S2TY
60-69 years, male
256.5
GTEX-13X6I-0011-R1b-SM-5PNZC
60-69 years, male
246.4
GTEX-QMR6-0011-R1A-SM-32PKW
50-59 years, male
240.7
GTEX-13RTJ-0011-R1a-SM-5O9D9
60-69 years, male
238.1
GTEX-X585-0011-R1B-SM-46MVE
50-59 years, male
232.2
GTEX-12WSE-0011-R1b-SM-5GU4V
20-29 years, male
231.6
GTEX-12WSM-0011-R1a-SM-5LZW6
60-69 years, male
228.7
GTEX-Q2AG-0011-R1A-SM-2HMJI
40-49 years, female
222.7
GTEX-13FXS-0011-R1a-SM-5K7U6
50-59 years, male
218.3
GTEX-UTHO-0011-R1A-SM-3GIJO
60-69 years, male
217.6
GTEX-WZTO-0011-R1B-SM-3NMAR
40-49 years, male
213.3
GTEX-12WSH-0011-R1a-SM-5GU5V
50-59 years, male
212.0
GTEX-13112-0011-R1b-SM-5HL7K
50-59 years, male
210.0
GTEX-QDT8-0011-R1A-SM-32PKS
30-39 years, female
206.6
GTEX-ZAB4-0011-R1a-SM-4RGNO
40-49 years, male
206.2
GTEX-QVJO-0011-R1A-SM-2S1QI
60-69 years, female
205.9
GTEX-NPJ8-0011-R1a-SM-33HCB
40-49 years, male
204.5
GTEX-NPJ7-0011-R1a-SM-3GACT
60-69 years, female
196.0
GTEX-XOTO-0011-R1B-SM-4B65C
50-59 years, male
193.6
GTEX-ZUA1-0011-R1a-SM-4YCE2
40-49 years, male
192.3
GTEX-145LS-0011-R1b-SM-5PNUP
60-69 years, female
192.1
GTEX-13N2G-0011-R1b-SM-5MR3G
60-69 years, male
191.7
GTEX-S7SE-0011-R1A-SM-2XCDE
50-59 years, male
181.8
GTEX-11UD1-0011-R1b-SM-5BC7D
40-49 years, female
181.7
GTEX-13OVL-0011-R1a-SM-5L3H5
50-59 years, male
175.9
GTEX-13S7M-0011-R1b-SM-5PNZE
60-69 years, female
175.7
GTEX-13OW5-0011-R1b-SM-5L3GE
60-69 years, male
173.1
GTEX-12WSF-0011-R1a-SM-5DUVI
70-79 years, male
170.2
GTEX-13FHO-0011-R1b-SM-5KLZG
60-69 years, male
169.0
GTEX-1313W-0011-R1b-SM-5EQ4A
50-59 years, female
167.2
GTEX-13QIC-0011-R1a-SM-5O9CJ
60-69 years, female
162.4
GTEX-XMD1-0011-R1A-SM-4AT4C
60-69 years, male
159.9
GTEX-13O3Q-0011-R1b-SM-5KM3L
50-59 years, male
159.4
GTEX-13NYS-0011-R1b-SM-5MR55
60-69 years, male
158.9
GTEX-131YS-0011-R1a-SM-5DUXC
60-69 years, female
156.3
GTEX-13OW6-0011-R1a-SM-5L3HQ
50-59 years, male
154.5
GTEX-13OW8-0011-R1a-SM-5L3HI
60-69 years, male
153.6
GTEX-T5JC-0011-R1A-SM-32PM6
20-29 years, male
149.0
GTEX-11ZTS-0011-R1a-SM-5BC71
60-69 years, female
148.5
GTEX-11GSO-0011-R1b-SM-57WD3
60-69 years, male
148.0
GTEX-R55E-0011-R1A-SM-2TC6N
20-29 years, male
146.8
GTEX-11ZVC-0011-R1b-SM-5BC6M
50-59 years, female
146.7
GTEX-PWO3-0011-R1A-SM-2I5EW
60-69 years, female
145.9
GTEX-13OW7-0011-R1b-SM-5L3HF
50-59 years, male
145.1
GTEX-1212Z-0011-R1b-SM-5BC72
60-69 years, male
144.7
GTEX-1399T-0011-R1b-SM-5DUWN
60-69 years, male
141.3
GTEX-WWYW-0011-R1A-SM-3TW8G
50-59 years, female
140.8
GTEX-13QJC-0011-R1b-SM-5S2UU
60-69 years, female
140.7
GTEX-X4XX-0011-R1B-SM-3P622
60-69 years, male
140.5
GTEX-WVLH-0011-R1A-SM-4MVOK
50-59 years, male
139.2
GTEX-13SLW-0011-R1a-SM-5S2W7
70-79 years, male
139.0
GTEX-WL46-0011-R1A-SM-3LK6M
50-59 years, male
136.8
GTEX-13JVG-0011-R1a-SM-5KM32
60-69 years, male
136.3
GTEX-132Q8-0011-R1a-SM-5EGLK
60-69 years, male
136.1
GTEX-YJ89-0011-R1a-SM-4RGLS
60-69 years, male
134.1
GTEX-TSE9-0011-R1A-SM-3DB7E
60-69 years, female
133.2
GTEX-12WSD-0011-R1b-SM-5LZVY
60-69 years, female
133.1
GTEX-13NYB-0011-R1b-SM-5KM4F
40-49 years, male
130.9
GTEX-145LU-0011-R1a-SM-5Q5CE
50-59 years, male
130.0
GTEX-11ONC-0011-R1a-SM-57WD4
60-69 years, male
129.8
GTEX-139T8-0011-R1a-SM-5HL75
60-69 years, male
118.5
GTEX-145MH-0011-R1b-SM-5PNWY
50-59 years, male
117.4
GTEX-RNOR-0011-R1A-SM-5SI8F
50-59 years, female
117.2
GTEX-13FLW-0011-R1b-SM-5LZX2
50-59 years, male
116.6
GTEX-13NZA-0011-R1b-SM-5LUAF
60-69 years, male
108.5
GTEX-13RTL-0011-R1a-SM-5PNZ8
40-49 years, male
104.9
GTEX-13PDP-0011-R1a-SM-5PNX5
60-69 years, male
98.5
GTEX-Y8DK-0011-R1A-SM-4RGLO
60-69 years, male
98.3
GTEX-12WSB-0011-R1b-SM-5P9EY
60-69 years, female
89.6
GTEX-13CF2-0011-R1a-SM-5LZY1
60-69 years, male
82.8
GTEX-ZVZQ-0011-R1a-SM-57WBU
60-69 years, female
71.3
GTEX-ZF28-0011-R1a-SM-4WWD1
60-69 years, male
70.9
GTEX-NL3H-0011-R1a-SM-48TDJ
60-69 years, male
67.3
GTEX-13FHP-0011-R1b-SM-5K7XL
50-59 years, male
58.4
GTEX-144GO-0011-R1a-SM-5PNWO
60-69 years, male
55.4
GTEX-13FTY-0011-R1a-SM-5LZXE
40-49 years, female
44.9
GTEX-ZE7O-0011-R1a-SM-57WDM
50-59 years, female
41.4
Show all
HIPPOCAMPUS - FANTOM5 CAGEi
Tissue data obtained through Cap Analysis of Gene Expression (CAGE) are reported as Tags Per Million, generated by the FANTOM5 project. More information can be found here.
 The Human Protein Atlas project is funded


 MENU
MENU