We use cookies to enhance the usability of our website. If you continue, we'll assume that you are happy to receive all cookies. More information. Don't show this again.
The protein expression bar, with the units not detected (n), low (l), medium (m) and high (h), is based on a best estimate of the true protein expression for proteins where the antibody staining pattern has been analyzed by knowledge-based annotation. For genes where more than one antibody has been used, a collective score is set. For details, see Assays & annotation.
h
m
l
n
RNA expressioni
RNA expression shows average values based on RNA-seq data generated by HPA, the Genotype-Tissue Expression (GTEx) consortium or the FANTOM5 consortium.
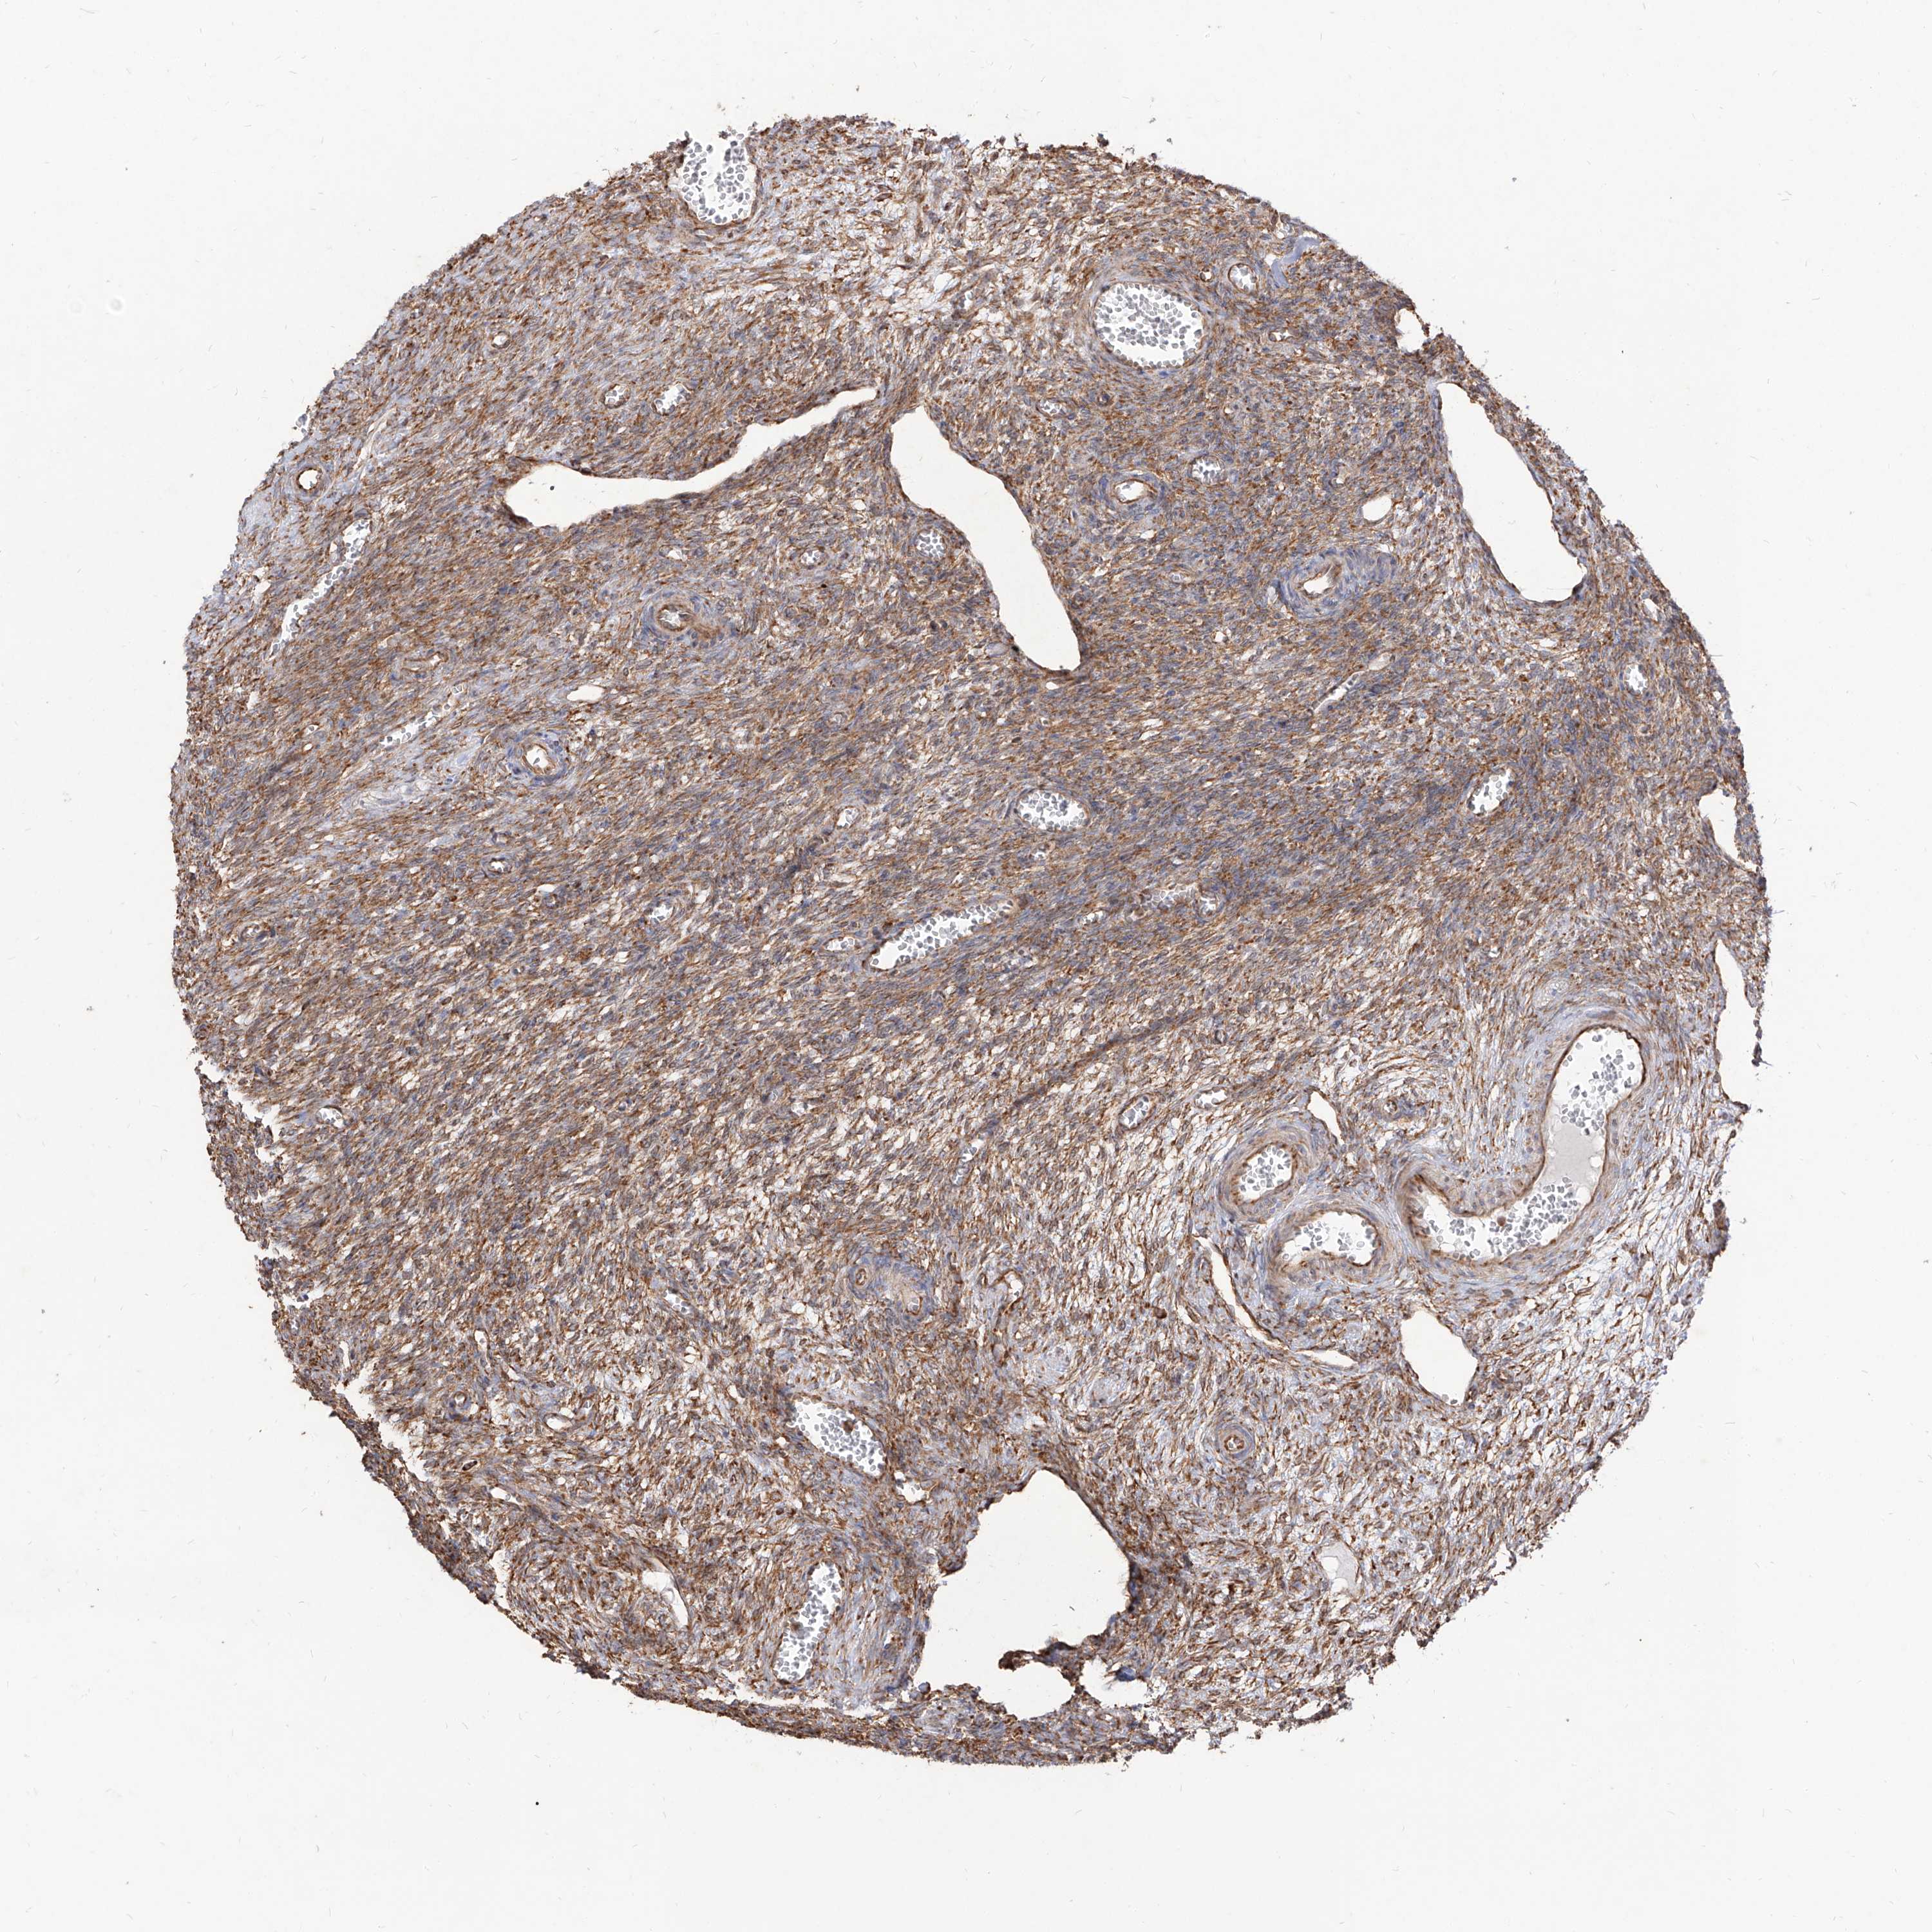
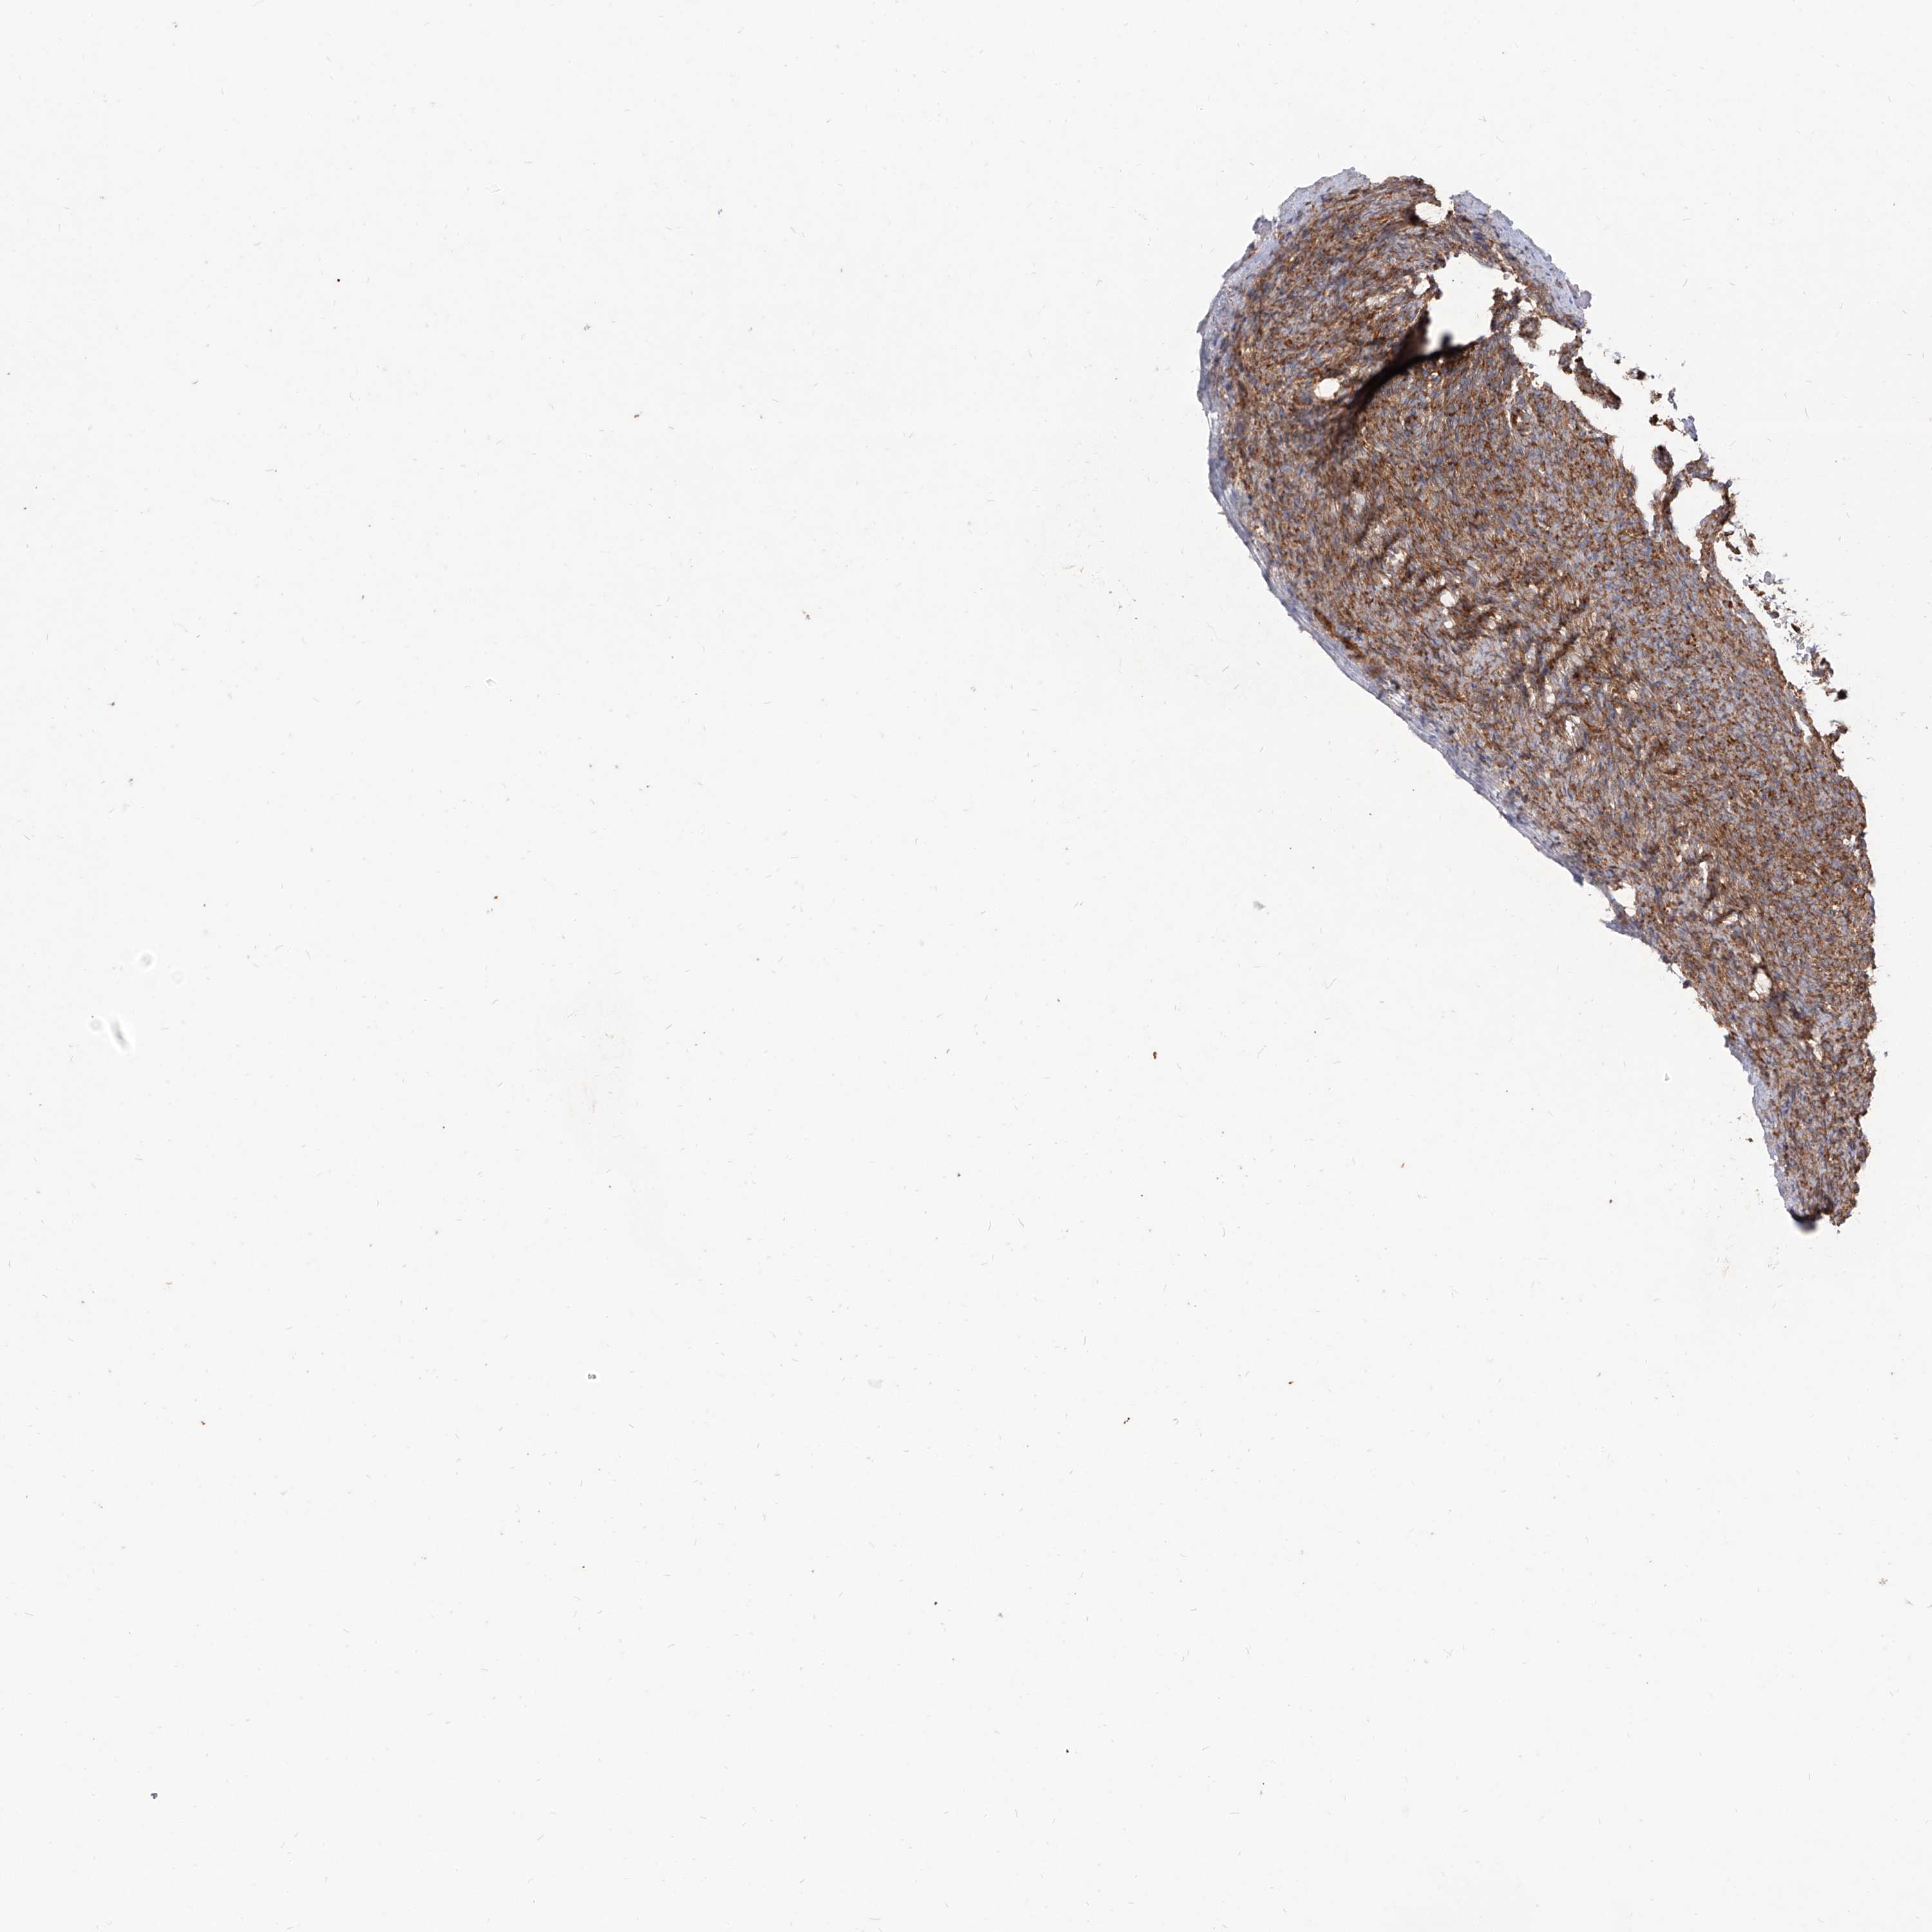
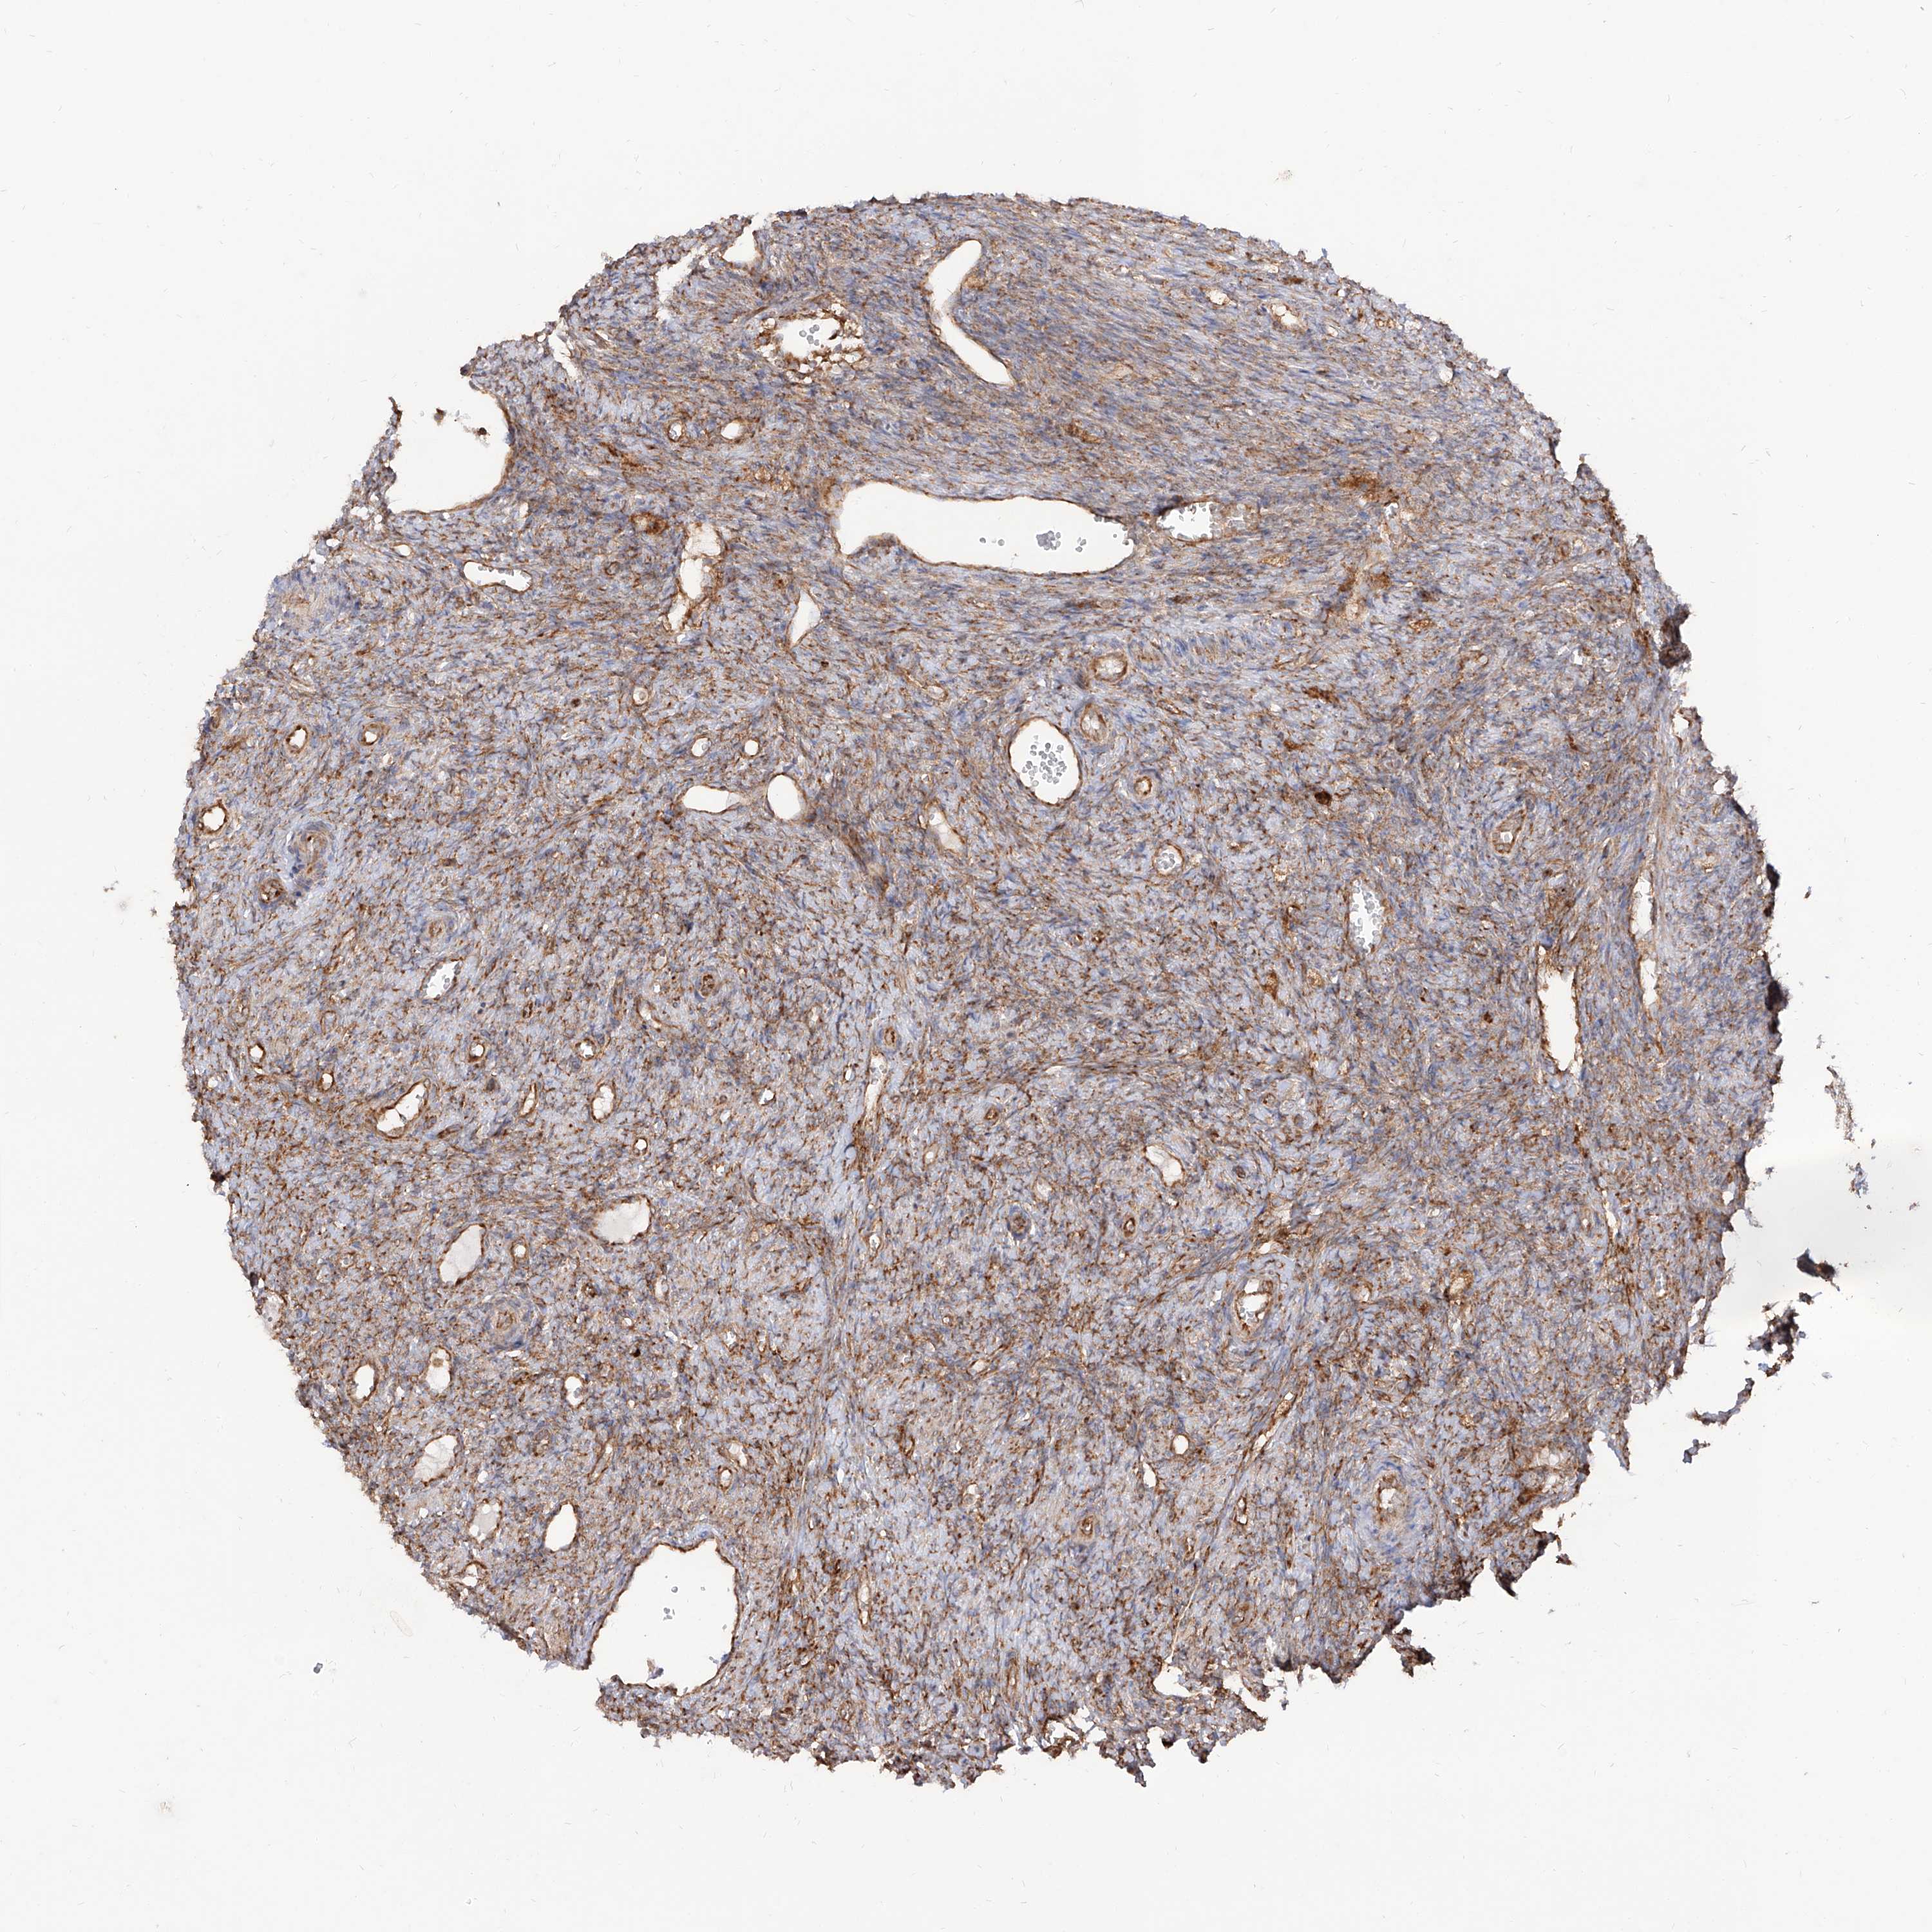
The detailed normal tissue page shows images of the stained tissue, together with antibody staining and expression level of the cell types. A knowledge-based annotated protein expression is provided for each cell type at the top of the page and the staining level of the individual antibodies is given underneath each antibody ID.
Samples from up to three different individuals have been stained for each antibody. The gender, age and tissue characterization are reported for each individual (patient) and are viewable when clicking on the image for magnification.
The images can be clicked for an enlarged view that can be panned. From the enlarged view, all stained images for all antibodies can be browsed (represented by miniature images). The miniature image with an orange overlay is the currently displayed image.
This score describes the level of antibody staining observed in the annotated cell types as not detected, low, medium, or high. It is based on the staining intensity and fraction of stained cells.
The RNA-seq details section shows detailed information about the individual samples used for the transcript profiling and results of the RNA-seq analysis.
Information about each individual sample is listed below, including gender, age, a tissue section image and estimated fractions of cell types. TPM (transcripts per million) values give a quantification of the gene abundance which is comparable between different genes and samples.
RNA-Seq data is reported as average RPKM (reads per kilobase per million mapped reads), generated by the Genotype-Tissue Expression (GTEx) project. More information can be found on the GTEx portal.
Normal distribution across the dataset is visualized with box plots, shown as median and 25th and 75th percentiles. Points are displayed as outliers if they are above or below 1.5 times the interquartile range. RPKM values of the individual samples are presented next to the box plot.
Max RPKM: 1944.3
Min RPKM: 649.2
Std RPKM: 266.4
Median RPKM: 1078.1
GTEX-WWYW-2726-SM-4MVOP
50-59 years, female
1944.3
GTEX-13OVJ-2426-SM-5KM3I
50-59 years, female
1789.5
GTEX-13OVI-0726-SM-5L3DD
60-69 years, female
1788.5
GTEX-ZVT3-2626-SM-5GU5L
60-69 years, female
1722.9
GTEX-12WSB-2226-SM-5GCOS
60-69 years, female
1649.0
GTEX-12ZZX-2026-SM-5LZV9
40-49 years, female
1635.9
GTEX-X8HC-2726-SM-46MUA
50-59 years, female
1598.4
GTEX-RTLS-2326-SM-46MUH
60-69 years, female
1581.7
GTEX-QVJO-3126-SM-4R1KC
60-69 years, female
1559.7
GTEX-11ZVC-1426-SM-5EGGA
50-59 years, female
1544.3
GTEX-TSE9-2226-SM-4DXUR
60-69 years, female
1528.7
GTEX-1269C-1826-SM-5N9E1
60-69 years, female
1520.3
GTEX-11ZTS-1926-SM-5CVLA
60-69 years, female
1490.2
GTEX-11EMC-1726-SM-5H11P
60-69 years, female
1487.8
GTEX-YFC4-2726-SM-5IFJW
40-49 years, female
1480.9
GTEX-XMD3-2326-SM-4AT5H
50-59 years, female
1456.6
GTEX-1313W-2726-SM-5P9IX
50-59 years, female
1449.5
GTEX-ZAJG-2726-SM-5S2MU
50-59 years, female
1438.7
GTEX-PLZ4-2826-SM-3P617
50-59 years, female
1412.3
GTEX-13U4I-2126-SM-5LU55
40-49 years, female
1385.1
GTEX-YJ8O-1026-SM-5CVM5
40-49 years, female
1331.8
GTEX-RU72-2226-SM-46MUE
50-59 years, female
1324.5
GTEX-13X6H-1026-SM-5SIBE
50-59 years, female
1299.1
GTEX-131YS-2226-SM-5P9G8
60-69 years, female
1279.0
GTEX-14AS3-1326-SM-5RQJE
40-49 years, female
1276.6
GTEX-OHPK-2426-SM-3MJGH
50-59 years, female
1261.6
GTEX-13QIC-1526-SM-5IJFL
60-69 years, female
1256.7
GTEX-T2IS-2026-SM-4DM6W
20-29 years, female
1244.6
GTEX-ZVT2-0326-SM-5E44G
50-59 years, female
1227.9
GTEX-11P81-1526-SM-5P9GS
30-39 years, female
1221.4
GTEX-P78B-1926-SM-3P616
40-49 years, female
1202.0
GTEX-11EM3-1726-SM-5N9D1
20-29 years, female
1164.6
GTEX-ZC5H-2026-SM-5CVN2
40-49 years, female
1163.7
GTEX-11GSP-0226-SM-5A5KV
60-69 years, female
1159.5
GTEX-13PL7-2326-SM-5L3FY
60-69 years, female
1152.6
GTEX-W5WG-0926-SM-4RTX9
50-59 years, female
1149.8
GTEX-12WSD-2726-SM-59HLR
60-69 years, female
1147.1
GTEX-XUJ4-1326-SM-4BOQ9
60-69 years, female
1135.4
GTEX-12WSK-1926-SM-5LZVK
40-49 years, female
1129.9
GTEX-139D8-2426-SM-5KM3A
30-39 years, female
1123.6
GTEX-Y3IK-2026-SM-4YCDG
50-59 years, female
1123.0
GTEX-S32W-1226-SM-4AD67
50-59 years, female
1113.4
GTEX-PX3G-2426-SM-48TZZ
20-29 years, female
1106.0
GTEX-145ME-1226-SM-5SIB6
40-49 years, female
1104.5
GTEX-11VI4-1026-SM-5EQM1
40-49 years, female
1103.9
GTEX-11XUK-1626-SM-5GU5O
40-49 years, female
1097.1
GTEX-13O3O-2726-SM-5KM35
60-69 years, female
1092.9
GTEX-P4PP-2426-SM-3P61L
30-39 years, female
1089.2
GTEX-U3ZN-1026-SM-4DXTC
30-39 years, female
1078.1
GTEX-XUW1-0126-SM-4BOOQ
50-59 years, female
1074.5
GTEX-S4P3-0926-SM-4AD54
50-59 years, female
1063.1
GTEX-PWCY-1326-SM-48TCU
20-29 years, female
1051.8
GTEX-12WSJ-1226-SM-5LU91
40-49 years, female
1050.6
GTEX-ZYWO-1926-SM-5E456
40-49 years, female
1030.9
GTEX-ZPIC-1426-SM-4WWCP
40-49 years, female
1028.4
GTEX-ZP4G-0626-SM-4WWF1
20-29 years, female
1027.7
GTEX-132AR-1426-SM-5IFF1
50-59 years, female
1026.7
GTEX-11I78-1926-SM-59878
50-59 years, female
1019.6
GTEX-ZYFG-1726-SM-5GZZB
60-69 years, female
1019.3
GTEX-133LE-1226-SM-5IFGC
20-29 years, female
1014.0
GTEX-ZZPU-2126-SM-5EGIU
50-59 years, female
1012.6
GTEX-S341-0726-SM-4AD5R
40-49 years, female
1012.3
GTEX-13D11-1126-SM-5KLYS
50-59 years, female
1008.9
GTEX-X4EO-2426-SM-4QASD
60-69 years, female
1008.8
GTEX-PWN1-2426-SM-48TDD
40-49 years, female
1005.5
GTEX-13QBU-1526-SM-5LU3W
40-49 years, female
1003.3
GTEX-ZYY3-2726-SM-5EGH4
60-69 years, female
1000.4
GTEX-12WSG-1426-SM-5FQUK
50-59 years, female
997.3
GTEX-POMQ-1426-SM-3P61D
20-29 years, female
988.4
GTEX-X15G-1726-SM-4PQZN
50-59 years, female
981.1
GTEX-13VXT-1526-SM-5LU3J
20-29 years, female
972.3
GTEX-RWS6-1026-SM-47JXD
60-69 years, female
969.8
GTEX-T5JW-0426-SM-4DM7M
20-29 years, female
969.0
GTEX-T6MO-1126-SM-4DM5D
40-49 years, female
952.2
GTEX-TMMY-1726-SM-4DXTD
40-49 years, female
947.7
GTEX-WI4N-2526-SM-4OOSE
40-49 years, female
945.8
GTEX-11DXX-1426-SM-5GIDU
60-69 years, female
942.8
GTEX-13N11-0526-SM-5IJFI
50-59 years, female
929.6
GTEX-XYKS-1726-SM-4E3IO
60-69 years, female
921.4
GTEX-OHPL-2426-SM-48TDN
60-69 years, female
918.2
GTEX-XV7Q-1426-SM-4BRWA
40-49 years, female
917.9
GTEX-13W3W-1526-SM-5LU5I
60-69 years, female
901.5
GTEX-P4QT-2426-SM-3NMCL
50-59 years, female
888.7
GTEX-13PVR-1226-SM-5RQJ2
60-69 years, female
865.8
GTEX-ZLWG-0926-SM-4WWC3
50-59 years, female
865.5
GTEX-QCQG-1426-SM-48U22
50-59 years, female
863.4
GTEX-Q734-0726-SM-48TZP
40-49 years, female
855.7
GTEX-13FTX-0926-SM-5IFF7
20-29 years, female
843.8
GTEX-UJHI-1226-SM-4IHLR
50-59 years, female
840.0
GTEX-XUZC-1026-SM-4BOPY
30-39 years, female
827.6
GTEX-S7SF-1326-SM-4AD4P
20-29 years, female
805.4
GTEX-TML8-0926-SM-4DXSJ
40-49 years, female
805.3
GTEX-Y114-1726-SM-4TT7U
50-59 years, female
796.2
GTEX-11ZTT-1826-SM-5CVLN
60-69 years, female
777.0
GTEX-146FH-2526-SM-5Q5BP
50-59 years, female
722.5
GTEX-1399S-2126-SM-5J2MH
30-39 years, female
700.6
GTEX-RU1J-0826-SM-46MUU
20-29 years, female
649.2
Show all
OVARY - FANTOM5 CAGEi
Tissue data obtained through Cap Analysis of Gene Expression (CAGE) are reported as Tags Per Million, generated by the FANTOM5 project. More information can be found here.
 The Human Protein Atlas project is funded


 MENU
MENU