We use cookies to enhance the usability of our website. If you continue, we'll assume that you are happy to receive all cookies. More information. Don't show this again.
The protein expression bar, with the units not detected (n), low (l), medium (m) and high (h), is based on a best estimate of the true protein expression for proteins where the antibody staining pattern has been analyzed by knowledge-based annotation. For genes where more than one antibody has been used, a collective score is set. For details, see Assays & annotation.
h
m
l
n
RNA expressioni
RNA expression shows average values based on RNA-seq data generated by HPA, the Genotype-Tissue Expression (GTEx) consortium or the FANTOM5 consortium.
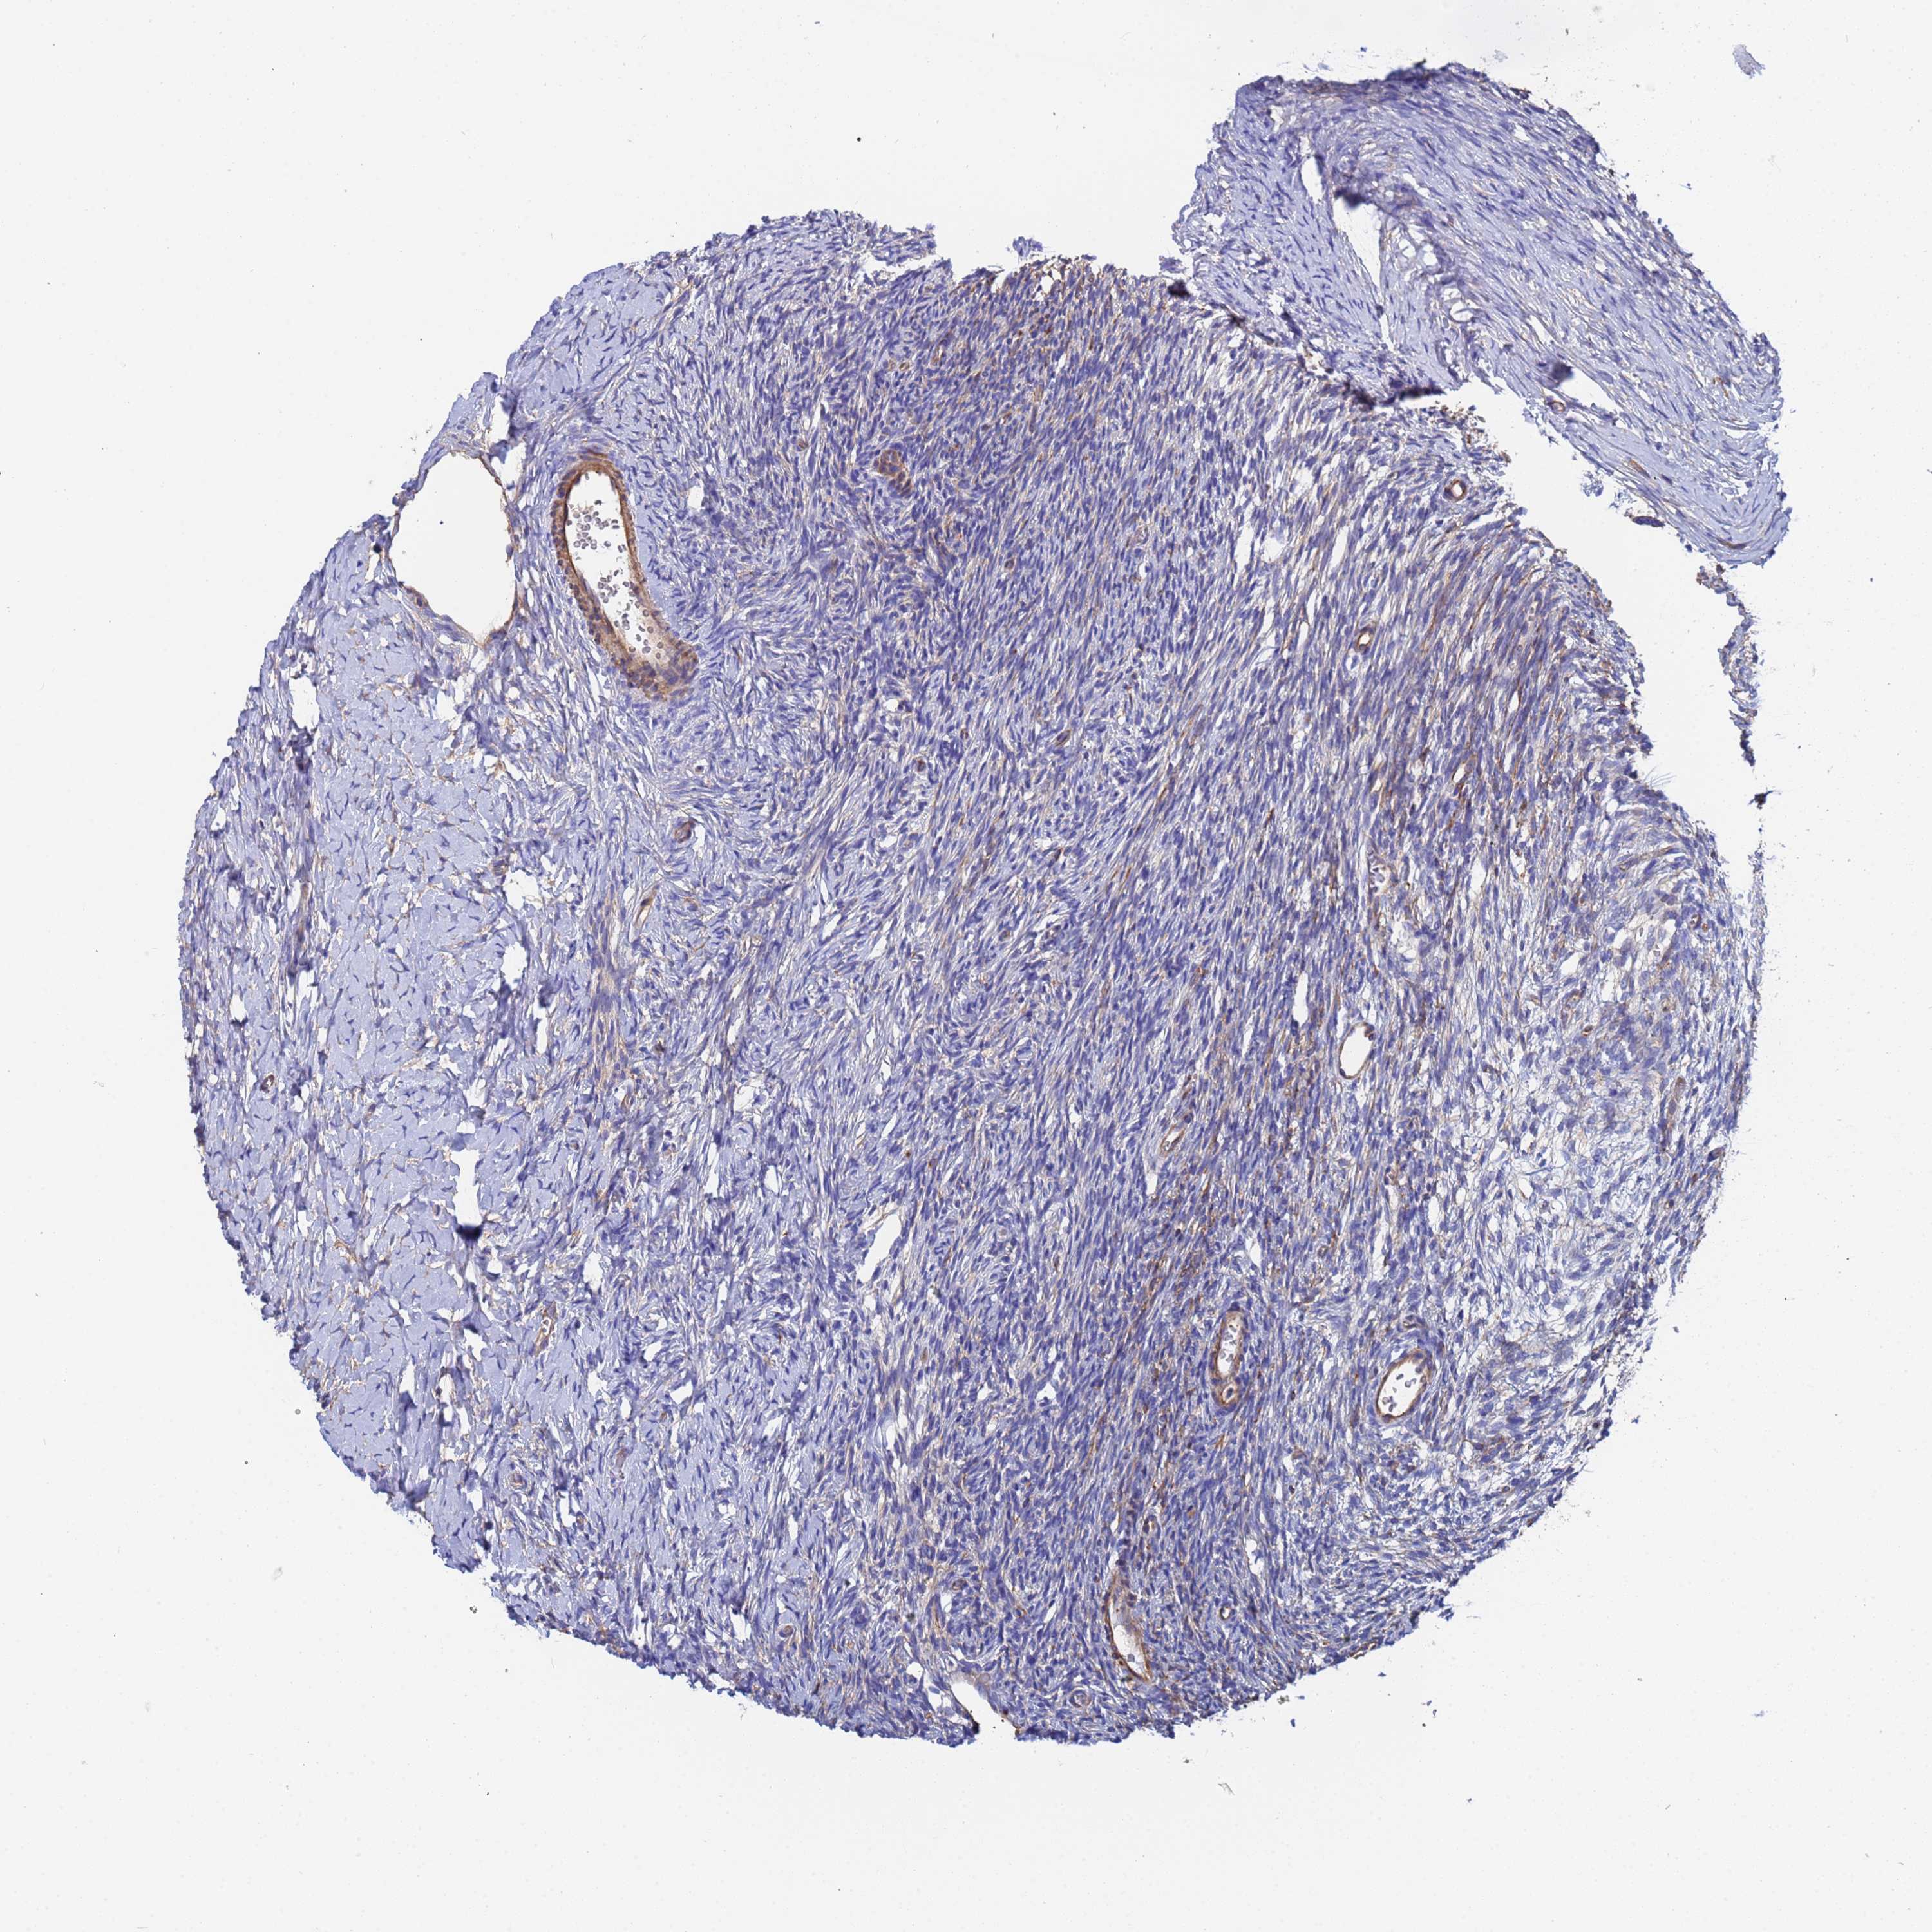
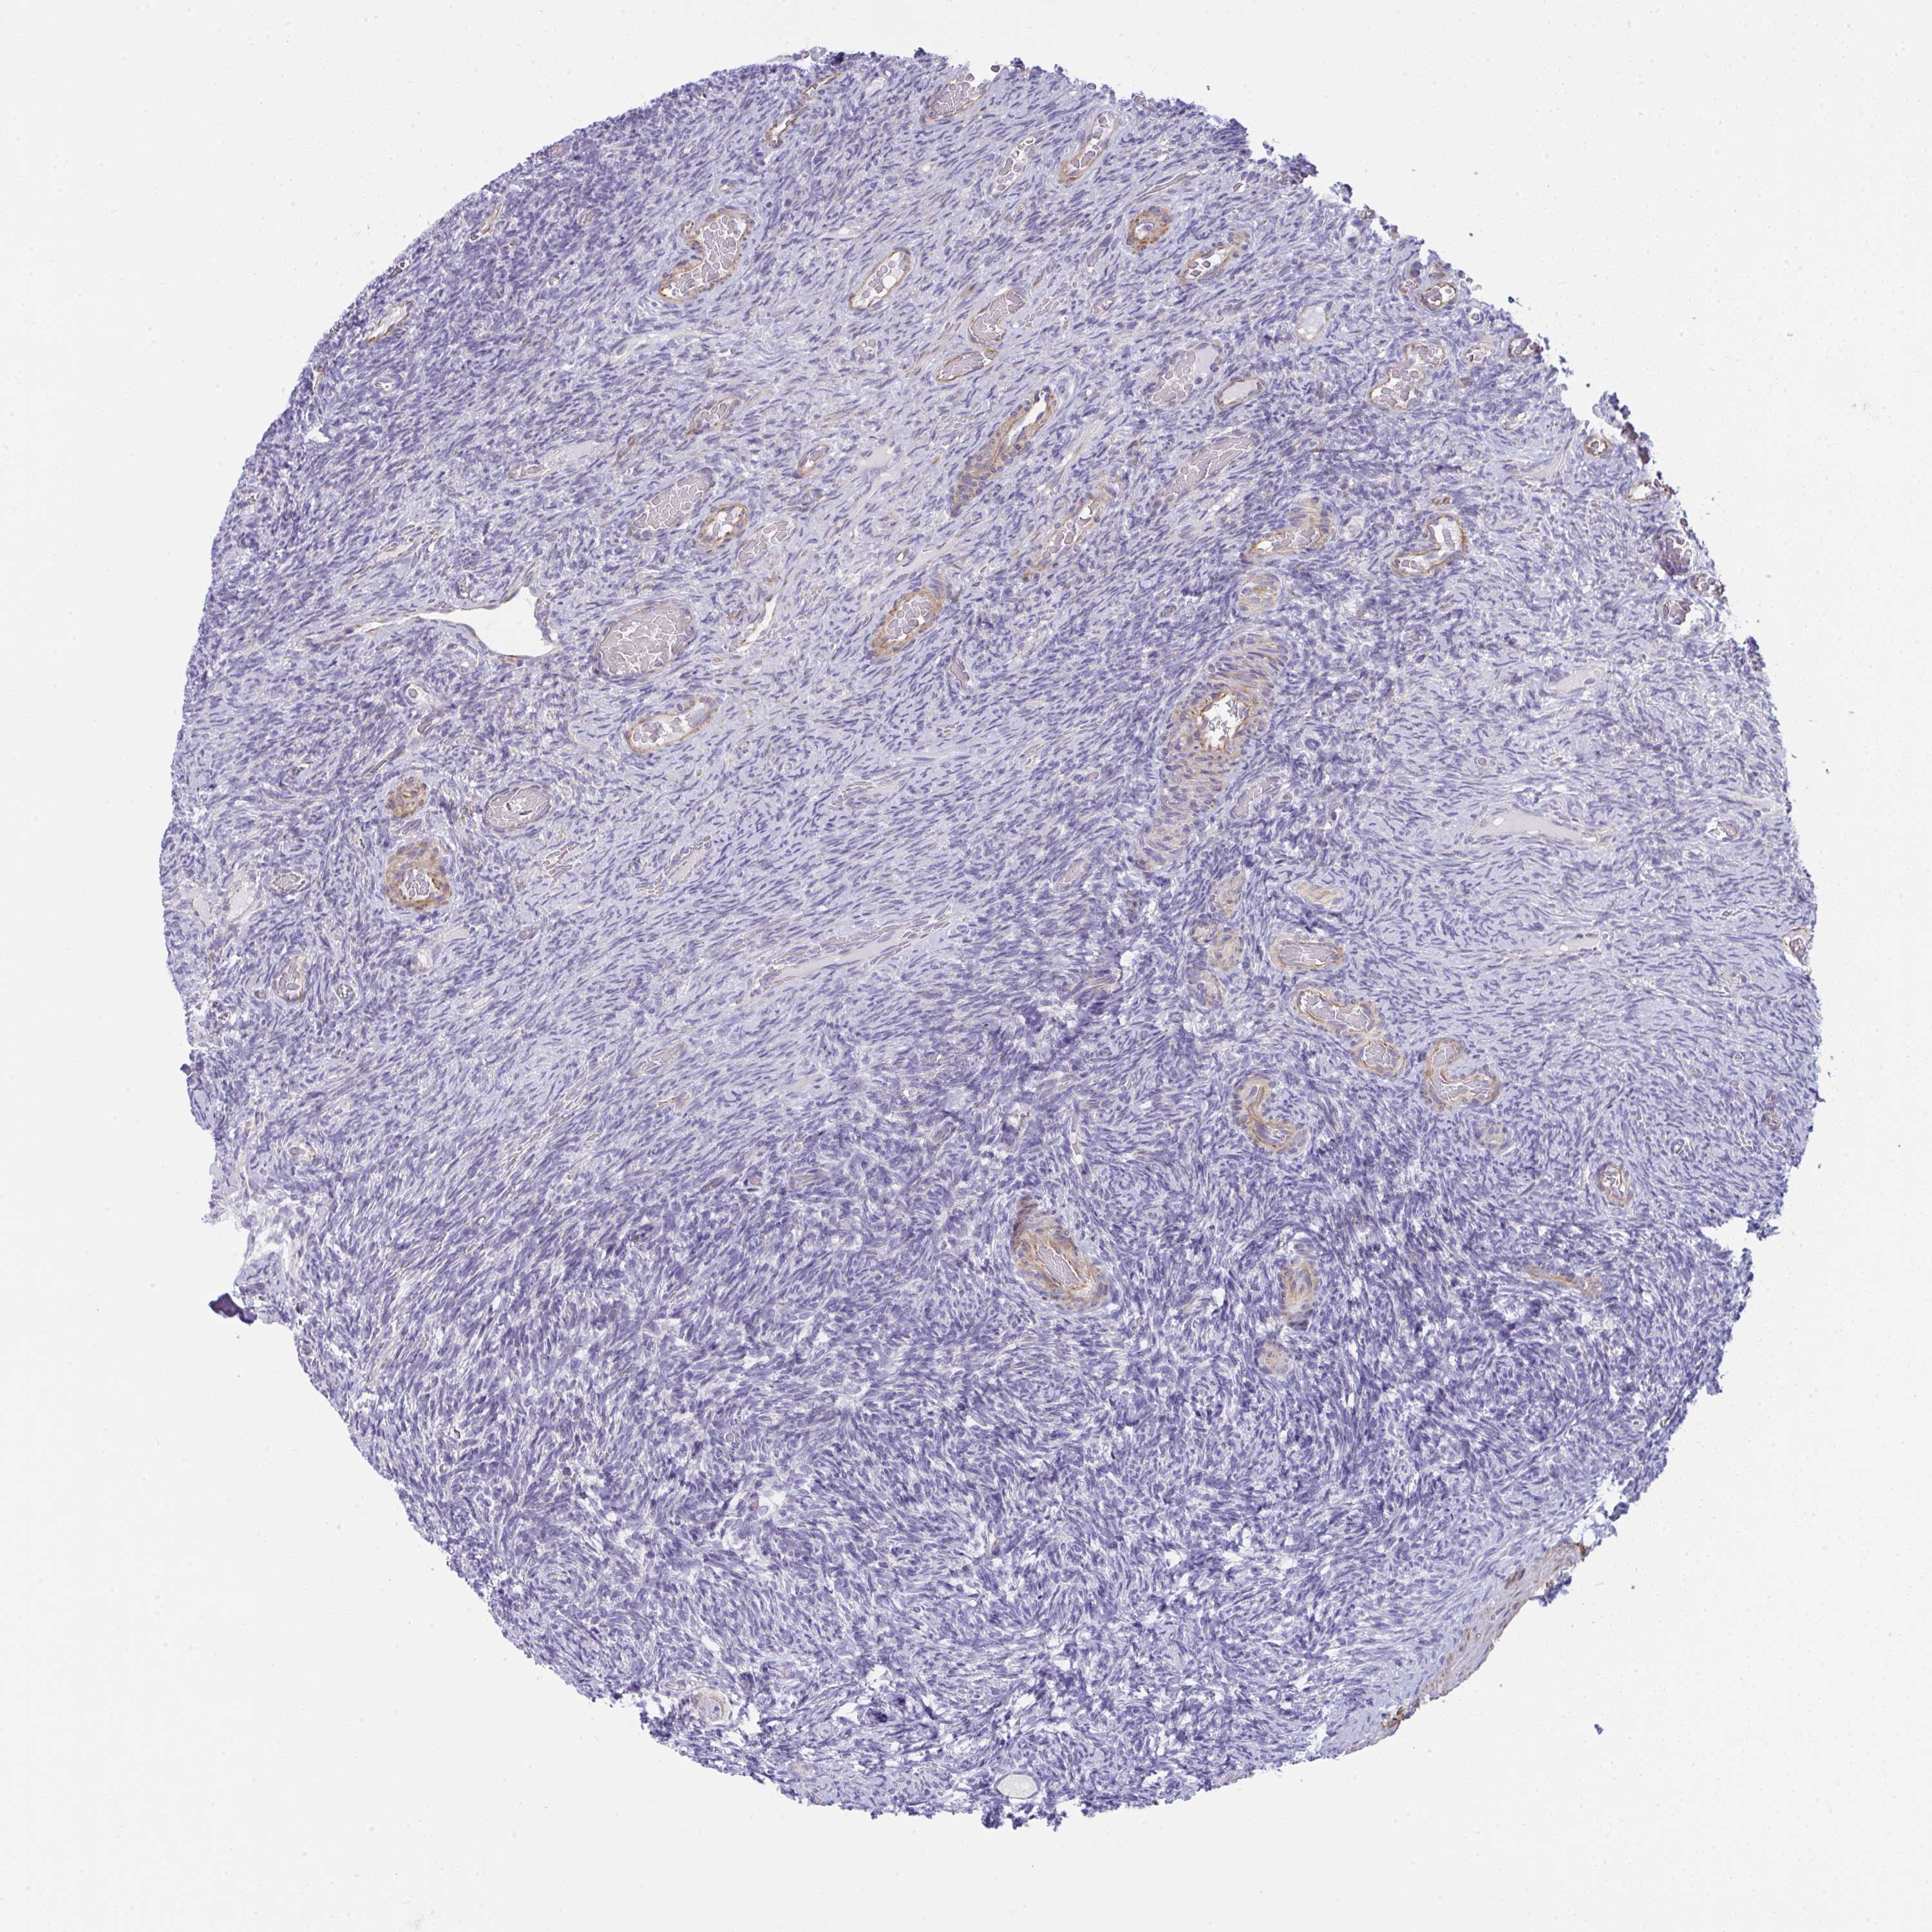
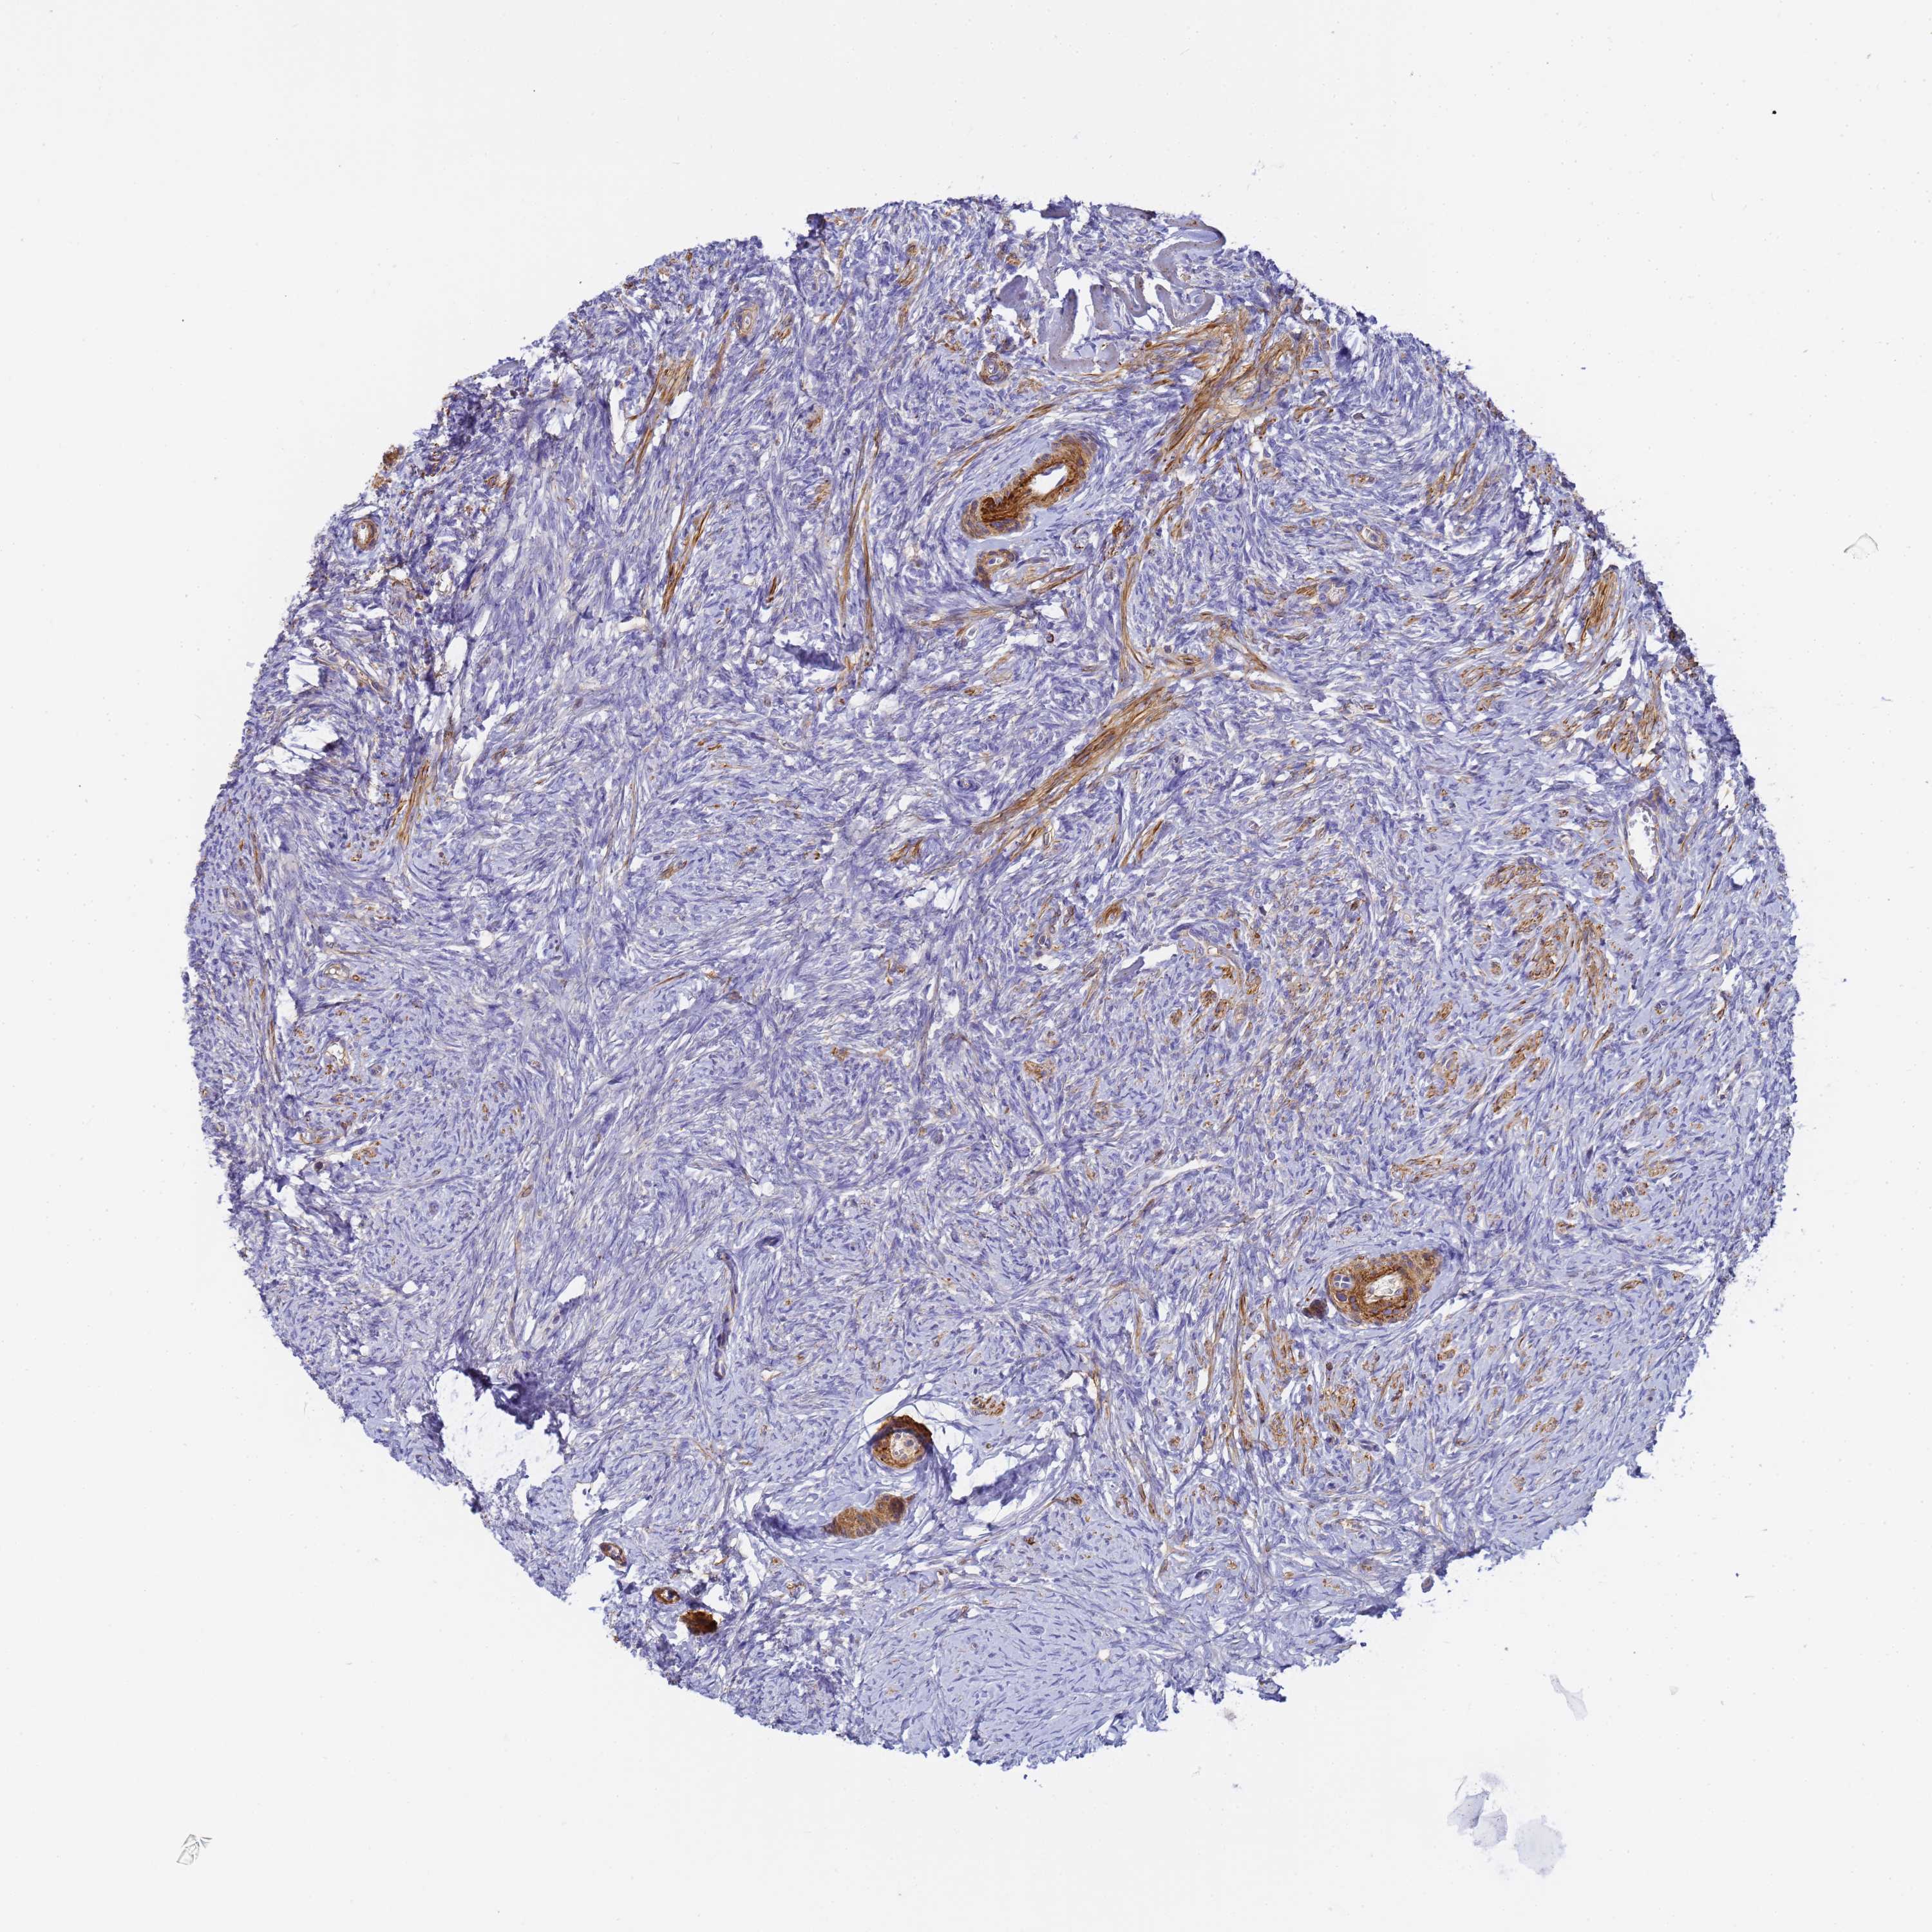
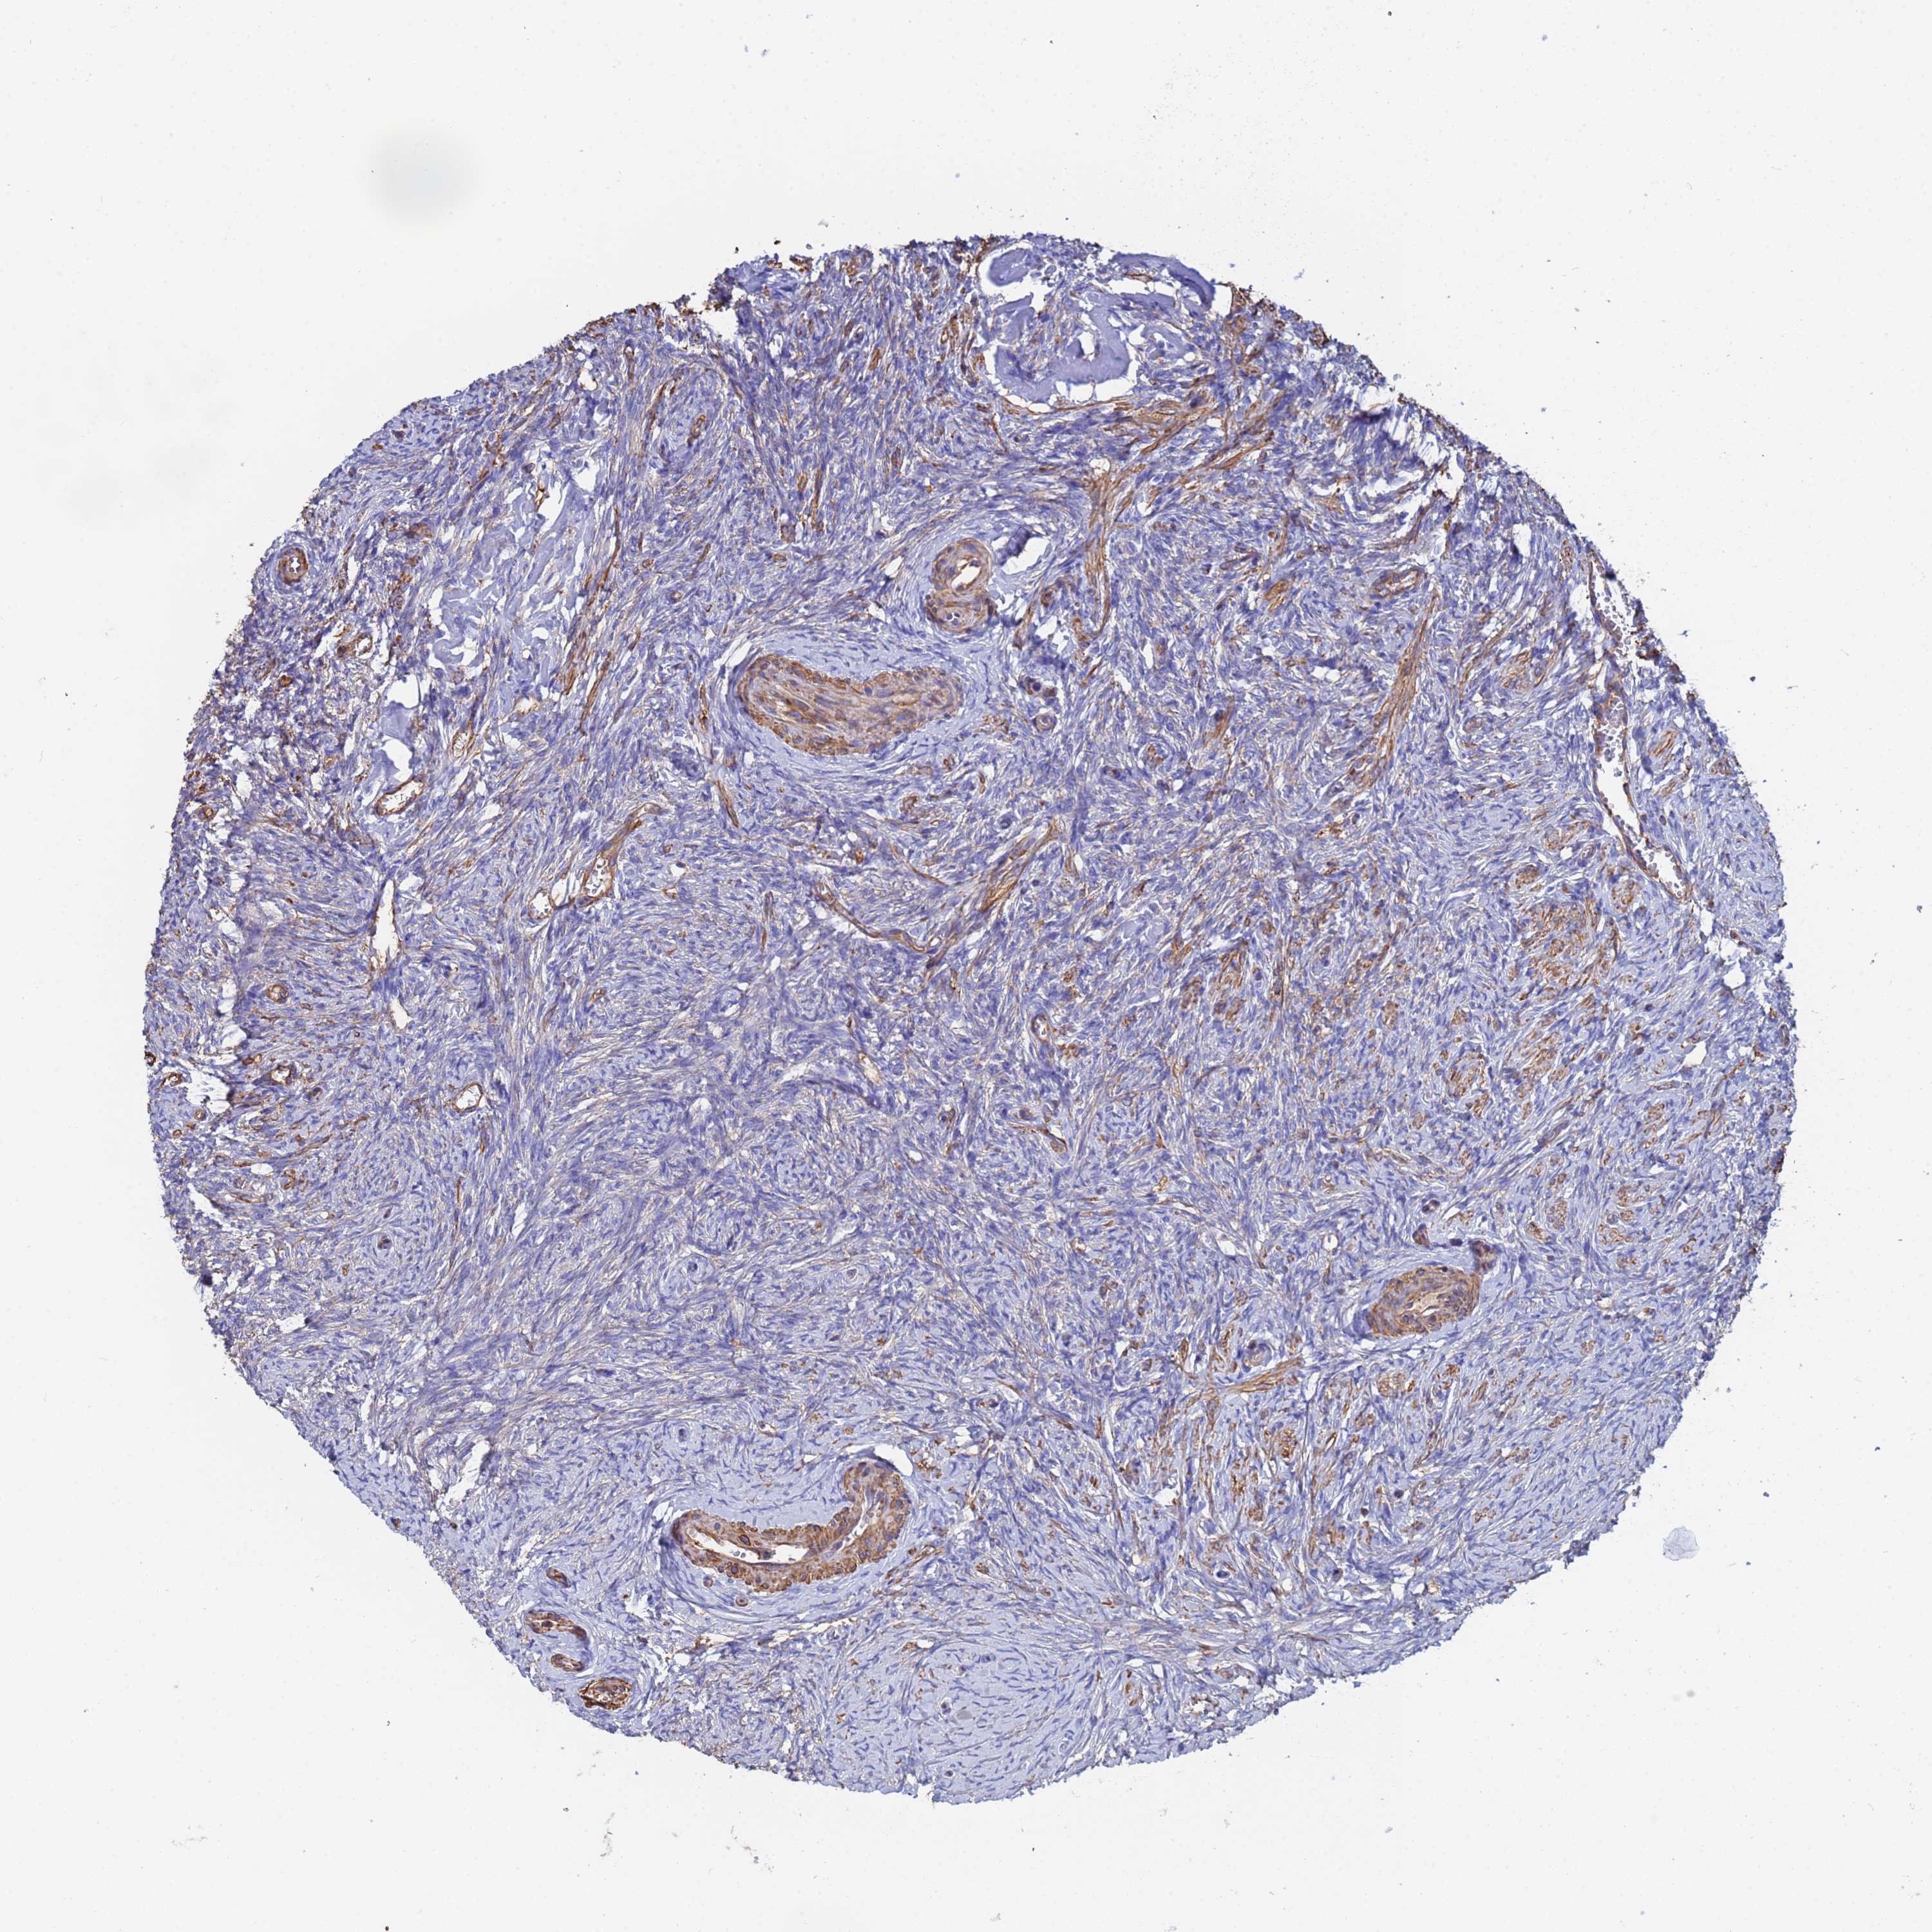
The detailed normal tissue page shows images of the stained tissue, together with antibody staining and expression level of the cell types. A knowledge-based annotated protein expression is provided for each cell type at the top of the page and the staining level of the individual antibodies is given underneath each antibody ID.
Samples from up to three different individuals have been stained for each antibody. The gender, age and tissue characterization are reported for each individual (patient) and are viewable when clicking on the image for magnification.
The images can be clicked for an enlarged view that can be panned. From the enlarged view, all stained images for all antibodies can be browsed (represented by miniature images). The miniature image with an orange overlay is the currently displayed image.
This score describes the level of antibody staining observed in the annotated cell types as not detected, low, medium, or high. It is based on the staining intensity and fraction of stained cells.
The RNA-seq details section shows detailed information about the individual samples used for the transcript profiling and results of the RNA-seq analysis.
Information about each individual sample is listed below, including gender, age, a tissue section image and estimated fractions of cell types. TPM (transcripts per million) values give a quantification of the gene abundance which is comparable between different genes and samples.
RNA-Seq data is reported as average RPKM (reads per kilobase per million mapped reads), generated by the Genotype-Tissue Expression (GTEx) project. More information can be found on the GTEx portal.
Normal distribution across the dataset is visualized with box plots, shown as median and 25th and 75th percentiles. Points are displayed as outliers if they are above or below 1.5 times the interquartile range. RPKM values of the individual samples are presented next to the box plot.
Max RPKM: 976.4
Min RPKM: 121.2
Std RPKM: 166.8
Median RPKM: 354.5
GTEX-1399S-2126-SM-5J2MH
30-39 years, female
976.4
GTEX-X4EO-2426-SM-4QASD
60-69 years, female
920.8
GTEX-Y114-1726-SM-4TT7U
50-59 years, female
832.2
GTEX-QCQG-1426-SM-48U22
50-59 years, female
825.7
GTEX-XUZC-1026-SM-4BOPY
30-39 years, female
807.5
GTEX-13D11-1126-SM-5KLYS
50-59 years, female
803.4
GTEX-T6MO-1126-SM-4DM5D
40-49 years, female
660.5
GTEX-WI4N-2526-SM-4OOSE
40-49 years, female
631.9
GTEX-PLZ4-2826-SM-3P617
50-59 years, female
584.2
GTEX-XUJ4-1326-SM-4BOQ9
60-69 years, female
582.8
GTEX-PX3G-2426-SM-48TZZ
20-29 years, female
568.7
GTEX-13VXT-1526-SM-5LU3J
20-29 years, female
562.1
GTEX-13OVJ-2426-SM-5KM3I
50-59 years, female
554.5
GTEX-ZC5H-2026-SM-5CVN2
40-49 years, female
552.1
GTEX-P4QT-2426-SM-3NMCL
50-59 years, female
540.2
GTEX-ZP4G-0626-SM-4WWF1
20-29 years, female
527.3
GTEX-ZYFG-1726-SM-5GZZB
60-69 years, female
526.8
GTEX-P4PP-2426-SM-3P61L
30-39 years, female
525.6
GTEX-11ZTT-1826-SM-5CVLN
60-69 years, female
516.3
GTEX-13PVR-1226-SM-5RQJ2
60-69 years, female
497.1
GTEX-X8HC-2726-SM-46MUA
50-59 years, female
497.0
GTEX-TML8-0926-SM-4DXSJ
40-49 years, female
495.9
GTEX-12WSG-1426-SM-5FQUK
50-59 years, female
481.5
GTEX-11DXX-1426-SM-5GIDU
60-69 years, female
476.6
GTEX-POMQ-1426-SM-3P61D
20-29 years, female
464.8
GTEX-T5JW-0426-SM-4DM7M
20-29 years, female
454.7
GTEX-TMMY-1726-SM-4DXTD
40-49 years, female
453.3
GTEX-QVJO-3126-SM-4R1KC
60-69 years, female
452.0
GTEX-X15G-1726-SM-4PQZN
50-59 years, female
447.5
GTEX-Y3IK-2026-SM-4YCDG
50-59 years, female
439.0
GTEX-131YS-2226-SM-5P9G8
60-69 years, female
436.1
GTEX-XYKS-1726-SM-4E3IO
60-69 years, female
435.2
GTEX-12WSD-2726-SM-59HLR
60-69 years, female
434.4
GTEX-12WSJ-1226-SM-5LU91
40-49 years, female
432.3
GTEX-XMD3-2326-SM-4AT5H
50-59 years, female
426.5
GTEX-ZZPU-2126-SM-5EGIU
50-59 years, female
423.3
GTEX-12ZZX-2026-SM-5LZV9
40-49 years, female
410.3
GTEX-ZLWG-0926-SM-4WWC3
50-59 years, female
407.8
GTEX-13QBU-1526-SM-5LU3W
40-49 years, female
403.9
GTEX-11VI4-1026-SM-5EQM1
40-49 years, female
401.7
GTEX-S341-0726-SM-4AD5R
40-49 years, female
395.5
GTEX-11I78-1926-SM-59878
50-59 years, female
391.7
GTEX-S4P3-0926-SM-4AD54
50-59 years, female
380.4
GTEX-ZVT2-0326-SM-5E44G
50-59 years, female
378.0
GTEX-RU72-2226-SM-46MUE
50-59 years, female
374.9
GTEX-146FH-2526-SM-5Q5BP
50-59 years, female
364.8
GTEX-133LE-1226-SM-5IFGC
20-29 years, female
360.5
GTEX-S7SF-1326-SM-4AD4P
20-29 years, female
359.7
GTEX-12WSK-1926-SM-5LZVK
40-49 years, female
354.5
GTEX-UJHI-1226-SM-4IHLR
50-59 years, female
348.8
GTEX-11ZVC-1426-SM-5EGGA
50-59 years, female
345.5
GTEX-RU1J-0826-SM-46MUU
20-29 years, female
337.1
GTEX-TSE9-2226-SM-4DXUR
60-69 years, female
335.2
GTEX-13OVI-0726-SM-5L3DD
60-69 years, female
331.8
GTEX-1269C-1826-SM-5N9E1
60-69 years, female
328.3
GTEX-13W3W-1526-SM-5LU5I
60-69 years, female
327.8
GTEX-RWS6-1026-SM-47JXD
60-69 years, female
325.8
GTEX-YFC4-2726-SM-5IFJW
40-49 years, female
322.8
GTEX-YJ8O-1026-SM-5CVM5
40-49 years, female
322.2
GTEX-1313W-2726-SM-5P9IX
50-59 years, female
320.1
GTEX-OHPL-2426-SM-48TDN
60-69 years, female
319.0
GTEX-PWN1-2426-SM-48TDD
40-49 years, female
314.1
GTEX-13N11-0526-SM-5IJFI
50-59 years, female
310.9
GTEX-13X6H-1026-SM-5SIBE
50-59 years, female
310.7
GTEX-145ME-1226-SM-5SIB6
40-49 years, female
309.5
GTEX-11ZTS-1926-SM-5CVLA
60-69 years, female
303.2
GTEX-11P81-1526-SM-5P9GS
30-39 years, female
300.8
GTEX-13O3O-2726-SM-5KM35
60-69 years, female
294.6
GTEX-XUW1-0126-SM-4BOOQ
50-59 years, female
293.6
GTEX-W5WG-0926-SM-4RTX9
50-59 years, female
292.0
GTEX-Q734-0726-SM-48TZP
40-49 years, female
290.9
GTEX-13QIC-1526-SM-5IJFL
60-69 years, female
286.9
GTEX-U3ZN-1026-SM-4DXTC
30-39 years, female
286.4
GTEX-ZPIC-1426-SM-4WWCP
40-49 years, female
280.0
GTEX-ZYY3-2726-SM-5EGH4
60-69 years, female
276.5
GTEX-P78B-1926-SM-3P616
40-49 years, female
272.5
GTEX-13U4I-2126-SM-5LU55
40-49 years, female
270.3
GTEX-12WSB-2226-SM-5GCOS
60-69 years, female
258.2
GTEX-11EMC-1726-SM-5H11P
60-69 years, female
255.2
GTEX-RTLS-2326-SM-46MUH
60-69 years, female
246.0
GTEX-XV7Q-1426-SM-4BRWA
40-49 years, female
245.6
GTEX-ZVT3-2626-SM-5GU5L
60-69 years, female
241.6
GTEX-T2IS-2026-SM-4DM6W
20-29 years, female
240.7
GTEX-139D8-2426-SM-5KM3A
30-39 years, female
234.9
GTEX-13FTX-0926-SM-5IFF7
20-29 years, female
229.4
GTEX-11GSP-0226-SM-5A5KV
60-69 years, female
226.6
GTEX-11EM3-1726-SM-5N9D1
20-29 years, female
225.5
GTEX-OHPK-2426-SM-3MJGH
50-59 years, female
219.3
GTEX-11XUK-1626-SM-5GU5O
40-49 years, female
215.9
GTEX-WWYW-2726-SM-4MVOP
50-59 years, female
209.6
GTEX-13PL7-2326-SM-5L3FY
60-69 years, female
205.6
GTEX-PWCY-1326-SM-48TCU
20-29 years, female
203.2
GTEX-ZYWO-1926-SM-5E456
40-49 years, female
189.8
GTEX-S32W-1226-SM-4AD67
50-59 years, female
179.3
GTEX-14AS3-1326-SM-5RQJE
40-49 years, female
170.2
GTEX-ZAJG-2726-SM-5S2MU
50-59 years, female
158.2
GTEX-132AR-1426-SM-5IFF1
50-59 years, female
121.2
Show all
OVARY - FANTOM5 CAGEi
Tissue data obtained through Cap Analysis of Gene Expression (CAGE) are reported as Tags Per Million, generated by the FANTOM5 project. More information can be found here.
 The Human Protein Atlas project is funded


 MENU
MENU