We use cookies to enhance the usability of our website. If you continue, we'll assume that you are happy to receive all cookies. More information. Don't show this again.
The protein expression bar, with the units not detected (n), low (l), medium (m) and high (h), is based on a best estimate of the true protein expression for proteins where the antibody staining pattern has been analyzed by knowledge-based annotation. For genes where more than one antibody has been used, a collective score is set. For details, see Assays & annotation.
h
m
l
n
RNA expressioni
RNA expression shows average values based on RNA-seq data generated by HPA, the Genotype-Tissue Expression (GTEx) consortium or the FANTOM5 consortium.
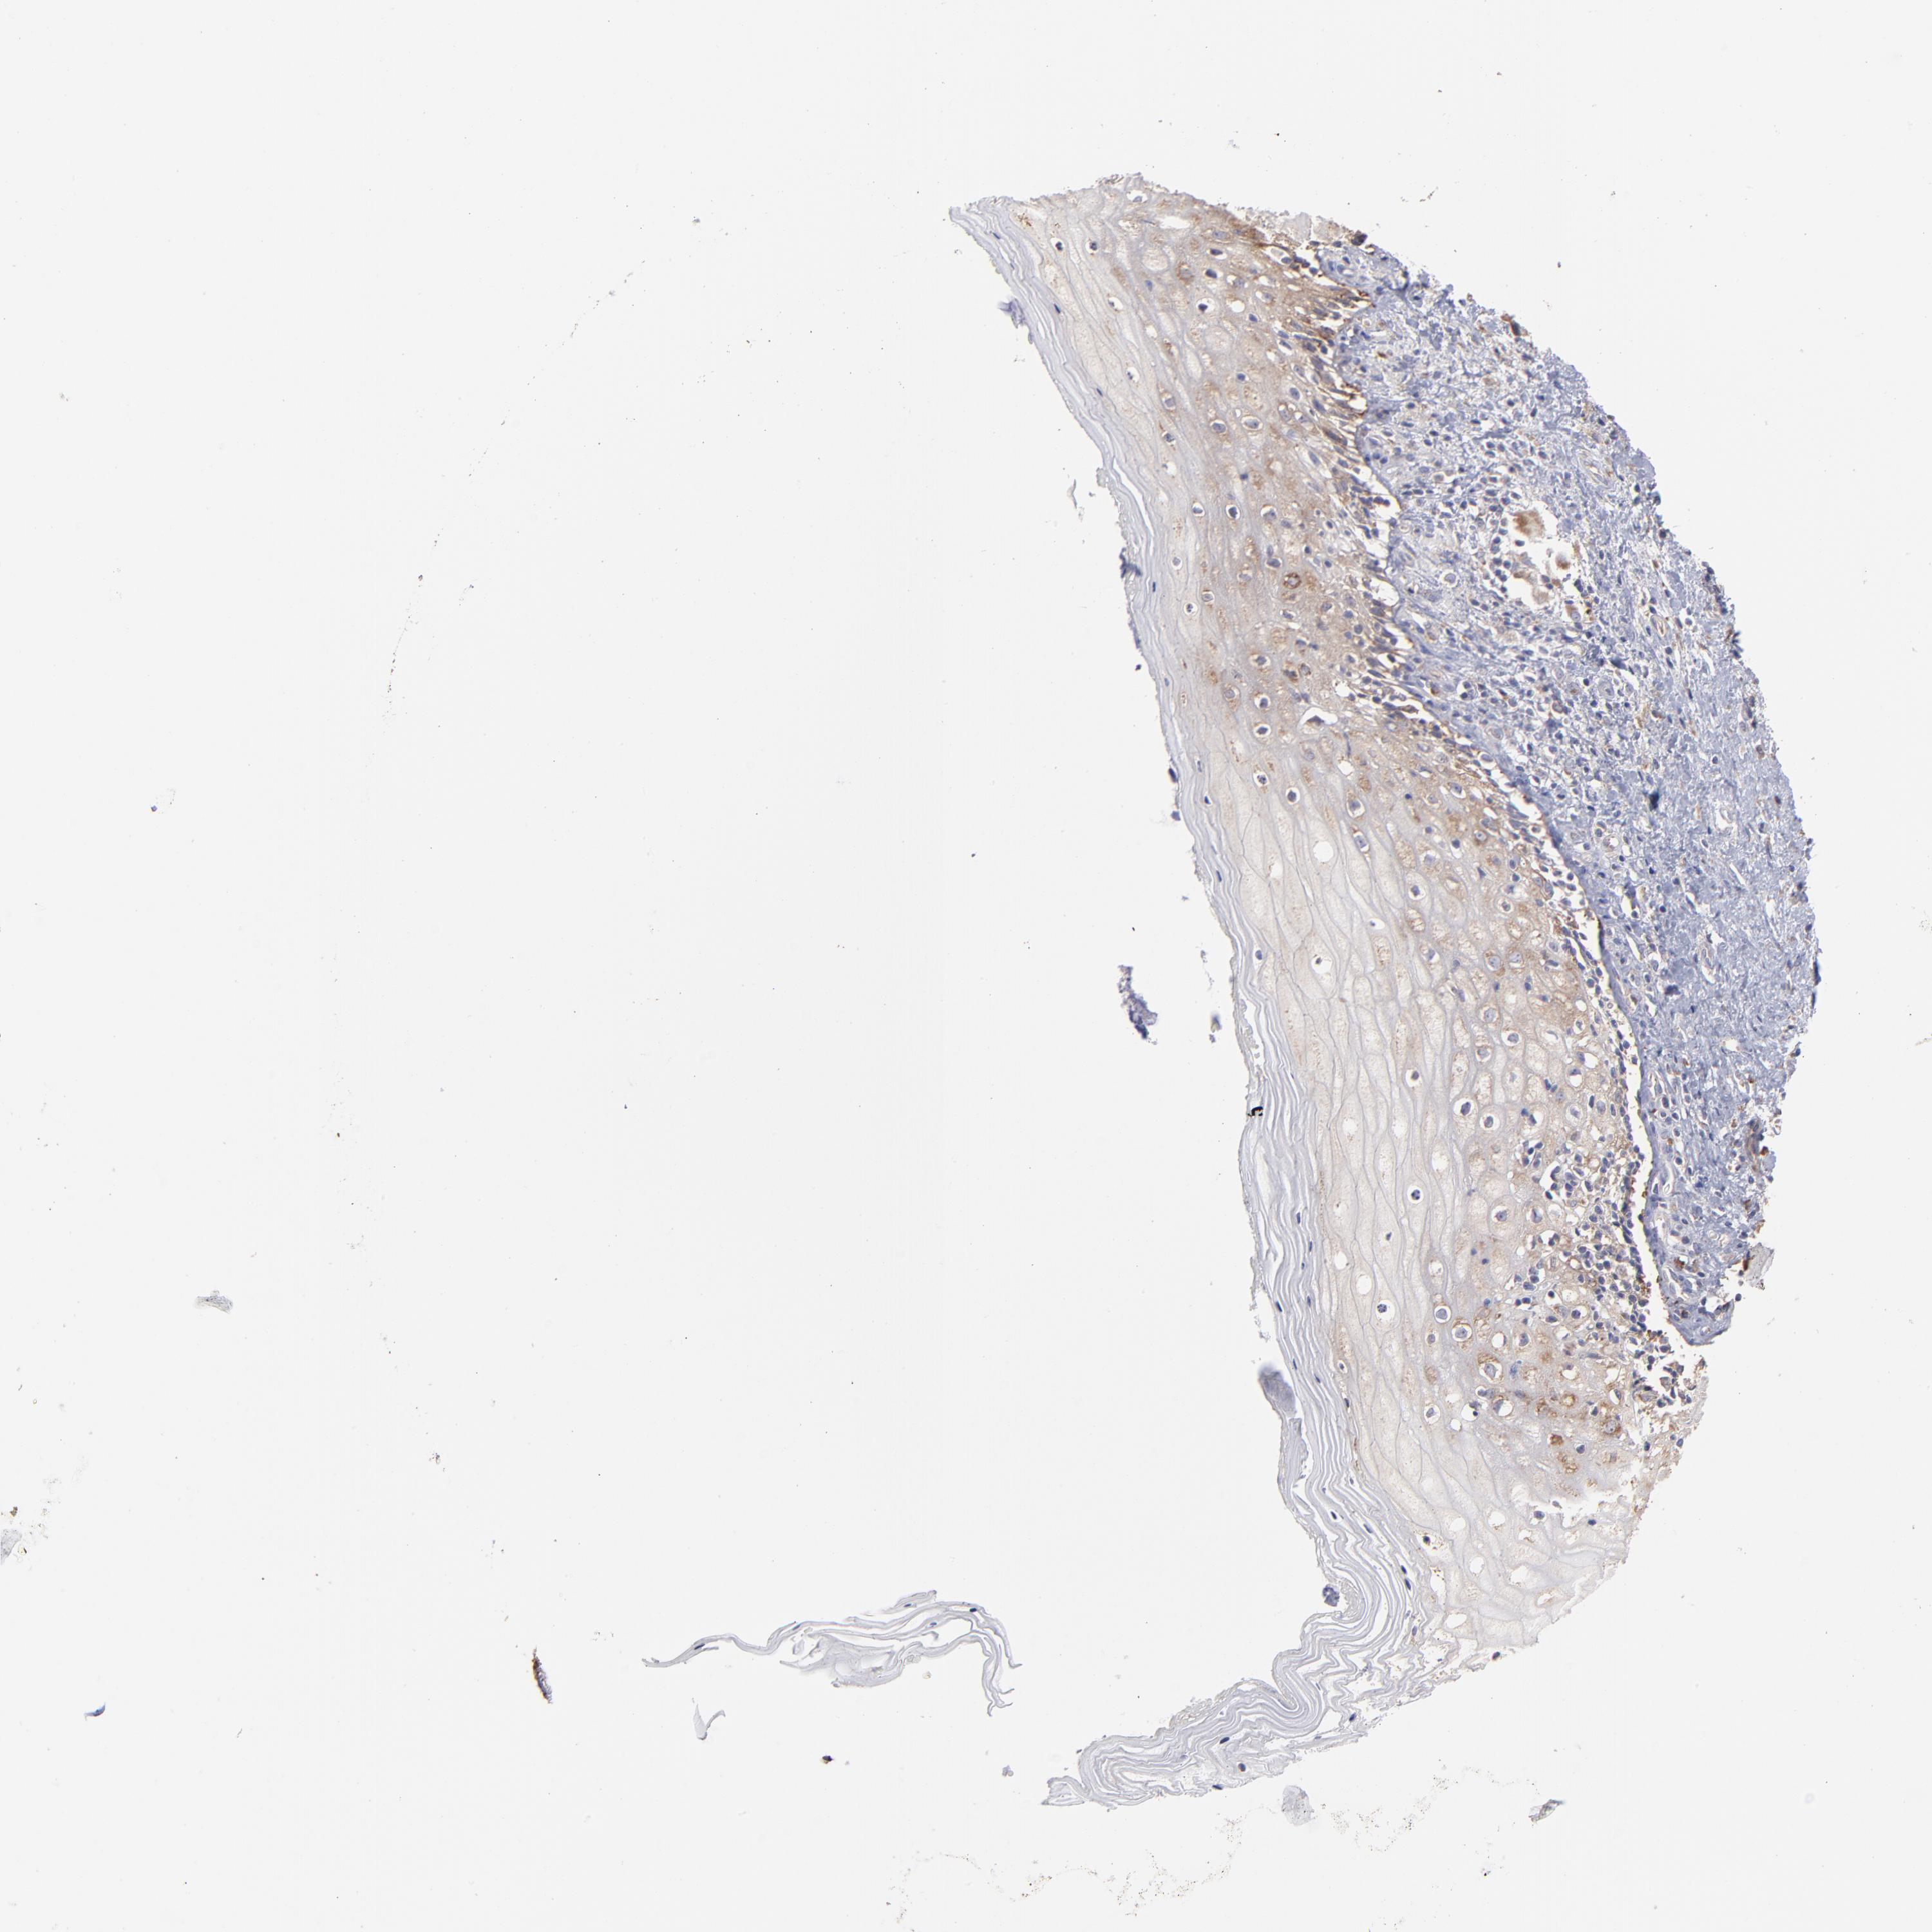
The detailed normal tissue page shows images of the stained tissue, together with antibody staining and expression level of the cell types. A knowledge-based annotated protein expression is provided for each cell type at the top of the page and the staining level of the individual antibodies is given underneath each antibody ID.
Samples from up to three different individuals have been stained for each antibody. The gender, age and tissue characterization are reported for each individual (patient) and are viewable when clicking on the image for magnification.
The images can be clicked for an enlarged view that can be panned. From the enlarged view, all stained images for all antibodies can be browsed (represented by miniature images). The miniature image with an orange overlay is the currently displayed image.
This score describes the level of antibody staining observed in the annotated cell types as not detected, low, medium, or high. It is based on the staining intensity and fraction of stained cells.
The RNA-seq details section shows detailed information about the individual samples used for the transcript profiling and results of the RNA-seq analysis.
Information about each individual sample is listed below, including gender, age, a tissue section image and estimated fractions of cell types. TPM (transcripts per million) values give a quantification of the gene abundance which is comparable between different genes and samples.
RNA-Seq data is reported as average RPKM (reads per kilobase per million mapped reads), generated by the Genotype-Tissue Expression (GTEx) project. More information can be found on the GTEx portal.
Normal distribution across the dataset is visualized with box plots, shown as median and 25th and 75th percentiles. Points are displayed as outliers if they are above or below 1.5 times the interquartile range. RPKM values of the individual samples are presented next to the box plot.
Max RPKM: 1152.5
Min RPKM: 286.6
Std RPKM: 173.8
Median RPKM: 655.7
GTEX-1117F-2526-SM-5GZY6
60-69 years, female
1152.5
GTEX-13D11-1326-SM-5IJFY
50-59 years, female
1039.6
GTEX-11P81-2126-SM-5HL6N
30-39 years, female
1032.4
GTEX-132AR-1626-SM-5EGHP
50-59 years, female
976.9
GTEX-OHPK-2526-SM-3MJH9
50-59 years, female
962.6
GTEX-ZAJG-2926-SM-5HL8P
50-59 years, female
953.7
GTEX-12WSB-2426-SM-5EGJC
60-69 years, female
948.5
GTEX-Y8LW-1426-SM-5RQJJ
50-59 years, female
943.6
GTEX-PWOO-2026-SM-48TDE
40-49 years, female
915.7
GTEX-T2IS-1926-SM-4DM74
20-29 years, female
879.0
GTEX-11DXX-1726-SM-5H11T
60-69 years, female
873.4
GTEX-ZYY3-2626-SM-5N9DH
60-69 years, female
872.3
GTEX-14A5I-2726-SM-5SIB3
50-59 years, female
864.0
GTEX-T6MO-1226-SM-4DM5S
40-49 years, female
863.8
GTEX-131XG-2126-SM-5DUXG
50-59 years, female
842.3
GTEX-11TTK-2726-SM-5GU58
60-69 years, female
823.1
GTEX-ZC5H-2226-SM-4WAWS
40-49 years, female
822.9
GTEX-X8HC-2826-SM-46MWJ
50-59 years, female
814.6
GTEX-ZZPU-2226-SM-5EGIV
50-59 years, female
810.8
GTEX-PLZ4-2726-SM-3P61A
50-59 years, female
802.4
GTEX-ZTPG-2226-SM-57WF9
20-29 years, female
794.7
GTEX-NL3G-2526-SM-4SOIE
60-69 years, female
790.7
GTEX-S7SF-1426-SM-4AT5A
20-29 years, female
787.8
GTEX-ZLWG-1126-SM-4WWFQ
50-59 years, female
786.2
GTEX-ZXES-0626-SM-5E45P
30-39 years, female
778.0
GTEX-13QBU-1726-SM-5IJFQ
40-49 years, female
771.0
GTEX-11XUK-1326-SM-5EQM4
40-49 years, female
762.4
GTEX-11EMC-1926-SM-5A5JU
60-69 years, female
758.2
GTEX-1399U-1526-SM-5J2N7
50-59 years, female
756.0
GTEX-14AS3-1726-SM-5RQJV
40-49 years, female
753.6
GTEX-14BMU-1926-SM-5S2QC
20-29 years, female
753.6
GTEX-ZE7O-2426-SM-57WD7
50-59 years, female
743.5
GTEX-S4P3-1126-SM-4AD52
50-59 years, female
726.7
GTEX-XUJ4-1626-SM-4BONV
60-69 years, female
726.6
GTEX-PWN1-2526-SM-48TDS
40-49 years, female
726.2
GTEX-ZV6S-1326-SM-59HJA
40-49 years, female
706.9
GTEX-1399S-2326-SM-5K7YV
30-39 years, female
704.2
GTEX-S341-1226-SM-4AD5S
40-49 years, female
702.7
GTEX-Y3IK-2226-SM-4YCD4
50-59 years, female
700.3
GTEX-TML8-1126-SM-4DXSS
40-49 years, female
695.6
GTEX-SE5C-1126-SM-4BRWZ
40-49 years, female
690.2
GTEX-13U4I-2026-SM-5LU3L
40-49 years, female
687.5
GTEX-QCQG-1226-SM-48U23
50-59 years, female
685.1
GTEX-146FH-2626-SM-5Q5E1
50-59 years, female
673.2
GTEX-145ME-1426-SM-5RQJS
40-49 years, female
668.6
GTEX-UPIC-1426-SM-4IHLQ
20-29 years, female
664.0
GTEX-PWCY-1726-SM-48TD3
20-29 years, female
660.5
GTEX-ZP4G-0826-SM-4WWF3
20-29 years, female
658.2
GTEX-P78B-2226-SM-3P5ZZ
40-49 years, female
653.2
GTEX-XV7Q-1626-SM-4BRWC
40-49 years, female
645.2
GTEX-13PVR-1426-SM-5S2PW
60-69 years, female
643.1
GTEX-QDT8-2526-SM-48TYX
30-39 years, female
634.4
GTEX-TMMY-1926-SM-4DXUU
40-49 years, female
633.4
GTEX-OHPL-2526-SM-3MJGT
60-69 years, female
627.8
GTEX-11I78-2026-SM-5987C
50-59 years, female
617.5
GTEX-Q734-1426-SM-48TZQ
40-49 years, female
602.2
GTEX-13OVI-0926-SM-5J1MI
60-69 years, female
601.1
GTEX-ZVT2-0626-SM-5GICR
50-59 years, female
592.9
GTEX-P4PP-2526-SM-3P61P
30-39 years, female
590.4
GTEX-N7MT-1926-SM-3LK5N
60-69 years, female
588.5
GTEX-YJ8O-1226-SM-5P9JE
40-49 years, female
586.6
GTEX-TSE9-2526-SM-4DXUS
60-69 years, female
574.4
GTEX-ZYWO-2026-SM-5GIDA
40-49 years, female
572.2
GTEX-13PL7-2726-SM-5L3GB
60-69 years, female
546.0
GTEX-131YS-2426-SM-5J2OD
60-69 years, female
545.6
GTEX-113JC-1926-SM-5N9GE
50-59 years, female
543.7
GTEX-S4UY-1326-SM-4AD4X
40-49 years, female
543.4
GTEX-QVJO-2526-SM-4R1KB
60-69 years, female
543.3
GTEX-PX3G-2526-SM-48TZV
20-29 years, female
541.4
GTEX-Y114-1926-SM-4TT8J
50-59 years, female
540.0
GTEX-U3ZN-0926-SM-4DXTU
30-39 years, female
539.1
GTEX-X15G-1926-SM-4PQZQ
50-59 years, female
530.3
GTEX-13W3W-2326-SM-5LU4Y
60-69 years, female
525.4
GTEX-ZVT3-2726-SM-5GU5X
60-69 years, female
525.0
GTEX-11VI4-0726-SM-5GU5B
40-49 years, female
522.7
GTEX-ZQG8-1126-SM-51MRL
60-69 years, female
522.6
GTEX-13N11-1526-SM-5L3FL
50-59 years, female
515.4
GTEX-YFC4-2926-SM-5IFJ8
40-49 years, female
514.0
GTEX-13QIC-1826-SM-5J1MY
60-69 years, female
510.8
GTEX-XUW1-0326-SM-4BOOR
50-59 years, female
489.6
GTEX-WRHU-2926-SM-4MVNQ
50-59 years, female
482.8
GTEX-12WSJ-1326-SM-5GCOB
40-49 years, female
481.7
GTEX-ZYVF-0326-SM-5GIES
50-59 years, female
481.5
GTEX-WEY5-0826-SM-4LMIH
40-49 years, female
469.6
GTEX-12ZZX-1926-SM-5EGKC
40-49 years, female
467.0
GTEX-146FR-2426-SM-5NQAU
60-69 years, female
465.4
GTEX-RWS6-1726-SM-47JXP
60-69 years, female
461.1
GTEX-ZGAY-2226-SM-4YCCX
40-49 years, female
451.8
GTEX-W5WG-1026-SM-4LMIF
50-59 years, female
438.4
GTEX-14DAQ-2326-SM-5S2QX
60-69 years, female
399.7
GTEX-11EM3-1826-SM-5A5KO
20-29 years, female
395.0
GTEX-UJHI-1326-SM-4IHJO
50-59 years, female
394.8
GTEX-147F3-1526-SM-5SIAK
50-59 years, female
378.9
GTEX-RU1J-1426-SM-46MUV
20-29 years, female
340.6
GTEX-11GSP-2226-SM-5HL5Q
60-69 years, female
324.7
GTEX-12WSD-2926-SM-5LZUH
60-69 years, female
286.6
Show all
VAGINA - FANTOM5 CAGEi
Tissue data obtained through Cap Analysis of Gene Expression (CAGE) are reported as Tags Per Million, generated by the FANTOM5 project. More information can be found here.
 The Human Protein Atlas project is funded


 MENU
MENU