We use cookies to enhance the usability of our website. If you continue, we'll assume that you are happy to receive all cookies. More information. Don't show this again.
RNA category is based on mRNA expression levels in the analyzed samples (RNA assay description). The categories include: tissue/cell line enriched, group enriched, tissue/cell line enhanced, expressed in all, mixed and not detected. RNA category is calculated separately for The Cancer Genome Atlas (TCGA) data from cancer tissues and internally generated Human Protein Atlas (HPA) data from normal tissues and cell lines.
TCGA (cancer tissue):
Expressed in all
HPA (cell line):
Expressed in all
HPA (normal tissue):
Expressed in all
Protein evidencei
Protein evidence scores are generated from several independent sources and are classified as evidence at i) protein level, ii) transcript level, iii) no evidence, or iv) not available.
Evidence at protein level
Protein expression normal tissuei
A summary of the overall protein expression pattern across the analyzed normal tissues. The summary is based on knowledge-based annotation.
"Estimation of protein expression could not be performed. View primary data." is shown for genes analyzed with a knowledge-based approach where available RNA-seq and gene/protein characterization data has been evaluated as not sufficient in combination with immunohistochemistry data to yield a reliable estimation of the protein expression profile.
Standardized explanatory sentences with additional information required for full understanding of the knowledge-based expression profile.
Antibody staining mainly consistent with RNA expression data.
Reliability score - normal tissuesi
Reliability score (score description), divided into Enhanced, Supported, Approved, or Uncertain, is evaluated in normal tissues and based on consistency between antibody staining pattern, available RNA-Seq and gene/protein characterization data, as well as similarity between independent antibodies targeting the same protein.
Kaplan-Meier plots for all cancers where high expression of this gene has significant (p<0.001) association with patient survival are shown in this summary. Whether the prognosis is favourable or unfavourable is indicated in brackets. Each Kaplan-Meier plot is clickable and redirects to a detailed page that includes individual expression and survival data for patients with the selected cancer.
RNA expression overview shows RNA-seq data from The Cancer Genome Atlas (TCGA).
TCGA dataseti
RNA-seq data in 17 cancer types are reported as median FPKM (number Fragments Per Kilobase of exon per Million reads), generated by the The Cancer Genome Atlas (TCGA). RNA cancer tissue category is calculated based on mRNA expression levels across all 17 cancer tissues and include: cancer tissue enriched, cancer group enriched, cancer tissue enhanced, expressed in all, mixed and not detected. To access cancer specific RNA and prognostic data, click on the cancer name. The cancer types are color-coded according to which type of normal organ the cancer originates from.
Antibody staining in 20 different cancers is summarized by a selection of four standard cancer tissue samples representative of the overall staining pattern. From left: colorectal cancer, breast cancer, prostate cancer and lung cancer. An additional fifth image can be added as a complement. The assay and annotation is described here. Note that samples used for immunohistochemistry by the Human Protein Atlas do not correspond to samples in the TCGA dataset.
For each cancer, color-coded bars indicate the percentage of patients (maximum 12 patients) with high and medium protein expression level. The cancer types are color-coded according to which type of normal organ the cancer originates from. Low or not detected protein expression results in a white bar. Mouse-over function shows details about expression level and normal tissue of origin. The images and annotations can be accessed by clicking on the cancer name or protein expression bar. If more than one antibody is analyzed, the tabs at the top of the staining summary section can be used to toggle between the different antibodies.
Weak to moderate nuclear staining was observed in cancer tissues. Few cases of testicular tumors and melanomas were strongly positive. Several cases of renal and liver cancers were negative.
Cancer tissues showed strong nuclear immunoreactivity. Most cases of hepatocellular carcinomas were weakly stained or negative.
GENE INFORMATIONi
Gene information from Ensembl and Entrez, as well as links to available gene identifiers are displayed here. Information was retrieved from Ensembl if not indicated otherwise.
Gene name
XRCC5 (HGNC Symbol)
Synonyms
KARP-1, KU80, Ku86, KUB2
Description
X-ray repair cross complementing 5 (HGNC Symbol)
Entrez gene summary
The protein encoded by this gene is the 80-kilodalton subunit of the Ku heterodimer protein which is also known as ATP-dependant DNA helicase II or DNA repair protein XRCC5. Ku is the DNA-binding component of the DNA-dependent protein kinase, and it functions together with the DNA ligase IV-XRCC4 complex in the repair of DNA double-strand break by non-homologous end joining and the completion of V(D)J recombination events. This gene functionally complements Chinese hamster xrs-6, a mutant defective in DNA double-strand break repair and in ability to undergo V(D)J recombination. A rare microsatellite polymorphism in this gene is associated with cancer in patients of varying radiosensitivity. [provided by RefSeq, Jul 2008]
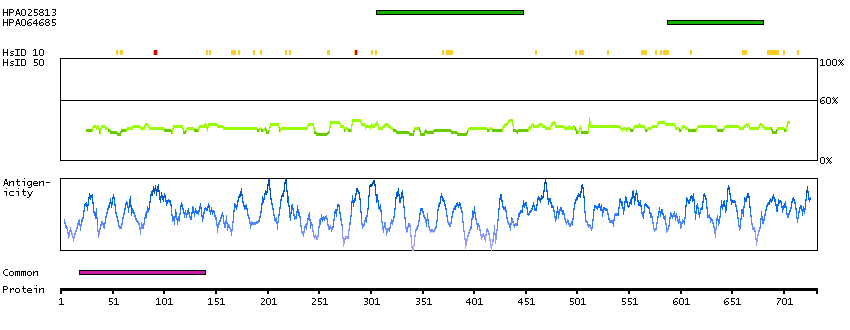
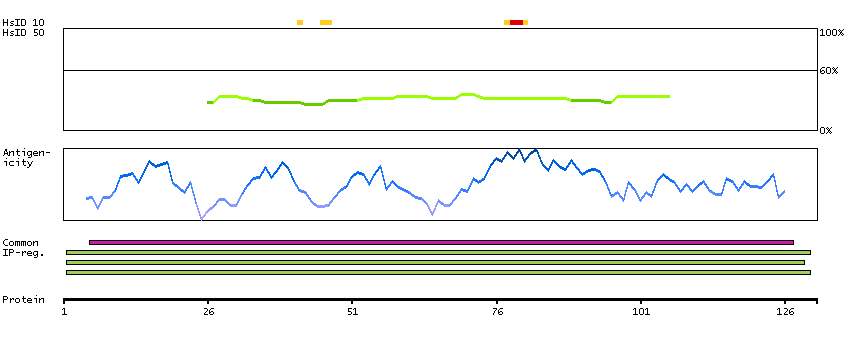
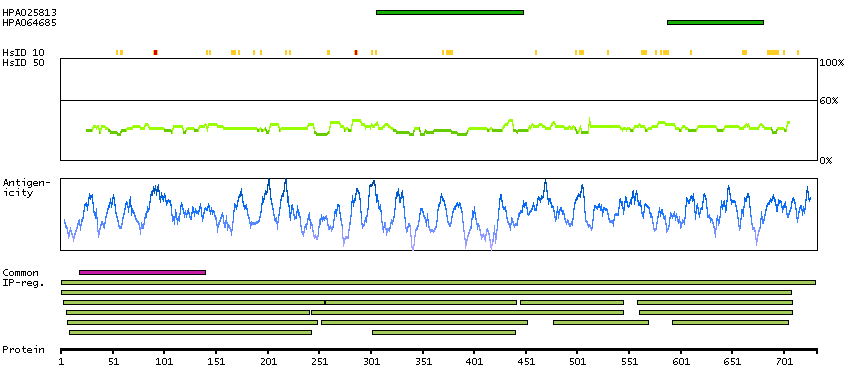
The protein browser displays the antigen location on the target protein(s) and the features of the target protein. The tabs at the top of the protein view section can be used to switch between the different splice variants to which an antigen has been mapped.
At the top of the view, the position of the antigen (identified by the corresponding HPA identifier) is shown as a green bar. A yellow triangle on the bar indicates a <100% sequence identity to the protein target.
Under the antigens, the maximum percent sequence identity of the protein to all other proteins from other human genes is displayed, using a sliding window of 10 aa residues (HsID 10) or 50 aa residues (HsID 50). The region with the lowest possible identity is always selected for antigen design, with a maximum identity of 60% allowed for designing a single-target antigen (read more).
The curve in blue displays the predicted antigenicity i.e. the tendency for different regions of the protein to generate an immune response, with peak regions being predicted to be more antigenic.The curve shows average values based on a sliding window approach using an in-house propensity scale. (read more).
If a signal peptide is predicted by a majority of the signal peptide predictors SPOCTOPUS, SignalP 4.0, and Phobius (turquoise) and/or transmembrane regions (orange) are predicted by MDM, these are displayed.
Low complexity regions are shown in yellow and InterPro regions in green. Common (purple) and unique (grey) regions between different splice variants of the gene are also displayed (read more), and at the bottom of the protein view is the protein scale.
XRCC5-001
XRCC5-003
XRCC5-201
PROTEIN INFORMATIONi
The protein information section displays alternative protein-coding transcripts (splice variants) encoded by this gene according to the Ensembl database.
The ENSP identifier links to the Ensembl website protein summary, while the ENST identifier links to the Ensembl website transcript summary for the selected splice variant. The data in the UniProt column can be expanded to show links to all matching UniProt identifiers for this protein.
The protein classes assigned to this protein are shown if expanding the data in the protein class column. Parent protein classes are in bold font and subclasses are listed under the parent class.
The Gene Ontology terms assigned to this protein are listed if expanding the Gene ontology column. The length of the protein (amino acid residues according to Ensembl), molecular mass (kDalton), predicted signal peptide (according to a majority of the signal peptide predictors SPOCTOPUS, SignalP 4.0, and Phobius) and the number of predicted transmembrane region(s) (according to MDM) are also reported.
P13010 [Direct mapping] X-ray repair cross-complementing protein 5
Show all
Predicted intracellular proteins Plasma proteins Cancer-related genes Candidate cancer biomarkers Protein evidence (Kim et al 2014) Protein evidence (Ezkurdia et al 2014)
Show all
GO:0000166 [nucleotide binding] GO:0000723 [telomere maintenance] GO:0000783 [nuclear telomere cap complex] GO:0000784 [nuclear chromosome, telomeric region] GO:0003677 [DNA binding] GO:0003684 [damaged DNA binding] GO:0003690 [double-stranded DNA binding] GO:0003691 [double-stranded telomeric DNA binding] GO:0003723 [RNA binding] GO:0004003 [ATP-dependent DNA helicase activity] GO:0004386 [helicase activity] GO:0005515 [protein binding] GO:0005524 [ATP binding] GO:0005576 [extracellular region] GO:0005634 [nucleus] GO:0005654 [nucleoplasm] GO:0005694 [chromosome] GO:0005730 [nucleolus] GO:0005829 [cytosol] GO:0005886 [plasma membrane] GO:0006281 [DNA repair] GO:0006302 [double-strand break repair] GO:0006303 [double-strand break repair via nonhomologous end joining] GO:0006310 [DNA recombination] GO:0006351 [transcription, DNA-templated] GO:0006355 [regulation of transcription, DNA-templated] GO:0006974 [cellular response to DNA damage stimulus] GO:0008022 [protein C-terminus binding] GO:0016020 [membrane] GO:0016787 [hydrolase activity] GO:0016817 [hydrolase activity, acting on acid anhydrides] GO:0031625 [ubiquitin protein ligase binding] GO:0032481 [positive regulation of type I interferon production] GO:0032508 [DNA duplex unwinding] GO:0034774 [secretory granule lumen] GO:0042162 [telomeric DNA binding] GO:0043312 [neutrophil degranulation] GO:0043564 [Ku70:Ku80 complex] GO:0044212 [transcription regulatory region DNA binding] GO:0044877 [macromolecular complex binding] GO:0045892 [negative regulation of transcription, DNA-templated] GO:0048660 [regulation of smooth muscle cell proliferation] GO:0051575 [5'-deoxyribose-5-phosphate lyase activity] GO:0070419 [nonhomologous end joining complex] GO:0071480 [cellular response to gamma radiation] GO:0075713 [establishment of integrated proviral latency] GO:1904430 [negative regulation of t-circle formation]
 The Human Protein Atlas project is funded


 MENU
MENU