We use cookies to enhance the usability of our website. If you continue, we'll assume that you are happy to receive all cookies. More information. Don't show this again.
The protein expression bar, with the units not detected (n), low (l), medium (m) and high (h), is based on a best estimate of the true protein expression for proteins where the antibody staining pattern has been analyzed by knowledge-based annotation. For genes where more than one antibody has been used, a collective score is set. For details, see Assays & annotation.
h
m
l
n
RNA expressioni
RNA expression shows average values based on RNA-seq data generated by HPA, the Genotype-Tissue Expression (GTEx) consortium or the FANTOM5 consortium.
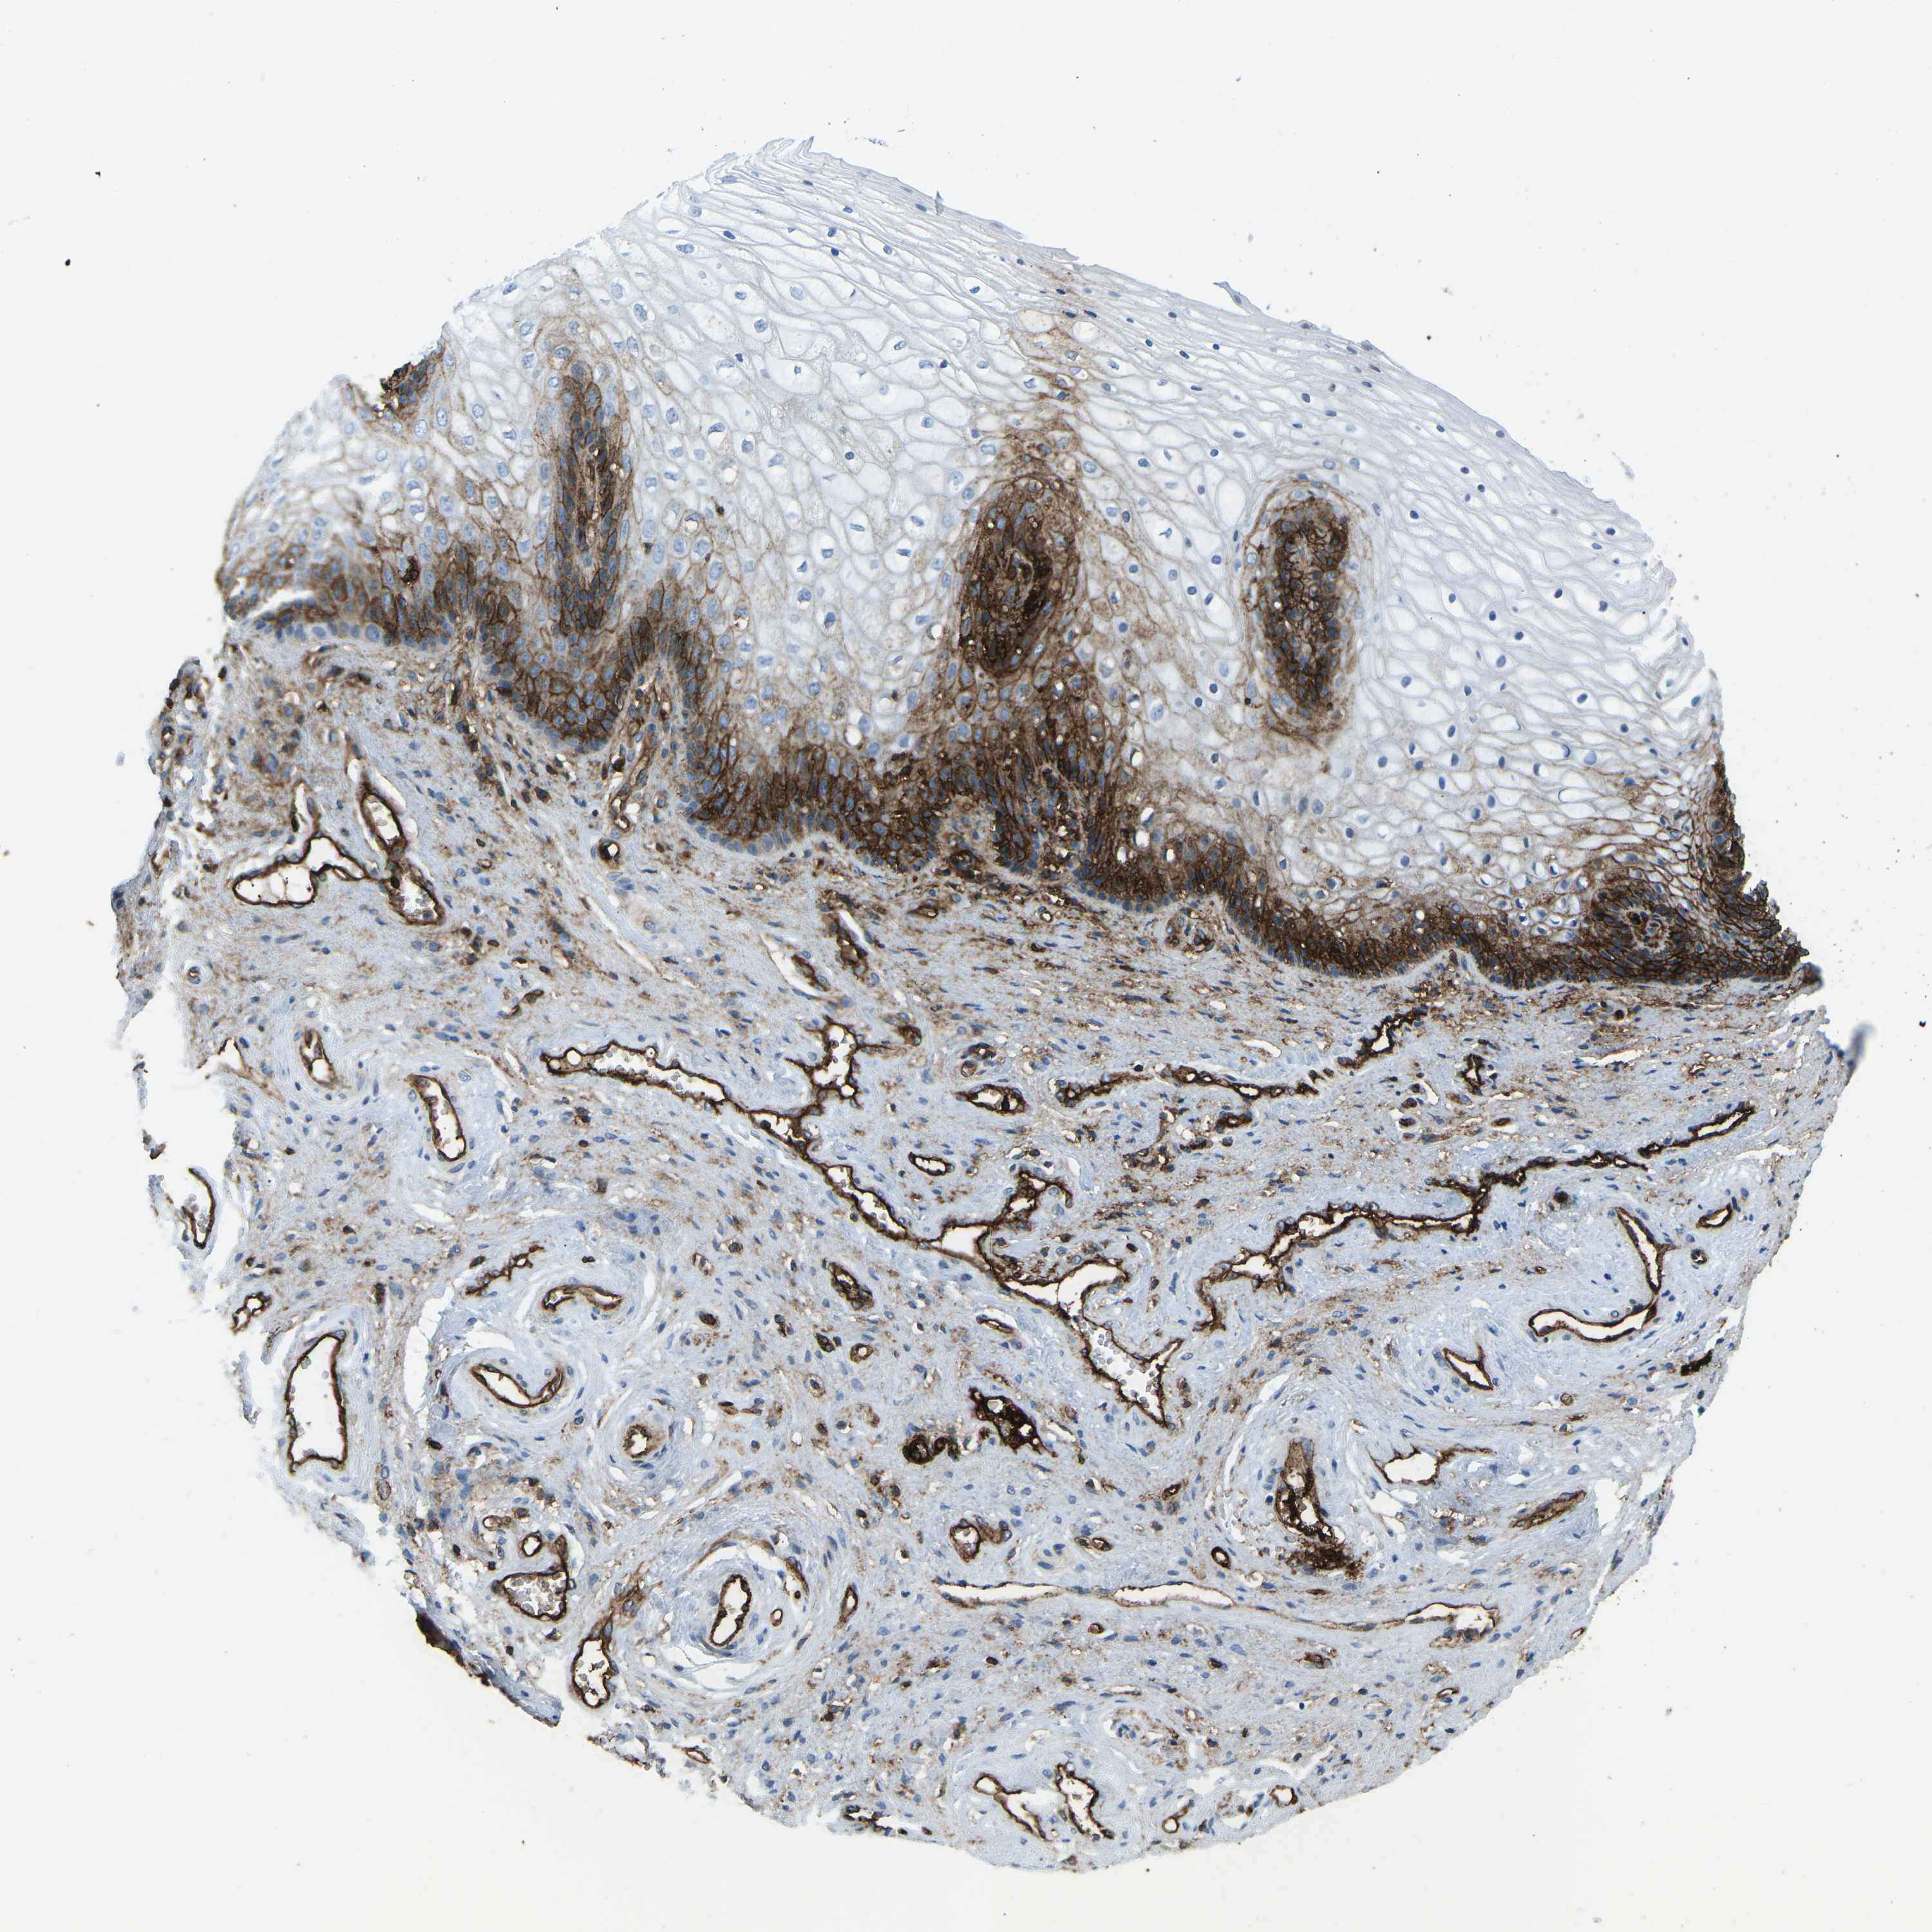
The detailed normal tissue page shows images of the stained tissue, together with antibody staining and expression level of the cell types. A knowledge-based annotated protein expression is provided for each cell type at the top of the page and the staining level of the individual antibodies is given underneath each antibody ID.
Samples from up to three different individuals have been stained for each antibody. The gender, age and tissue characterization are reported for each individual (patient) and are viewable when clicking on the image for magnification.
The images can be clicked for an enlarged view that can be panned. From the enlarged view, all stained images for all antibodies can be browsed (represented by miniature images). The miniature image with an orange overlay is the currently displayed image.
This score describes the level of antibody staining observed in the annotated cell types as not detected, low, medium, or high. It is based on the staining intensity and fraction of stained cells.
The RNA-seq details section shows detailed information about the individual samples used for the transcript profiling and results of the RNA-seq analysis.
Information about each individual sample is listed below, including gender, age, a tissue section image and estimated fractions of cell types. TPM (transcripts per million) values give a quantification of the gene abundance which is comparable between different genes and samples.
RNA-Seq data is reported as average RPKM (reads per kilobase per million mapped reads), generated by the Genotype-Tissue Expression (GTEx) project. More information can be found on the GTEx portal.
Normal distribution across the dataset is visualized with box plots, shown as median and 25th and 75th percentiles. Points are displayed as outliers if they are above or below 1.5 times the interquartile range. RPKM values of the individual samples are presented next to the box plot.
Max RPKM: 1083.8
Min RPKM: 146.1
Std RPKM: 189.7
Median RPKM: 412.9
GTEX-13U4I-2026-SM-5LU3L
40-49 years, female
1083.8
GTEX-YFC4-2926-SM-5IFJ8
40-49 years, female
971.1
GTEX-11DXX-1726-SM-5H11T
60-69 years, female
881.9
GTEX-14DAQ-2326-SM-5S2QX
60-69 years, female
869.3
GTEX-11GSP-2226-SM-5HL5Q
60-69 years, female
853.0
GTEX-XV7Q-1626-SM-4BRWC
40-49 years, female
838.1
GTEX-ZTPG-2226-SM-57WF9
20-29 years, female
820.6
GTEX-X8HC-2826-SM-46MWJ
50-59 years, female
758.1
GTEX-11TTK-2726-SM-5GU58
60-69 years, female
692.9
GTEX-ZC5H-2226-SM-4WAWS
40-49 years, female
685.6
GTEX-PX3G-2526-SM-48TZV
20-29 years, female
681.8
GTEX-12ZZX-1926-SM-5EGKC
40-49 years, female
661.3
GTEX-13N11-1526-SM-5L3FL
50-59 years, female
657.4
GTEX-ZE7O-2426-SM-57WD7
50-59 years, female
653.7
GTEX-12WSD-2926-SM-5LZUH
60-69 years, female
652.2
GTEX-WRHU-2926-SM-4MVNQ
50-59 years, female
636.5
GTEX-ZYVF-0326-SM-5GIES
50-59 years, female
633.6
GTEX-TSE9-2526-SM-4DXUS
60-69 years, female
629.4
GTEX-QDT8-2526-SM-48TYX
30-39 years, female
600.8
GTEX-11P81-2126-SM-5HL6N
30-39 years, female
594.8
GTEX-113JC-1926-SM-5N9GE
50-59 years, female
592.3
GTEX-13PVR-1426-SM-5S2PW
60-69 years, female
587.9
GTEX-12WSJ-1326-SM-5GCOB
40-49 years, female
586.8
GTEX-QCQG-1226-SM-48U23
50-59 years, female
563.3
GTEX-131YS-2426-SM-5J2OD
60-69 years, female
555.9
GTEX-PLZ4-2726-SM-3P61A
50-59 years, female
555.8
GTEX-146FH-2626-SM-5Q5E1
50-59 years, female
552.0
GTEX-X15G-1926-SM-4PQZQ
50-59 years, female
549.8
GTEX-ZV6S-1326-SM-59HJA
40-49 years, female
545.5
GTEX-Y3IK-2226-SM-4YCD4
50-59 years, female
545.2
GTEX-RWS6-1726-SM-47JXP
60-69 years, female
529.6
GTEX-ZYWO-2026-SM-5GIDA
40-49 years, female
524.4
GTEX-ZVT3-2726-SM-5GU5X
60-69 years, female
518.0
GTEX-P78B-2226-SM-3P5ZZ
40-49 years, female
516.2
GTEX-12WSB-2426-SM-5EGJC
60-69 years, female
508.5
GTEX-W5WG-1026-SM-4LMIF
50-59 years, female
501.7
GTEX-1117F-2526-SM-5GZY6
60-69 years, female
488.5
GTEX-T2IS-1926-SM-4DM74
20-29 years, female
484.0
GTEX-WEY5-0826-SM-4LMIH
40-49 years, female
474.1
GTEX-13QIC-1826-SM-5J1MY
60-69 years, female
461.9
GTEX-UJHI-1326-SM-4IHJO
50-59 years, female
459.0
GTEX-11EM3-1826-SM-5A5KO
20-29 years, female
458.2
GTEX-14AS3-1726-SM-5RQJV
40-49 years, female
444.7
GTEX-147F3-1526-SM-5SIAK
50-59 years, female
443.4
GTEX-NL3G-2526-SM-4SOIE
60-69 years, female
426.8
GTEX-ZAJG-2926-SM-5HL8P
50-59 years, female
416.8
GTEX-13OVI-0926-SM-5J1MI
60-69 years, female
415.6
GTEX-OHPL-2526-SM-3MJGT
60-69 years, female
414.7
GTEX-N7MT-1926-SM-3LK5N
60-69 years, female
411.0
GTEX-ZGAY-2226-SM-4YCCX
40-49 years, female
407.2
GTEX-13W3W-2326-SM-5LU4Y
60-69 years, female
404.3
GTEX-QVJO-2526-SM-4R1KB
60-69 years, female
382.6
GTEX-Y8LW-1426-SM-5RQJJ
50-59 years, female
376.9
GTEX-145ME-1426-SM-5RQJS
40-49 years, female
372.8
GTEX-13D11-1326-SM-5IJFY
50-59 years, female
368.2
GTEX-ZVT2-0626-SM-5GICR
50-59 years, female
368.2
GTEX-1399U-1526-SM-5J2N7
50-59 years, female
367.6
GTEX-ZQG8-1126-SM-51MRL
60-69 years, female
365.5
GTEX-146FR-2426-SM-5NQAU
60-69 years, female
364.6
GTEX-Q734-1426-SM-48TZQ
40-49 years, female
360.5
GTEX-RU1J-1426-SM-46MUV
20-29 years, female
355.7
GTEX-YJ8O-1226-SM-5P9JE
40-49 years, female
355.3
GTEX-T6MO-1226-SM-4DM5S
40-49 years, female
353.2
GTEX-U3ZN-0926-SM-4DXTU
30-39 years, female
344.6
GTEX-TMMY-1926-SM-4DXUU
40-49 years, female
339.2
GTEX-1399S-2326-SM-5K7YV
30-39 years, female
337.8
GTEX-11EMC-1926-SM-5A5JU
60-69 years, female
332.1
GTEX-ZXES-0626-SM-5E45P
30-39 years, female
325.0
GTEX-ZYY3-2626-SM-5N9DH
60-69 years, female
323.1
GTEX-S4P3-1126-SM-4AD52
50-59 years, female
322.4
GTEX-PWOO-2026-SM-48TDE
40-49 years, female
314.1
GTEX-ZZPU-2226-SM-5EGIV
50-59 years, female
305.9
GTEX-131XG-2126-SM-5DUXG
50-59 years, female
304.9
GTEX-S4UY-1326-SM-4AD4X
40-49 years, female
303.5
GTEX-TML8-1126-SM-4DXSS
40-49 years, female
294.9
GTEX-11XUK-1326-SM-5EQM4
40-49 years, female
294.1
GTEX-XUJ4-1626-SM-4BONV
60-69 years, female
290.0
GTEX-OHPK-2526-SM-3MJH9
50-59 years, female
277.9
GTEX-P4PP-2526-SM-3P61P
30-39 years, female
273.0
GTEX-13QBU-1726-SM-5IJFQ
40-49 years, female
268.3
GTEX-S7SF-1426-SM-4AT5A
20-29 years, female
267.8
GTEX-13PL7-2726-SM-5L3GB
60-69 years, female
265.7
GTEX-SE5C-1126-SM-4BRWZ
40-49 years, female
264.0
GTEX-UPIC-1426-SM-4IHLQ
20-29 years, female
264.0
GTEX-ZP4G-0826-SM-4WWF3
20-29 years, female
254.3
GTEX-11VI4-0726-SM-5GU5B
40-49 years, female
244.1
GTEX-PWN1-2526-SM-48TDS
40-49 years, female
241.0
GTEX-Y114-1926-SM-4TT8J
50-59 years, female
239.0
GTEX-ZLWG-1126-SM-4WWFQ
50-59 years, female
234.3
GTEX-XUW1-0326-SM-4BOOR
50-59 years, female
234.0
GTEX-14BMU-1926-SM-5S2QC
20-29 years, female
231.6
GTEX-14A5I-2726-SM-5SIB3
50-59 years, female
209.8
GTEX-132AR-1626-SM-5EGHP
50-59 years, female
209.3
GTEX-S341-1226-SM-4AD5S
40-49 years, female
192.3
GTEX-PWCY-1726-SM-48TD3
20-29 years, female
186.3
GTEX-11I78-2026-SM-5987C
50-59 years, female
146.1
Show all
VAGINA - FANTOM5 CAGEi
Tissue data obtained through Cap Analysis of Gene Expression (CAGE) are reported as Tags Per Million, generated by the FANTOM5 project. More information can be found here.
 The Human Protein Atlas project is funded


 MENU
MENU