We use cookies to enhance the usability of our website. If you continue, we'll assume that you are happy to receive all cookies. More information. Don't show this again.
The protein expression bar, with the units not detected (n), low (l), medium (m) and high (h), is based on a best estimate of the true protein expression for proteins where the antibody staining pattern has been analyzed by knowledge-based annotation. For genes where more than one antibody has been used, a collective score is set. For details, see Assays & annotation.
h
m
l
n
RNA expressioni
RNA expression shows average values based on RNA-seq data generated by HPA, the Genotype-Tissue Expression (GTEx) consortium or the FANTOM5 consortium.
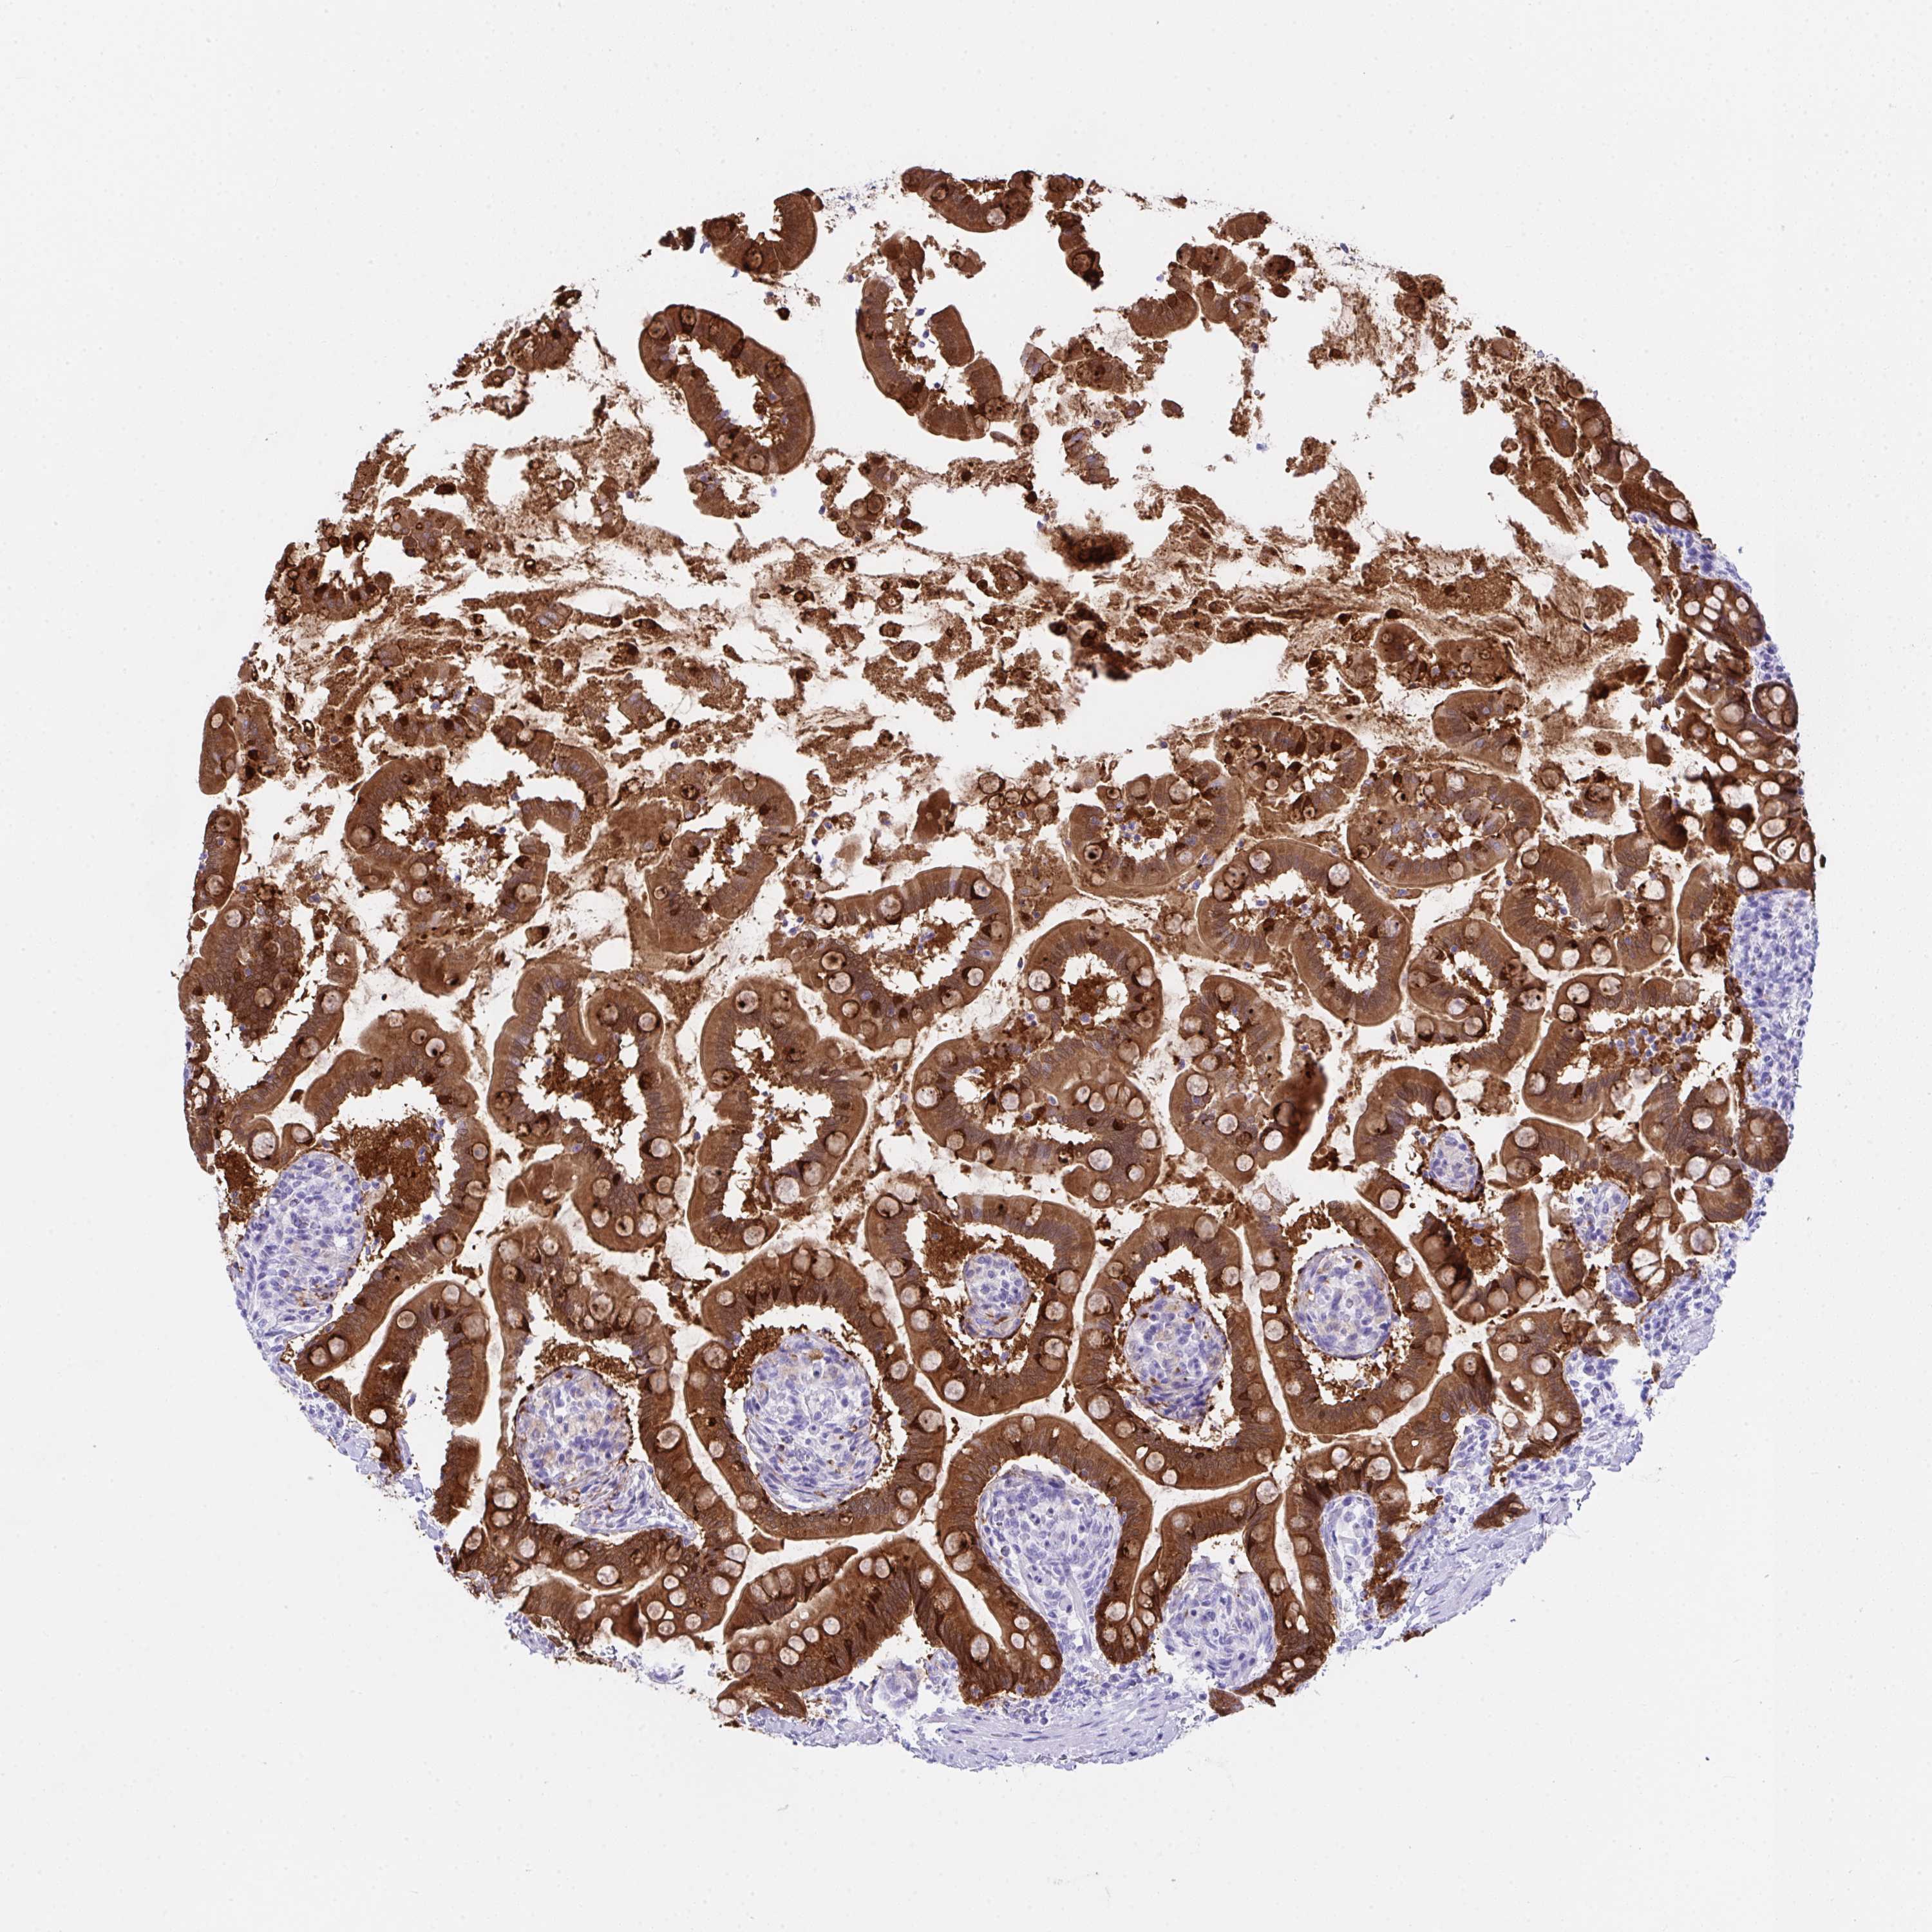
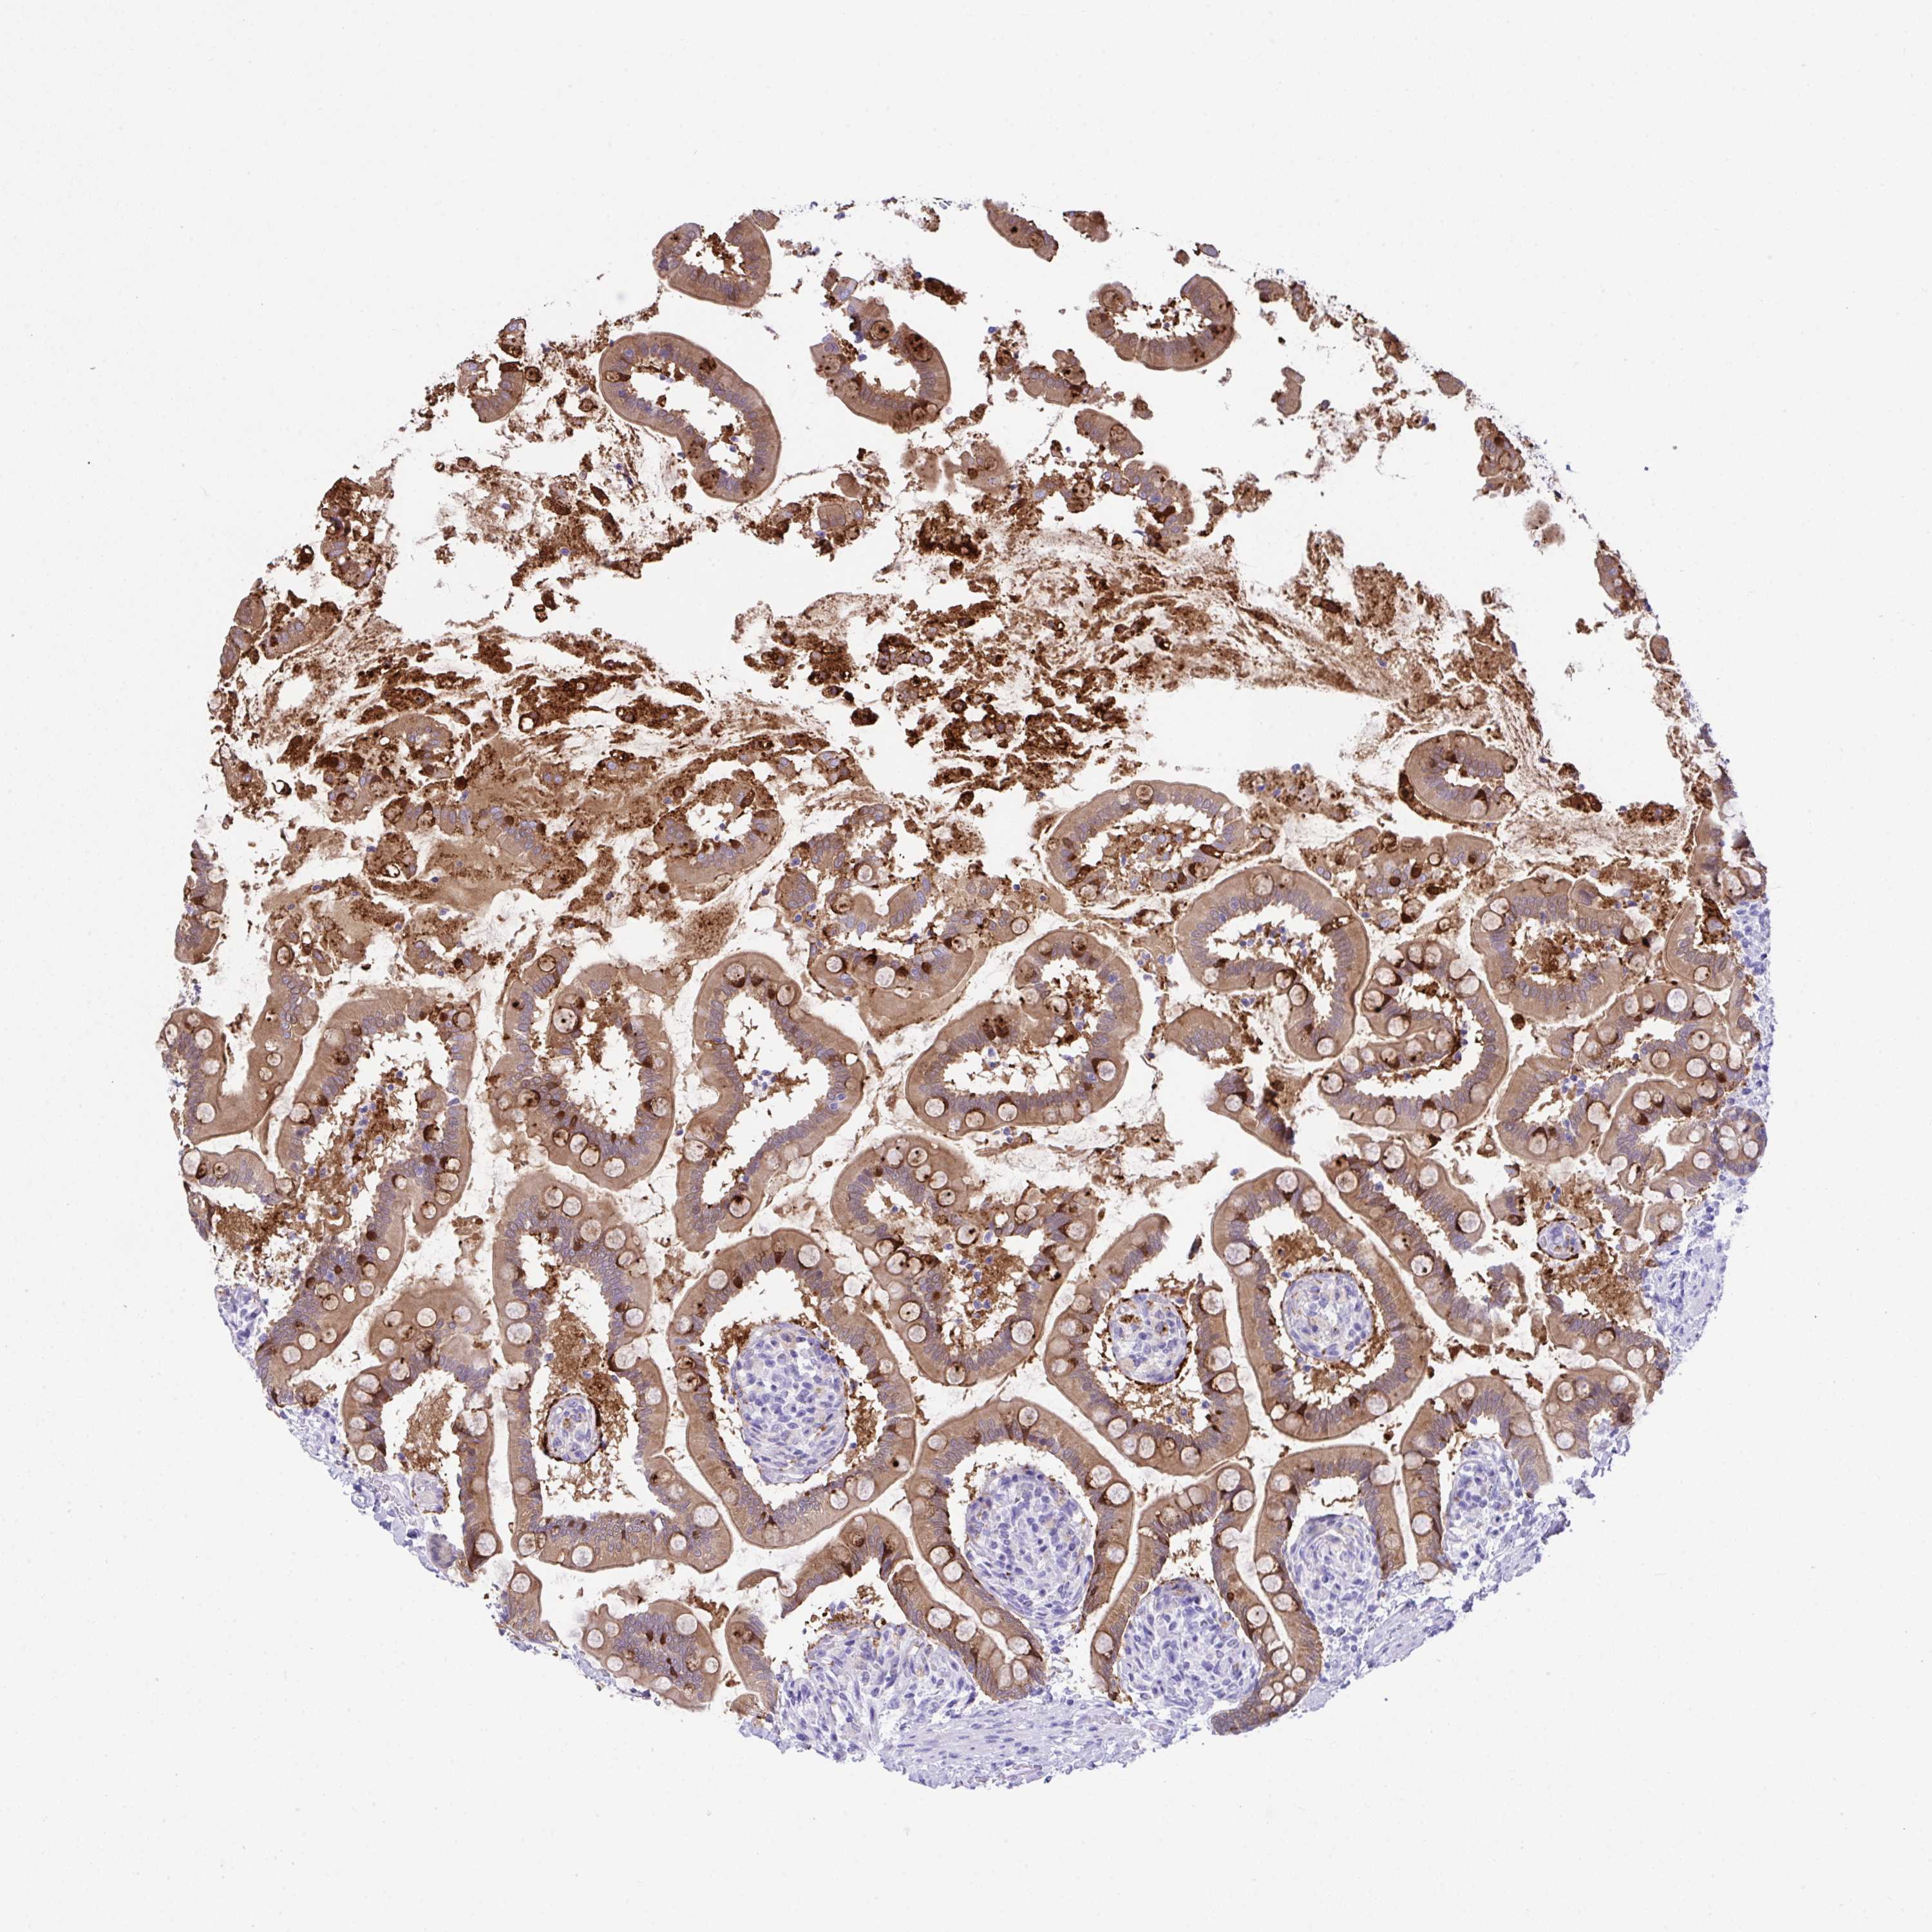
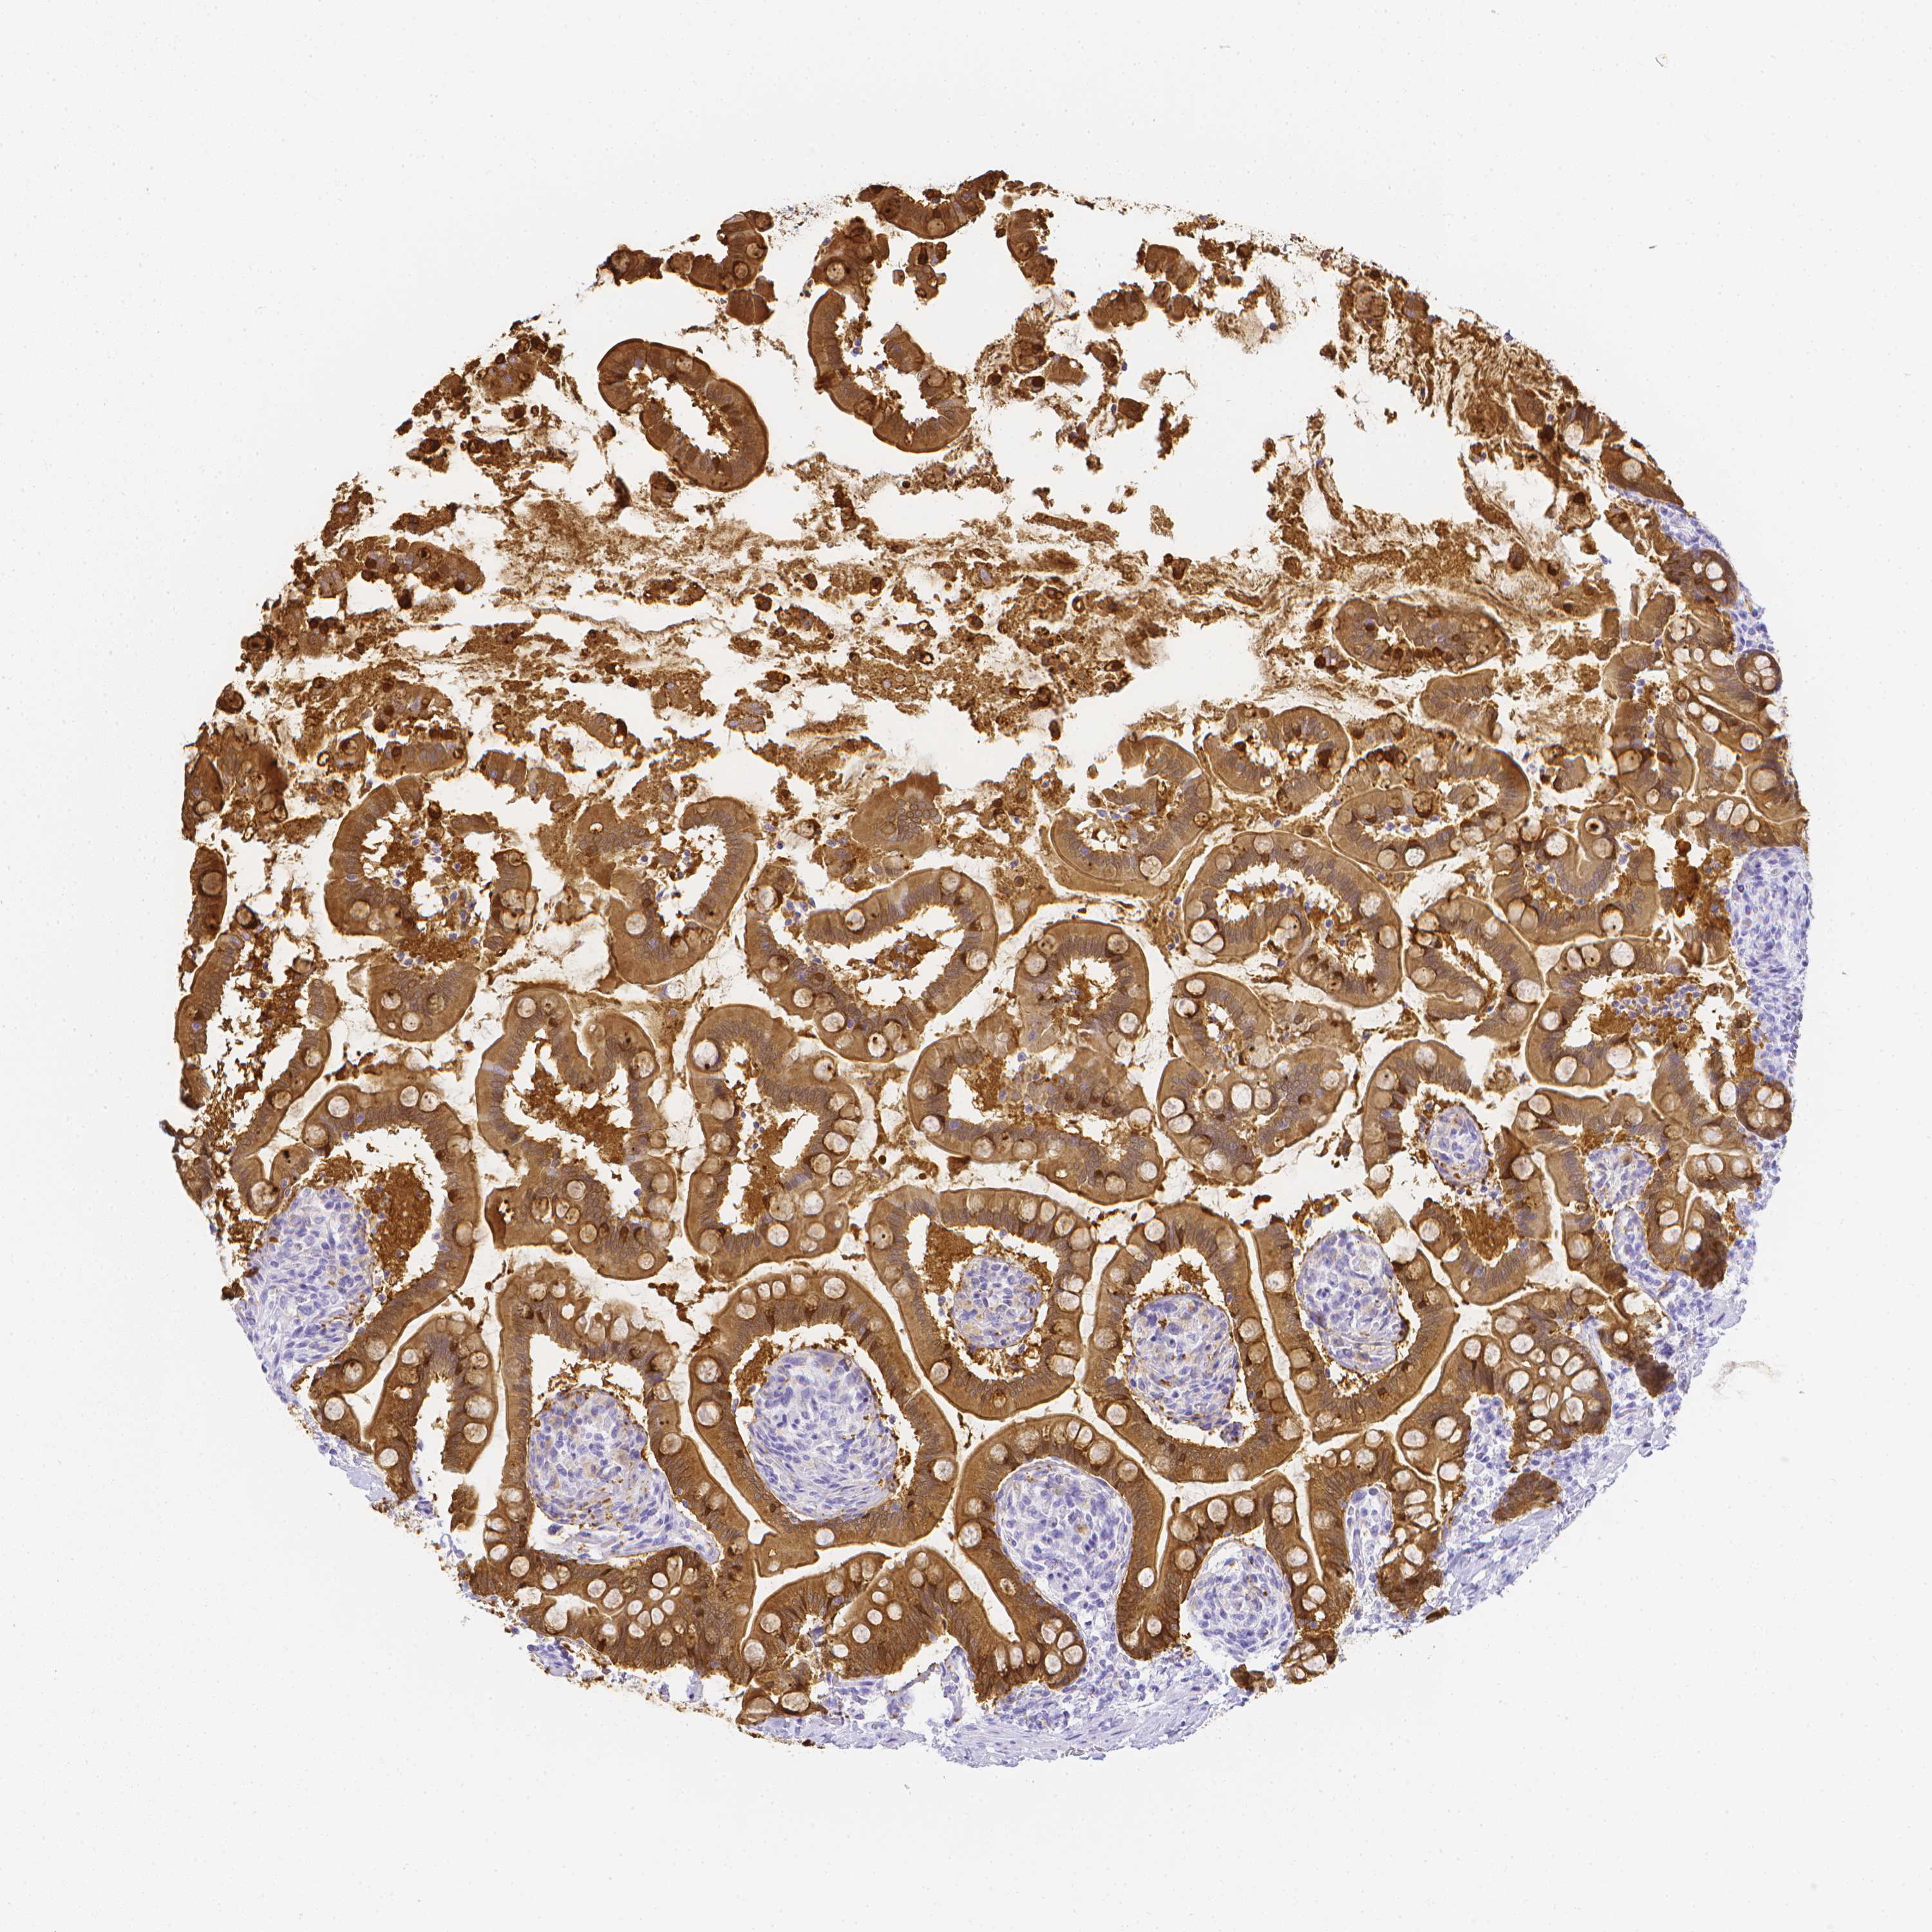
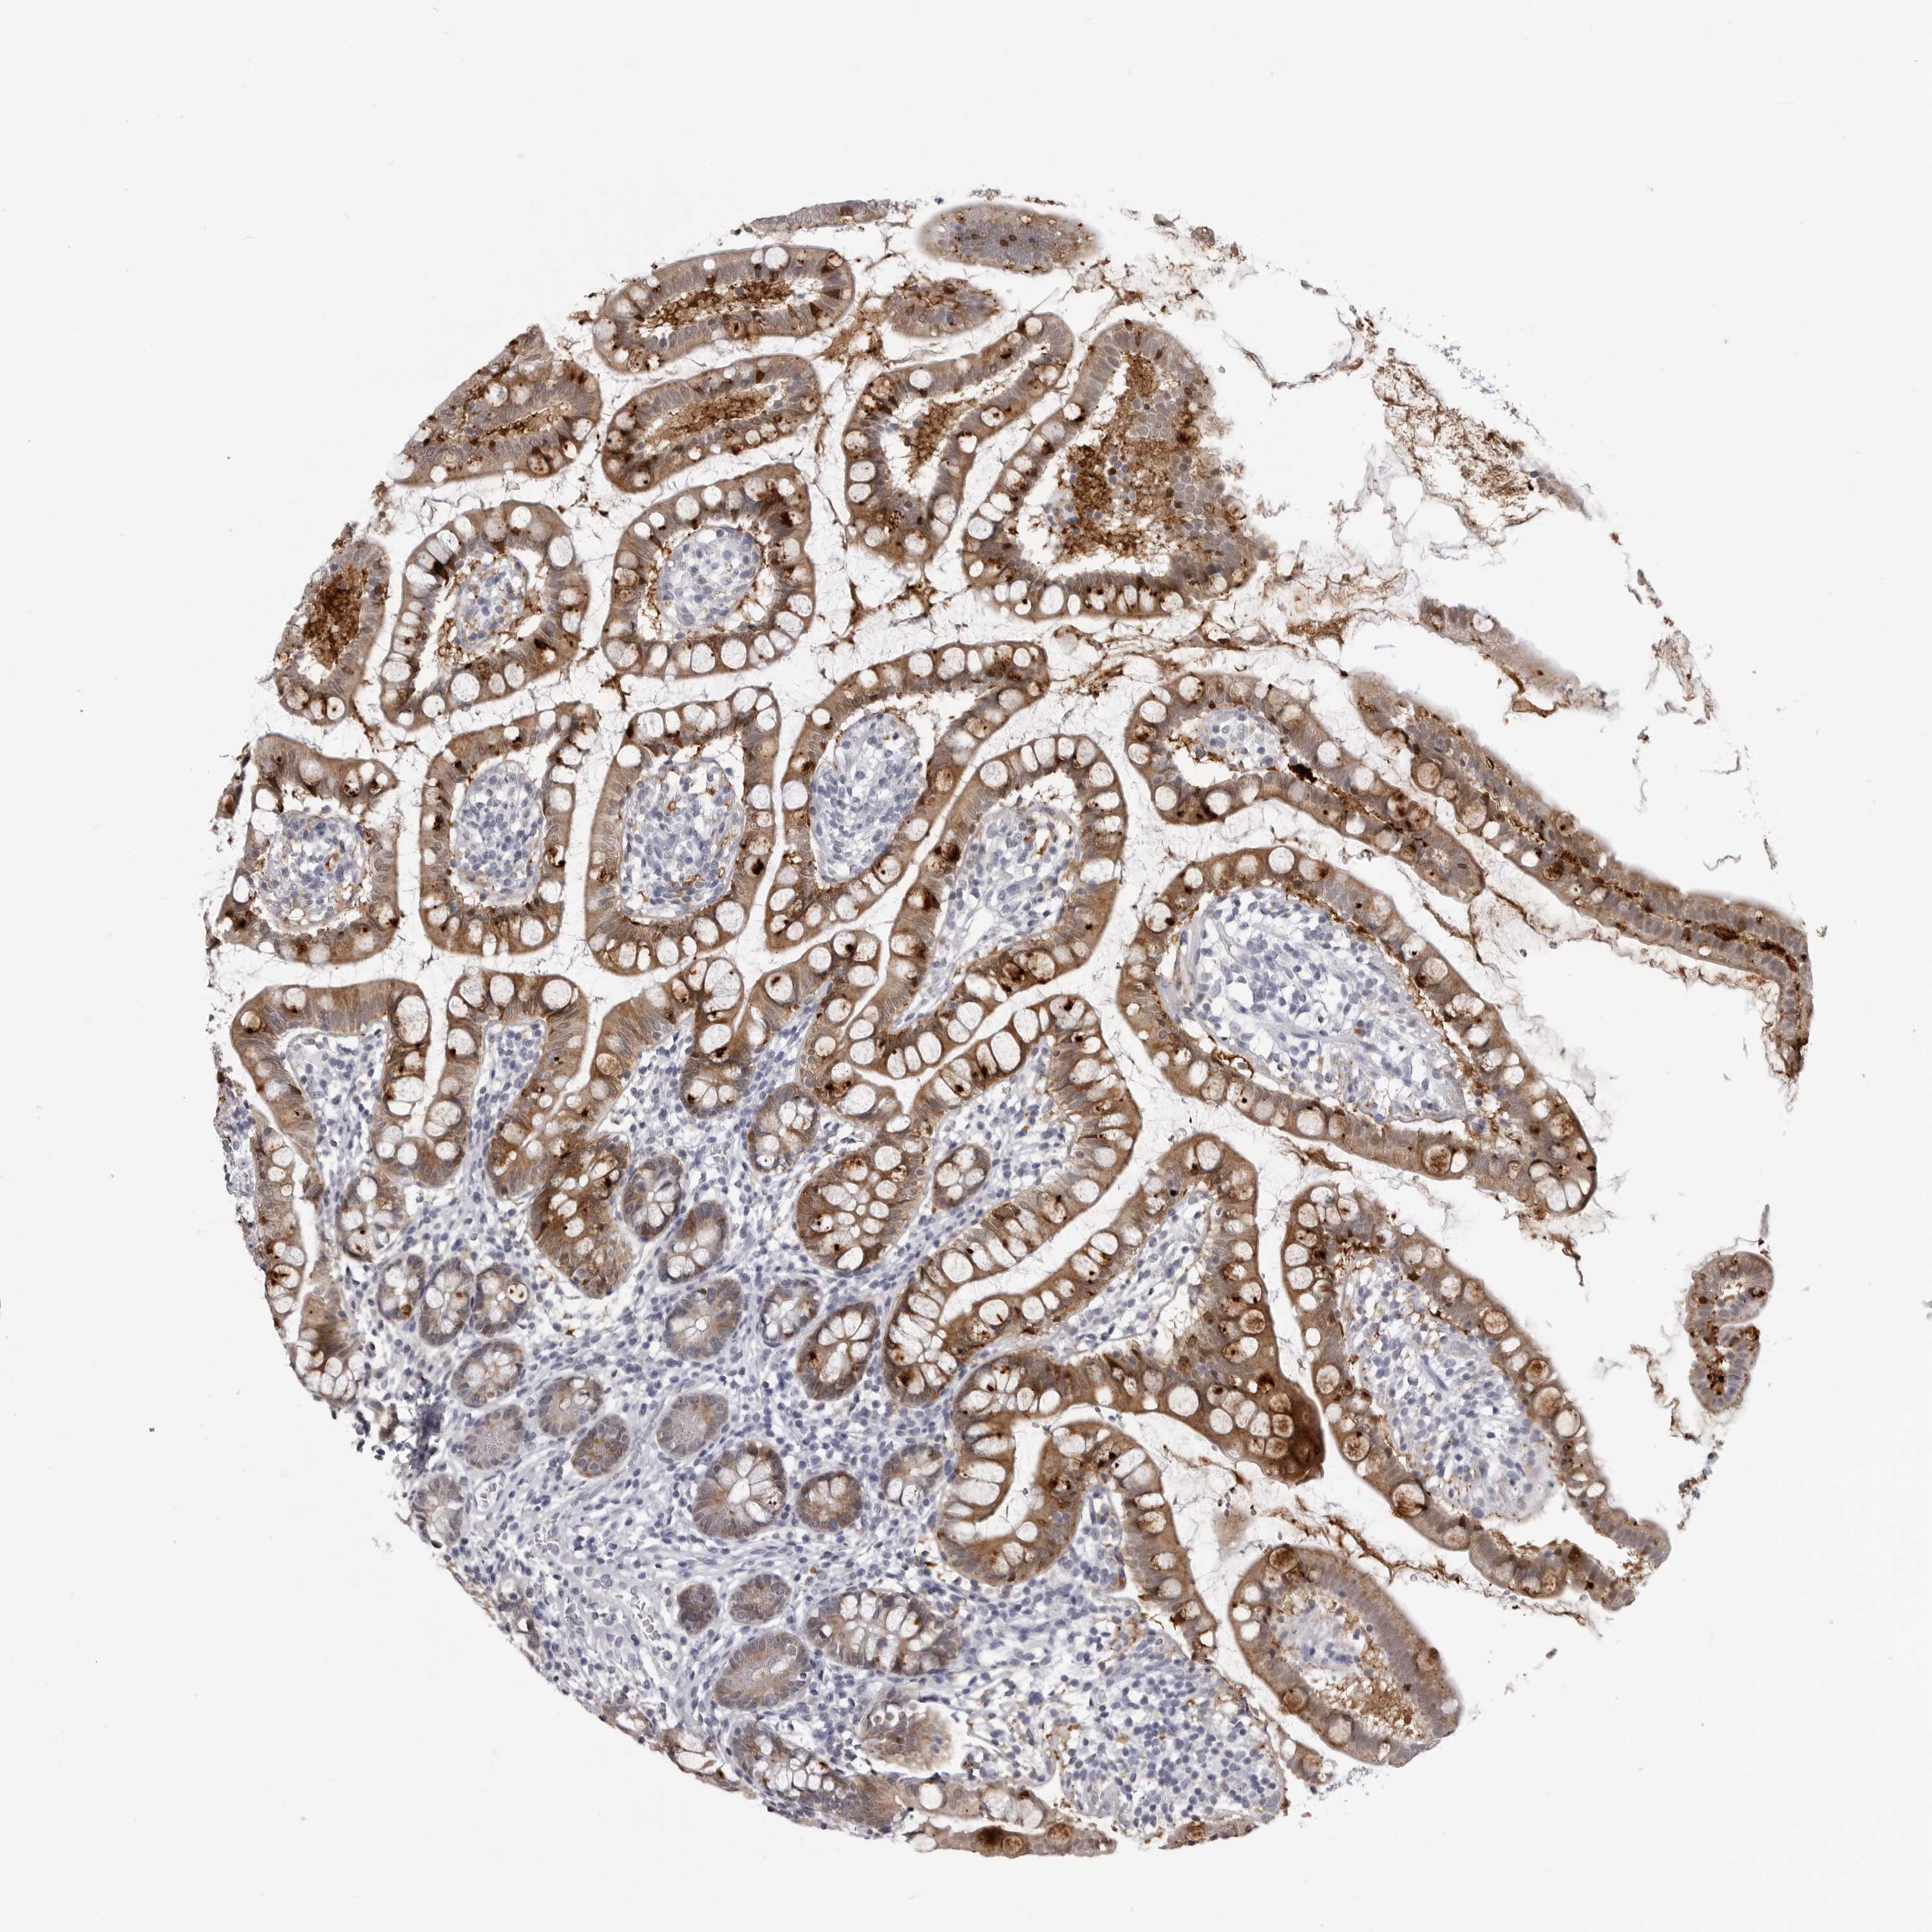
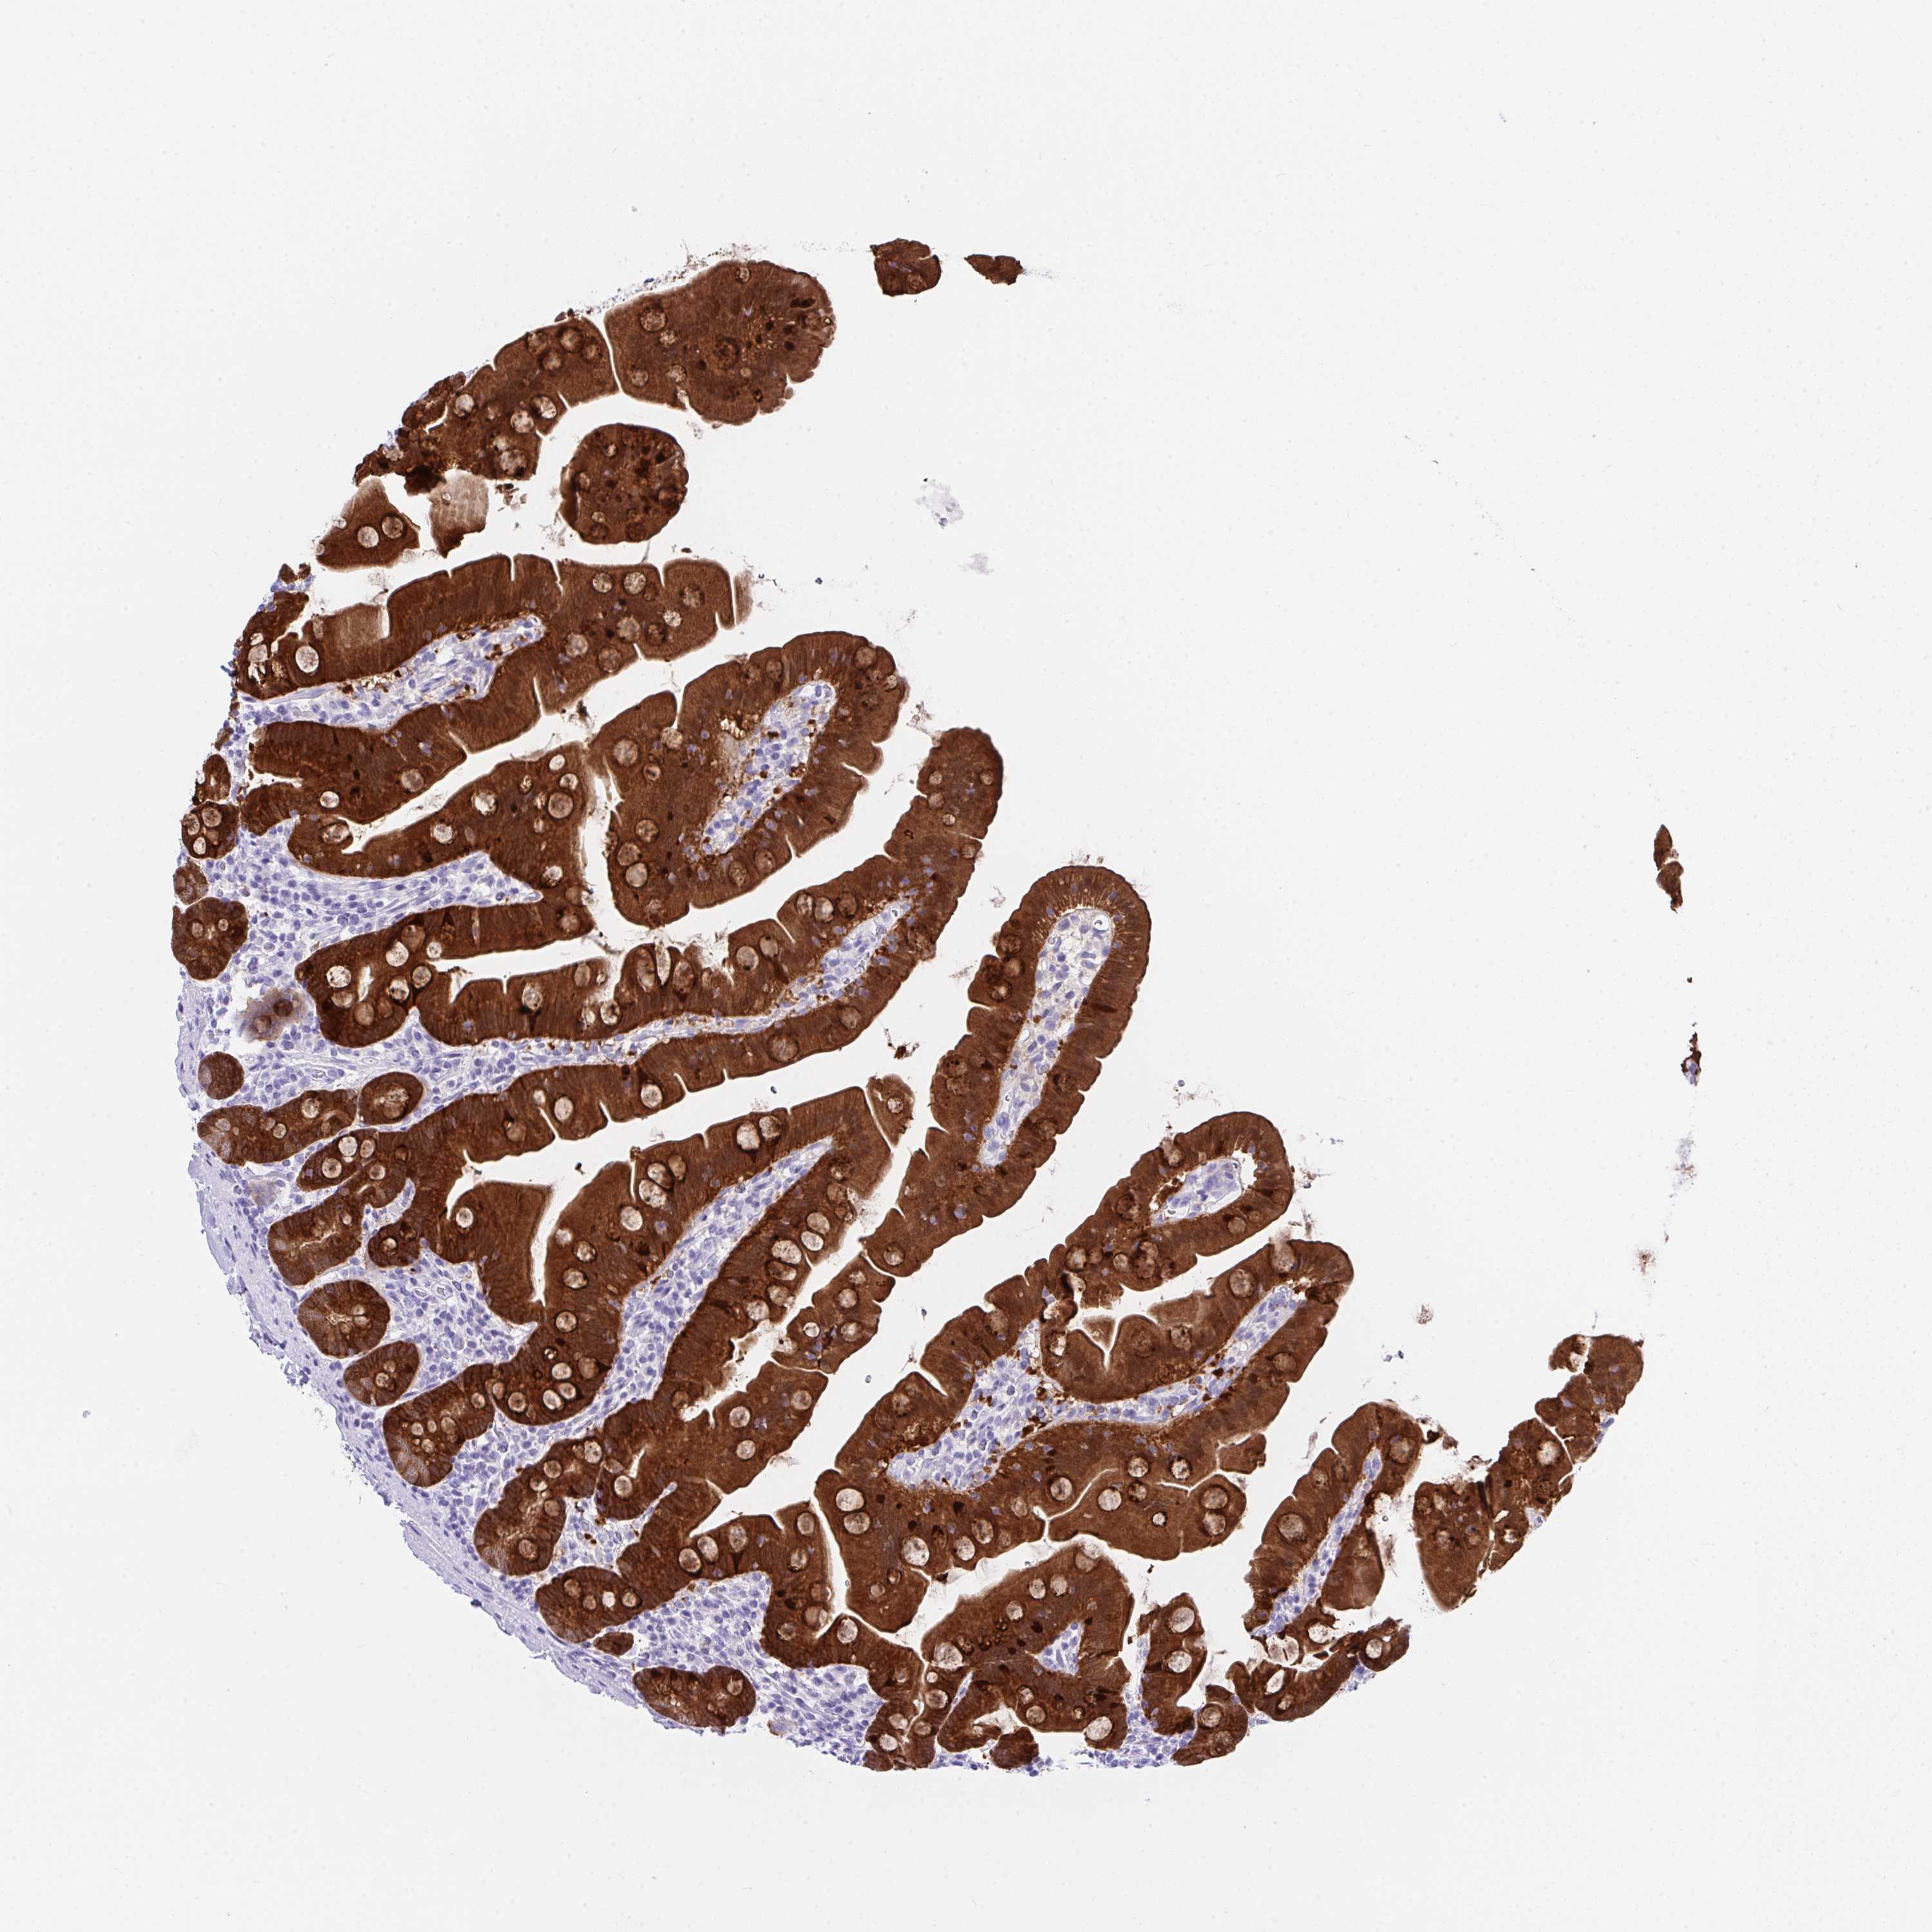
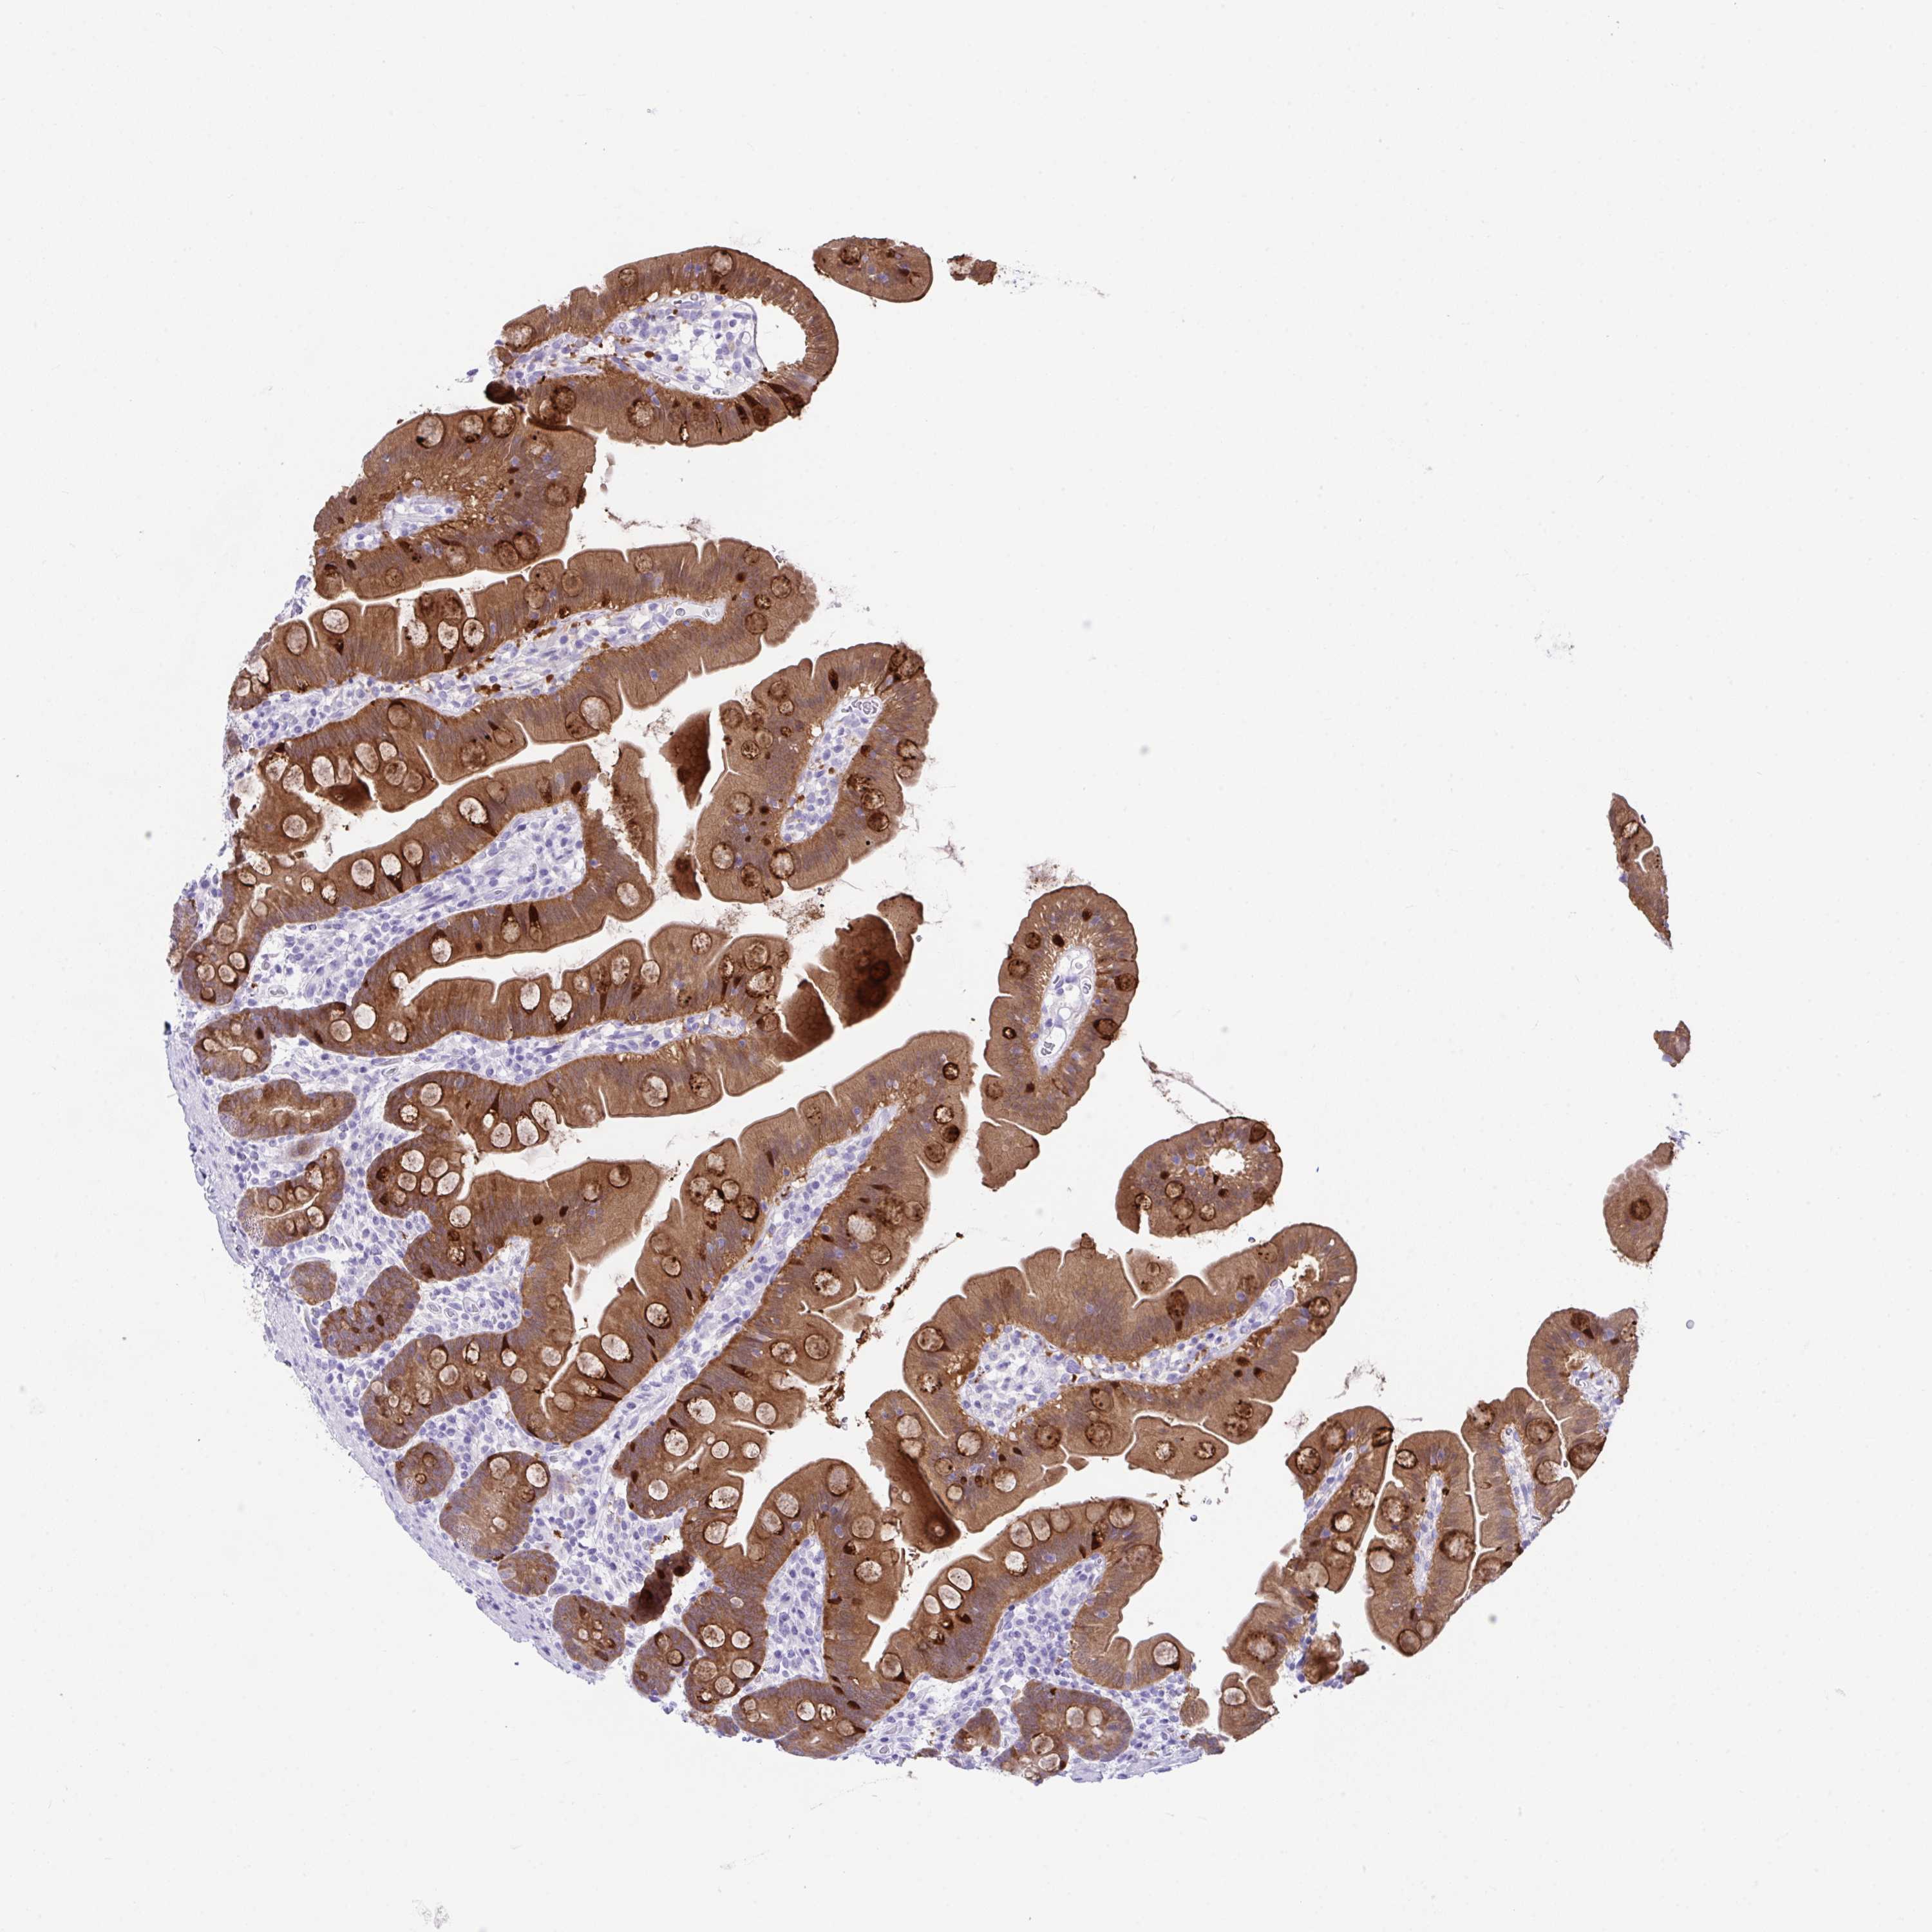
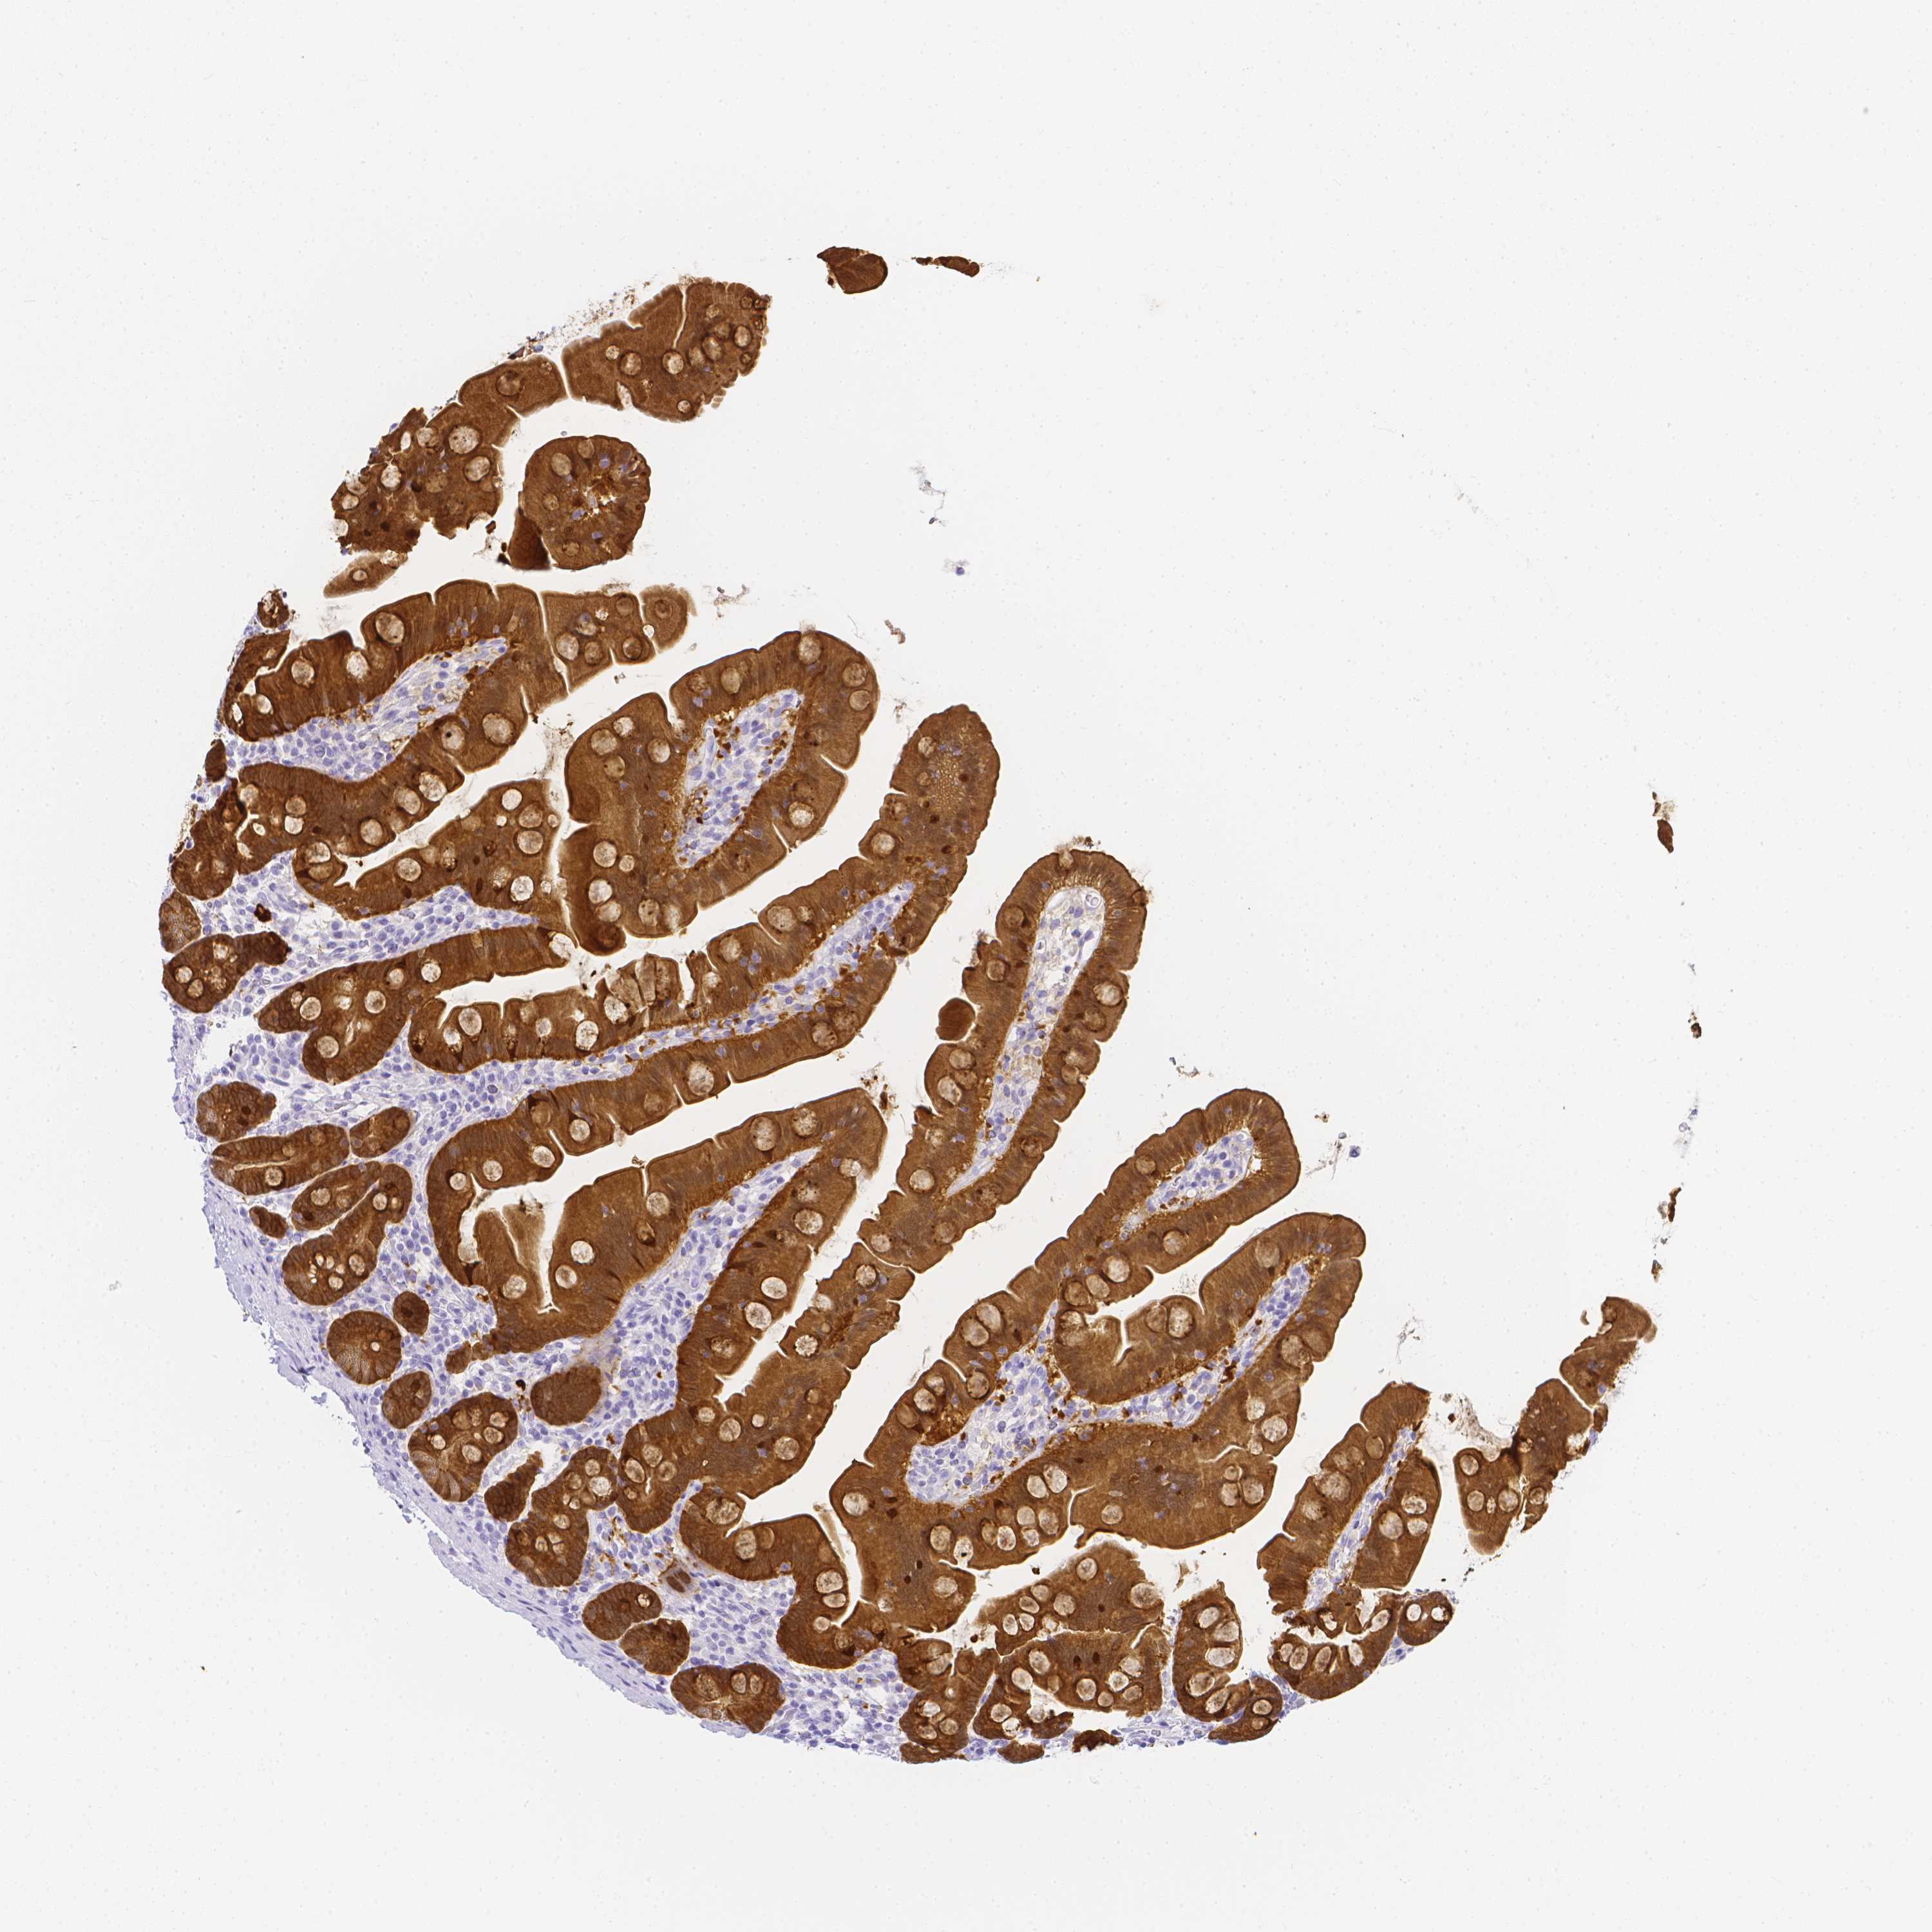
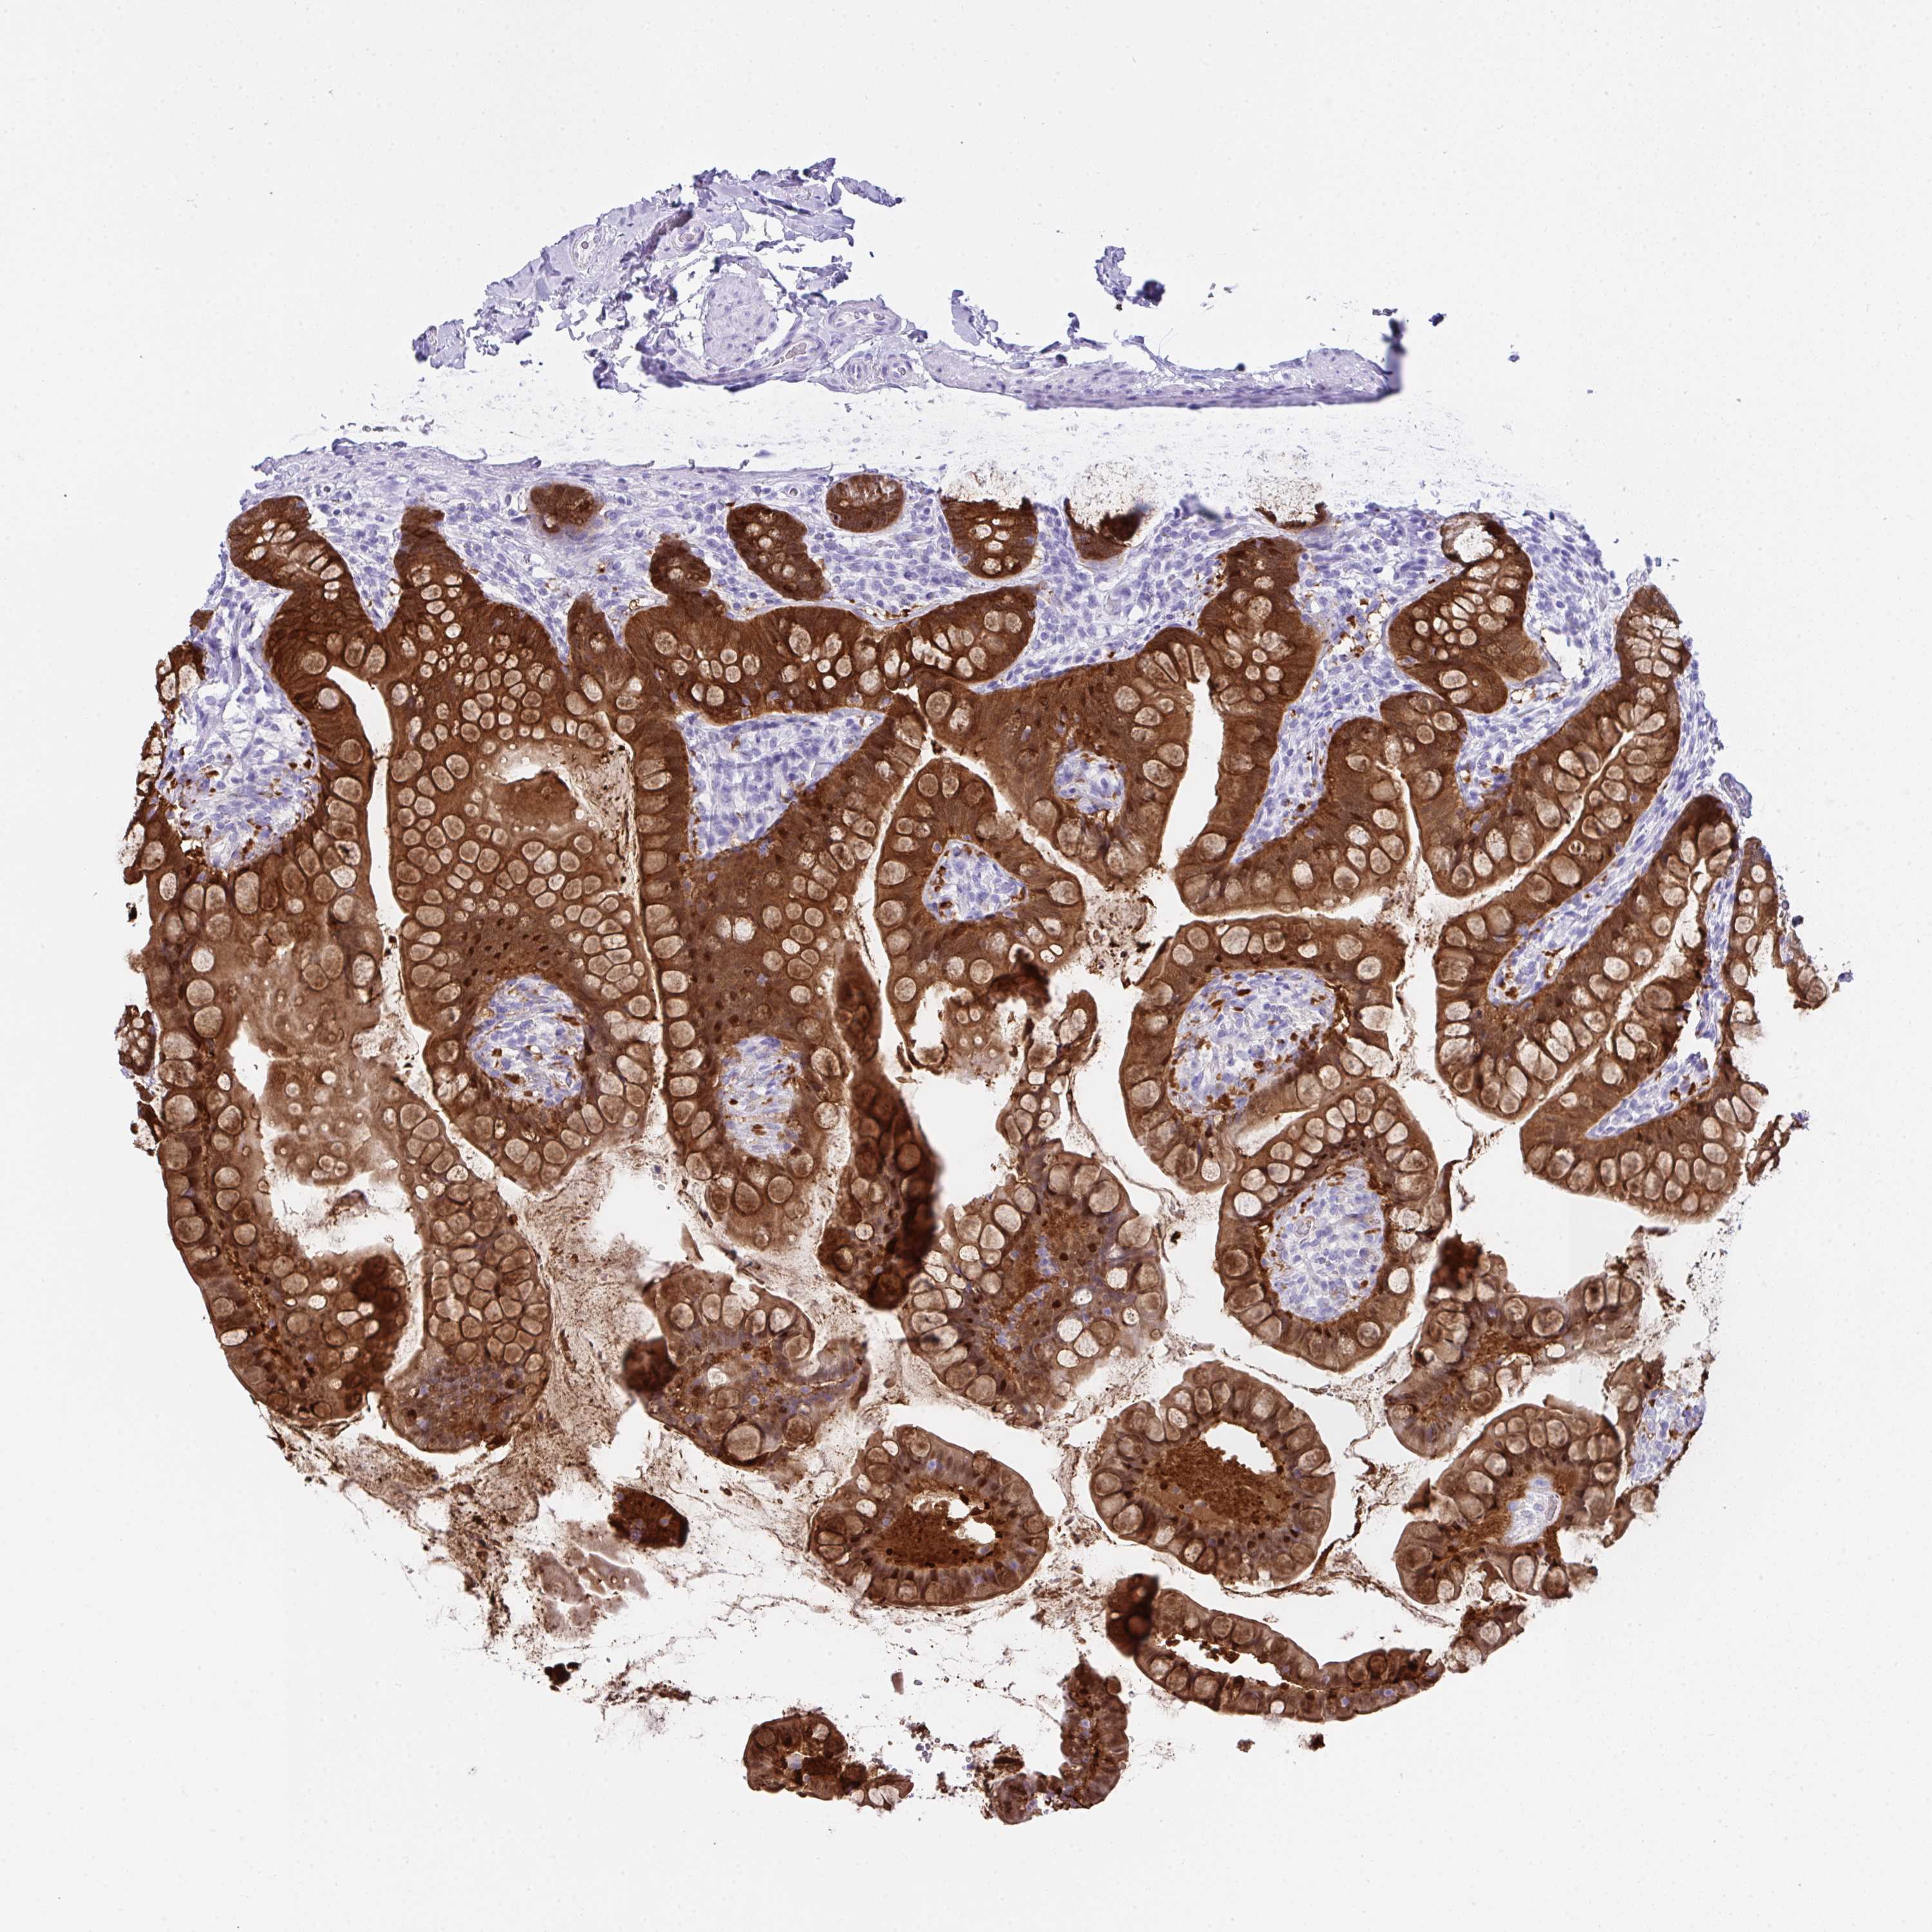
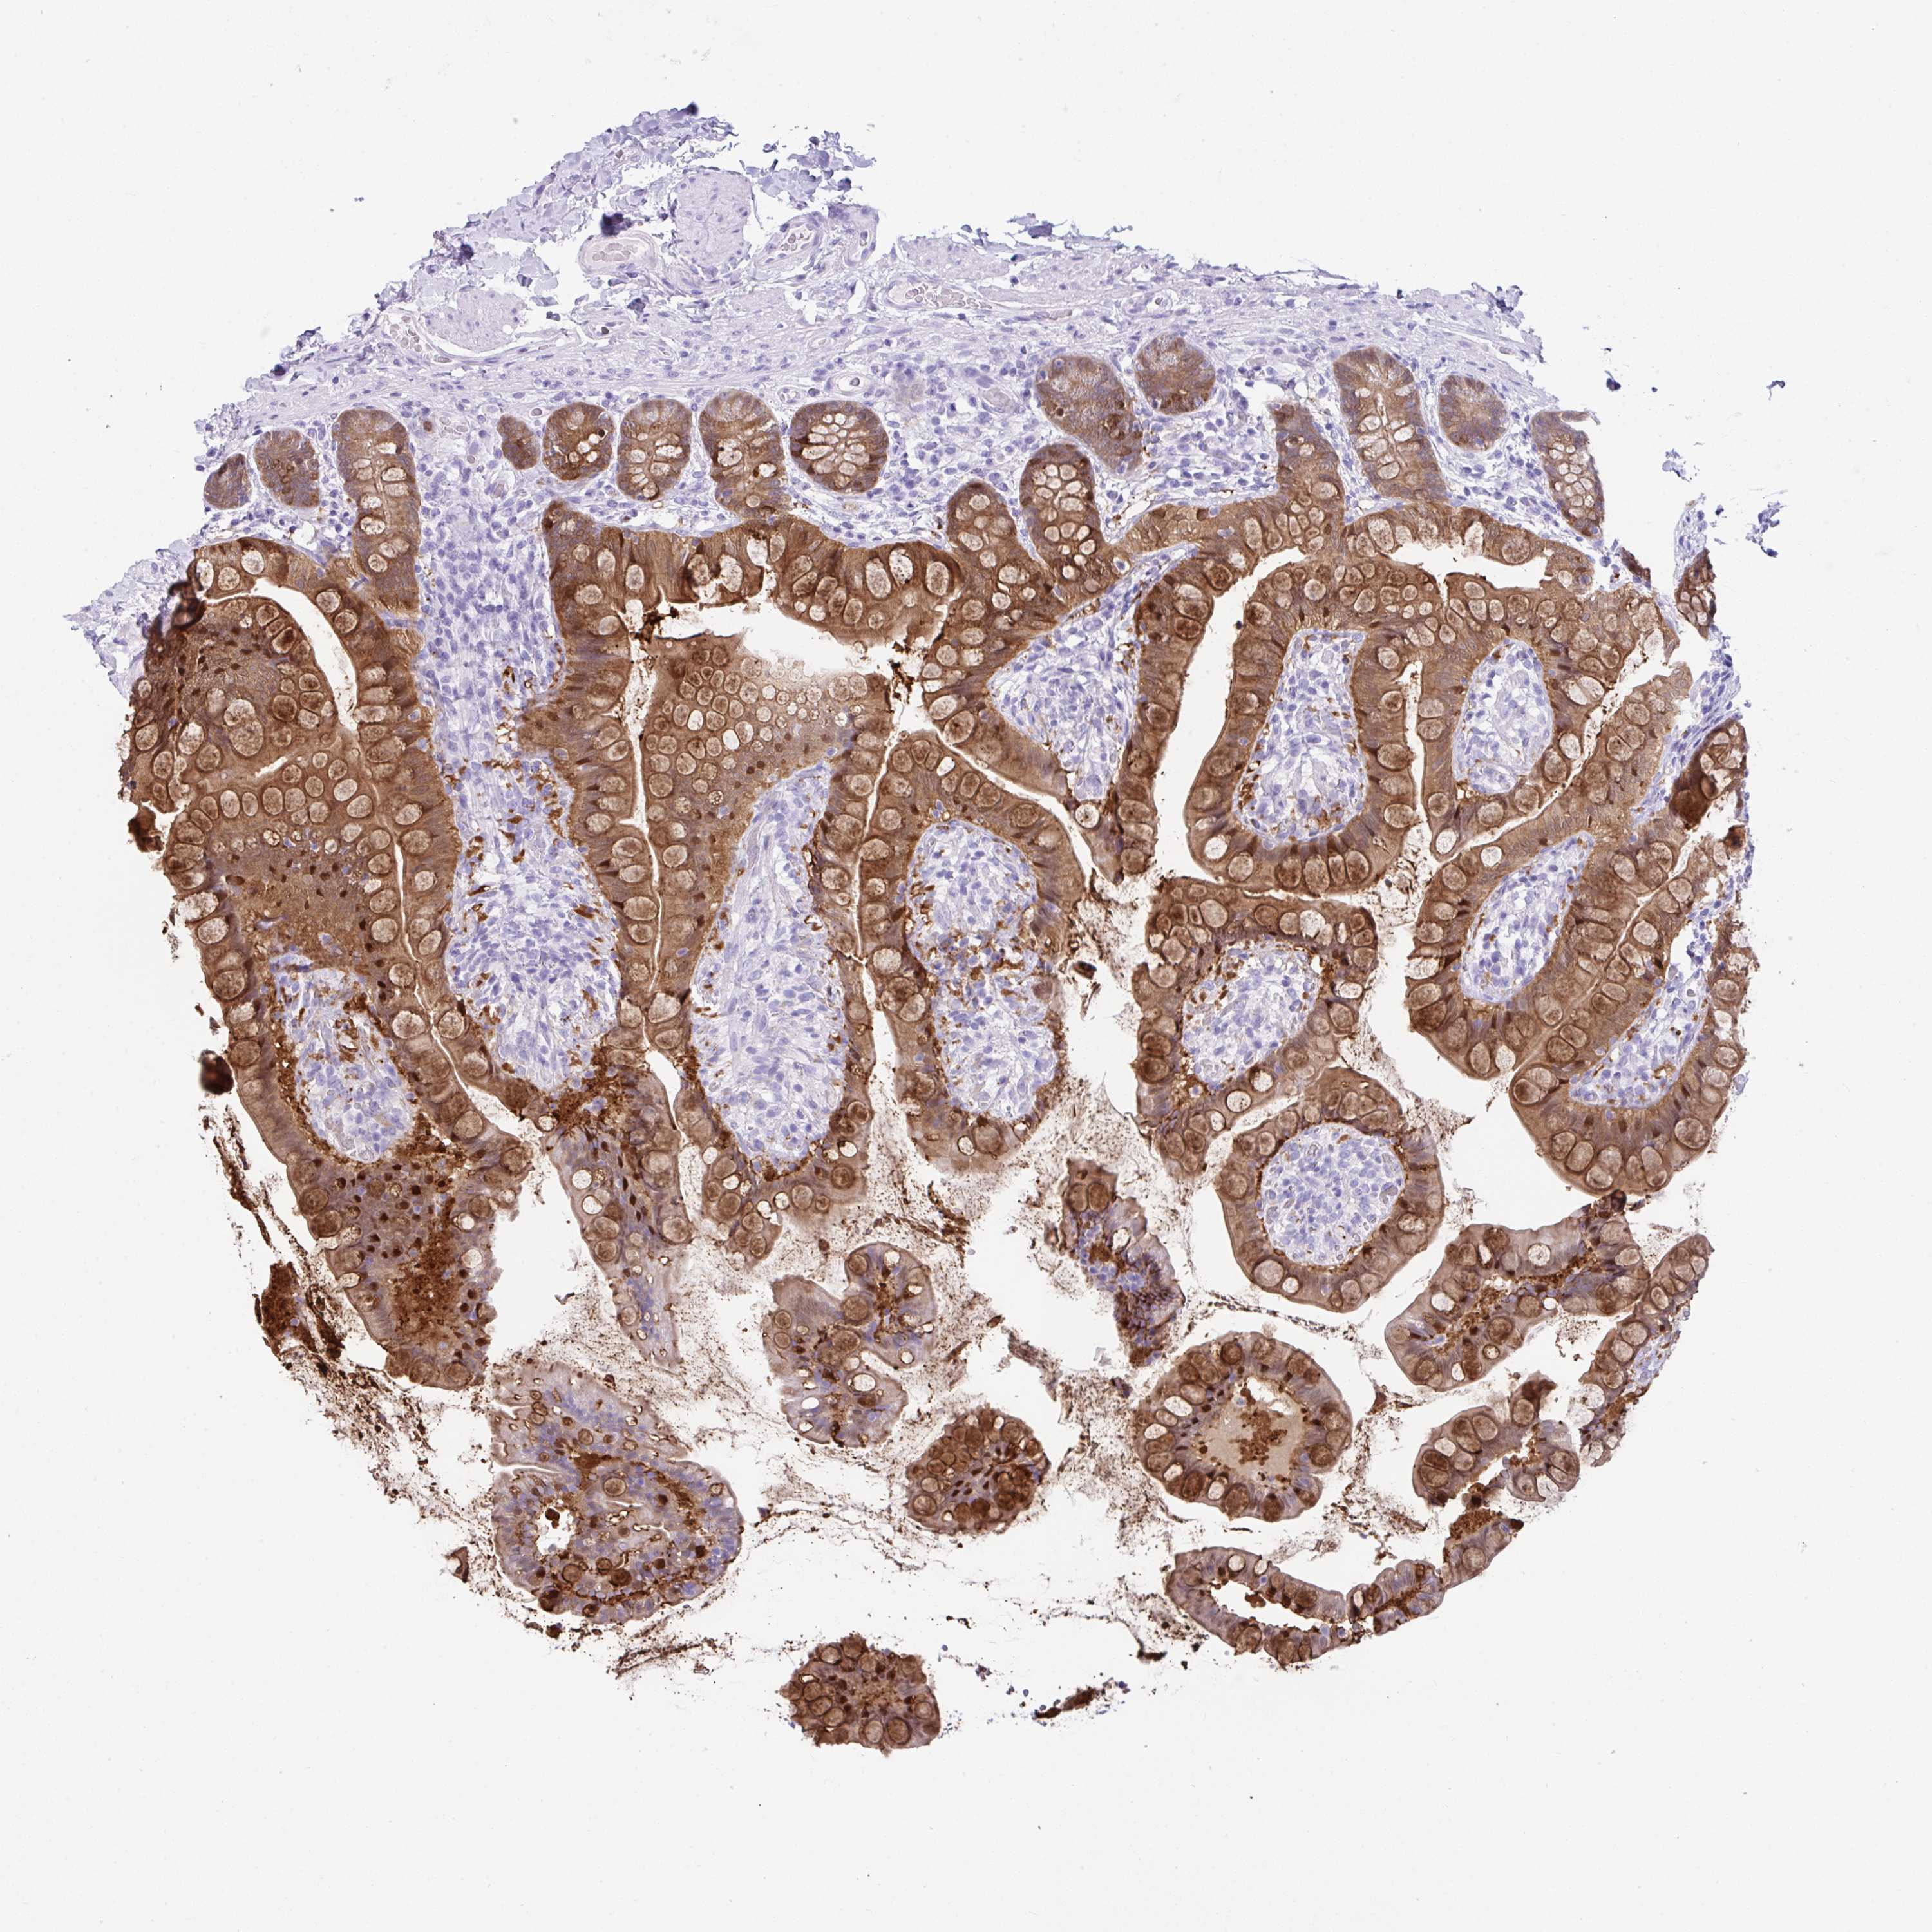
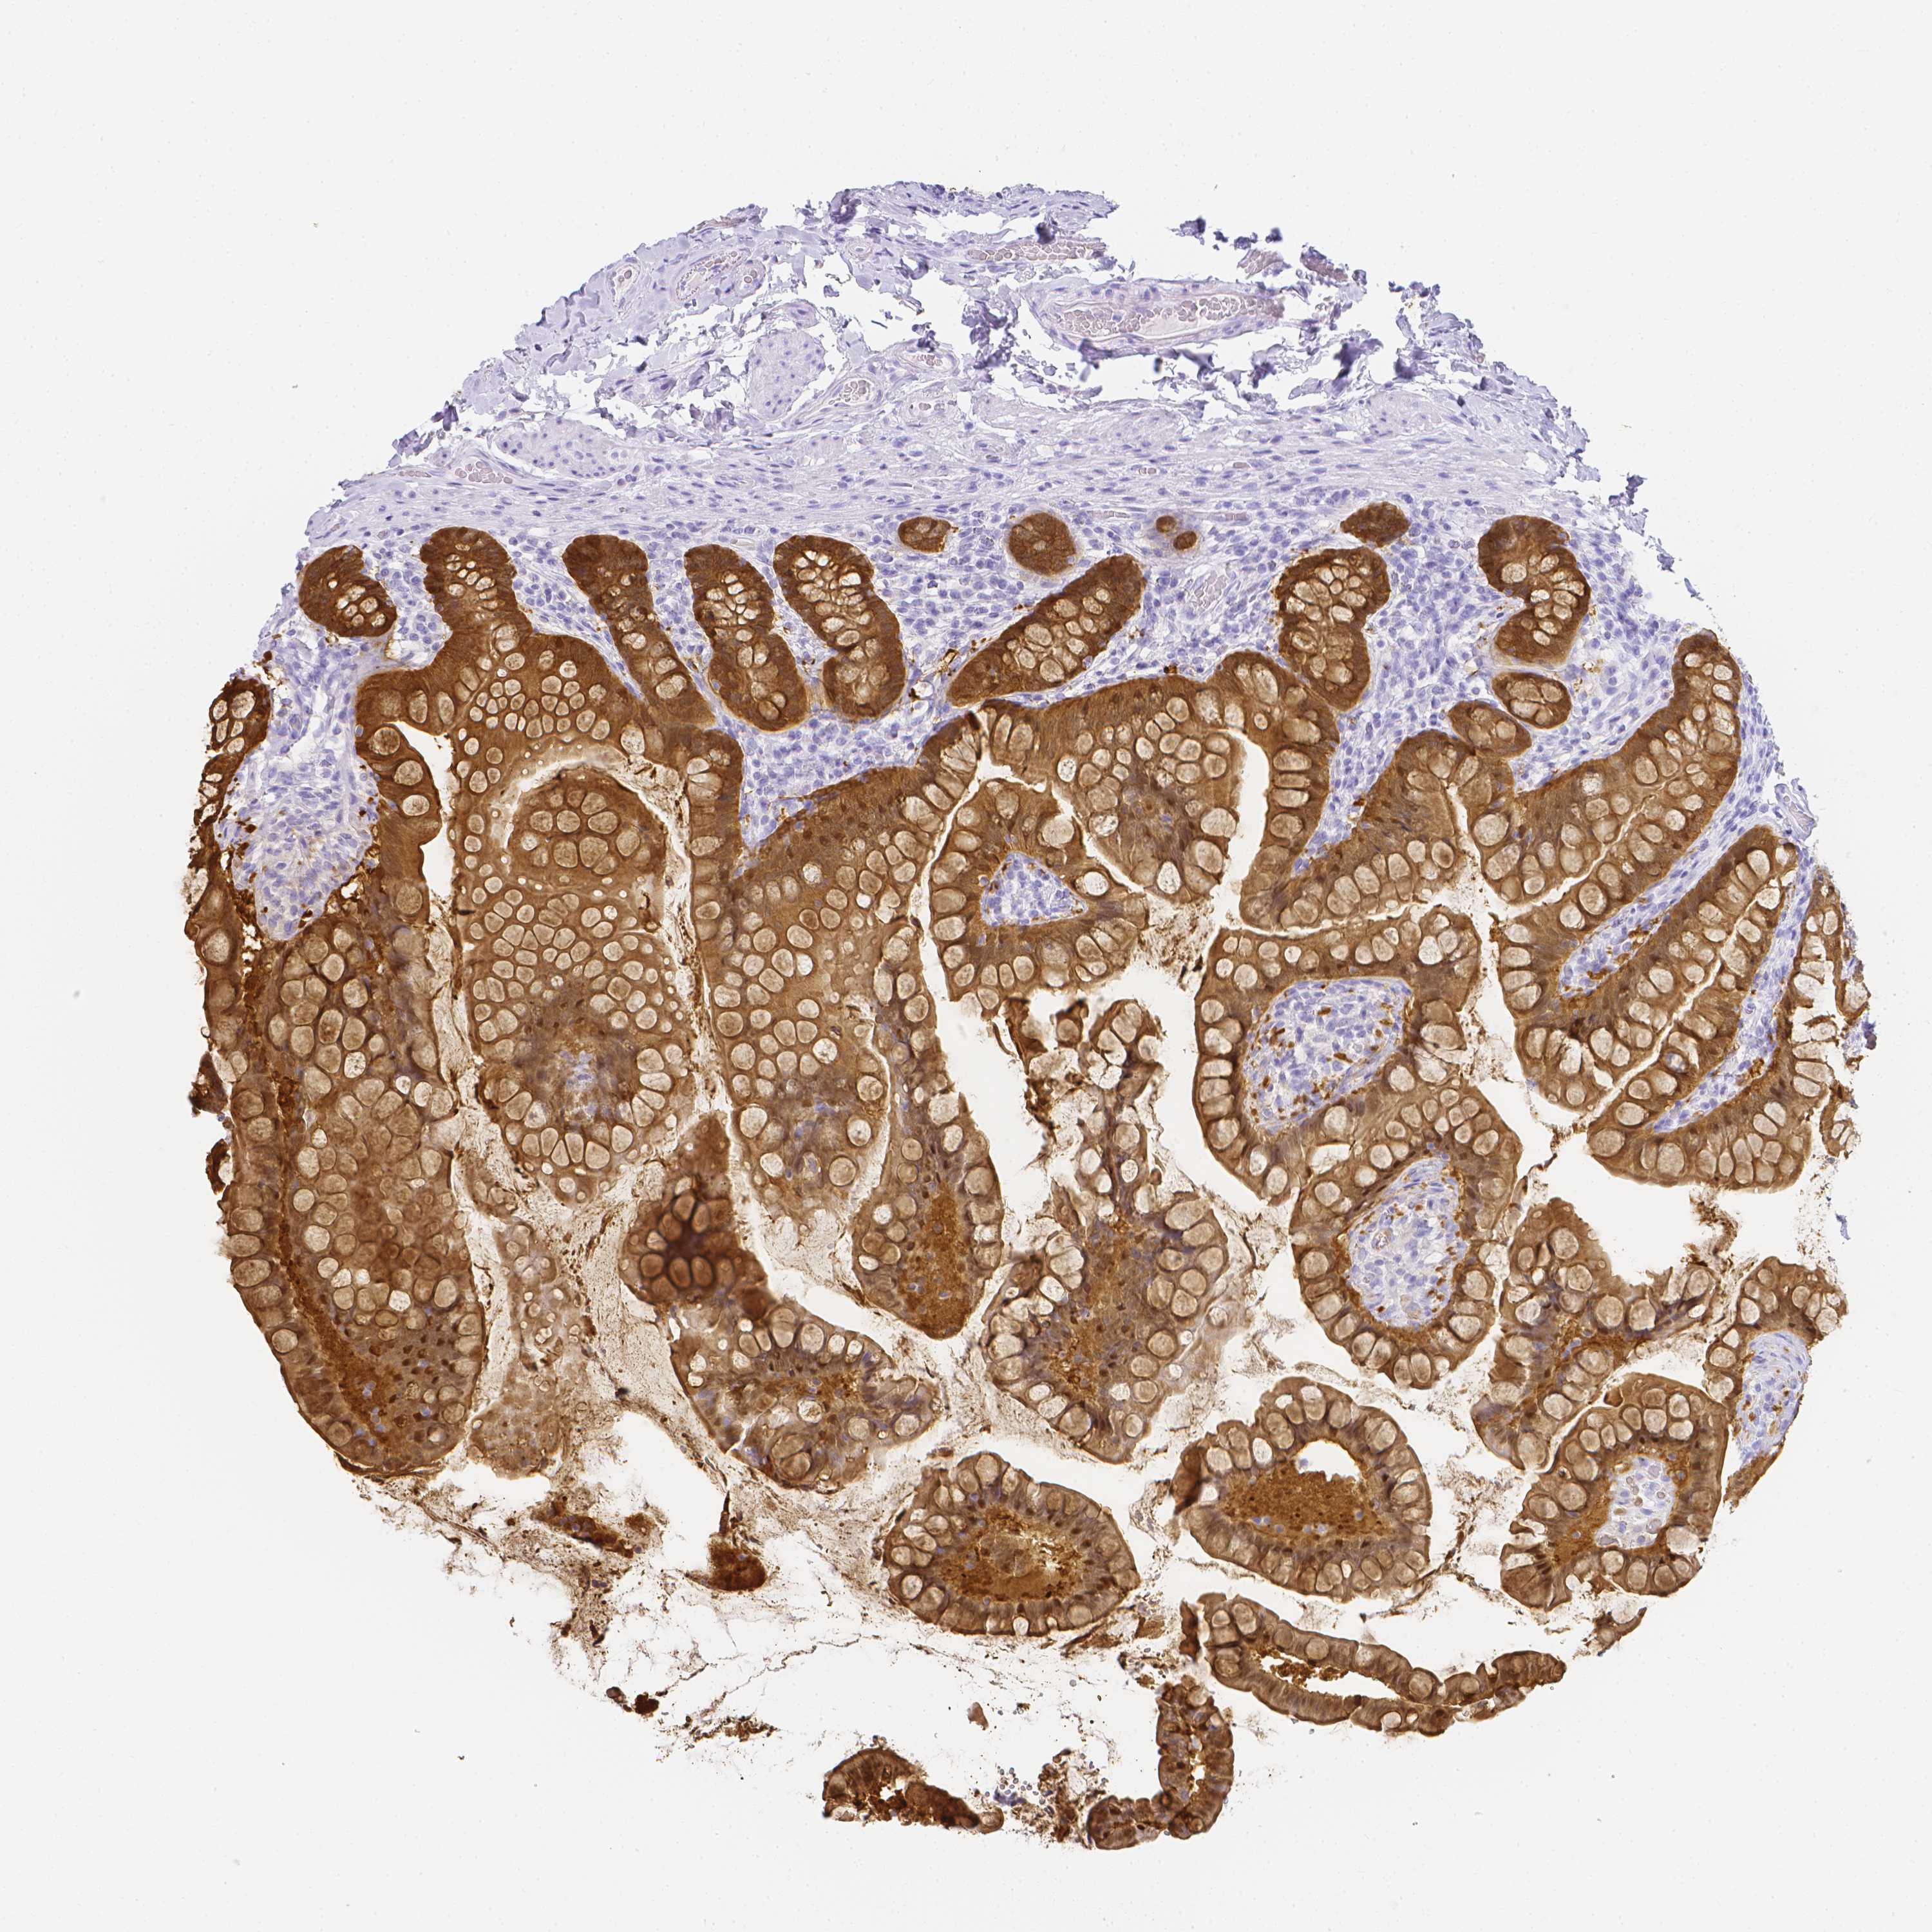
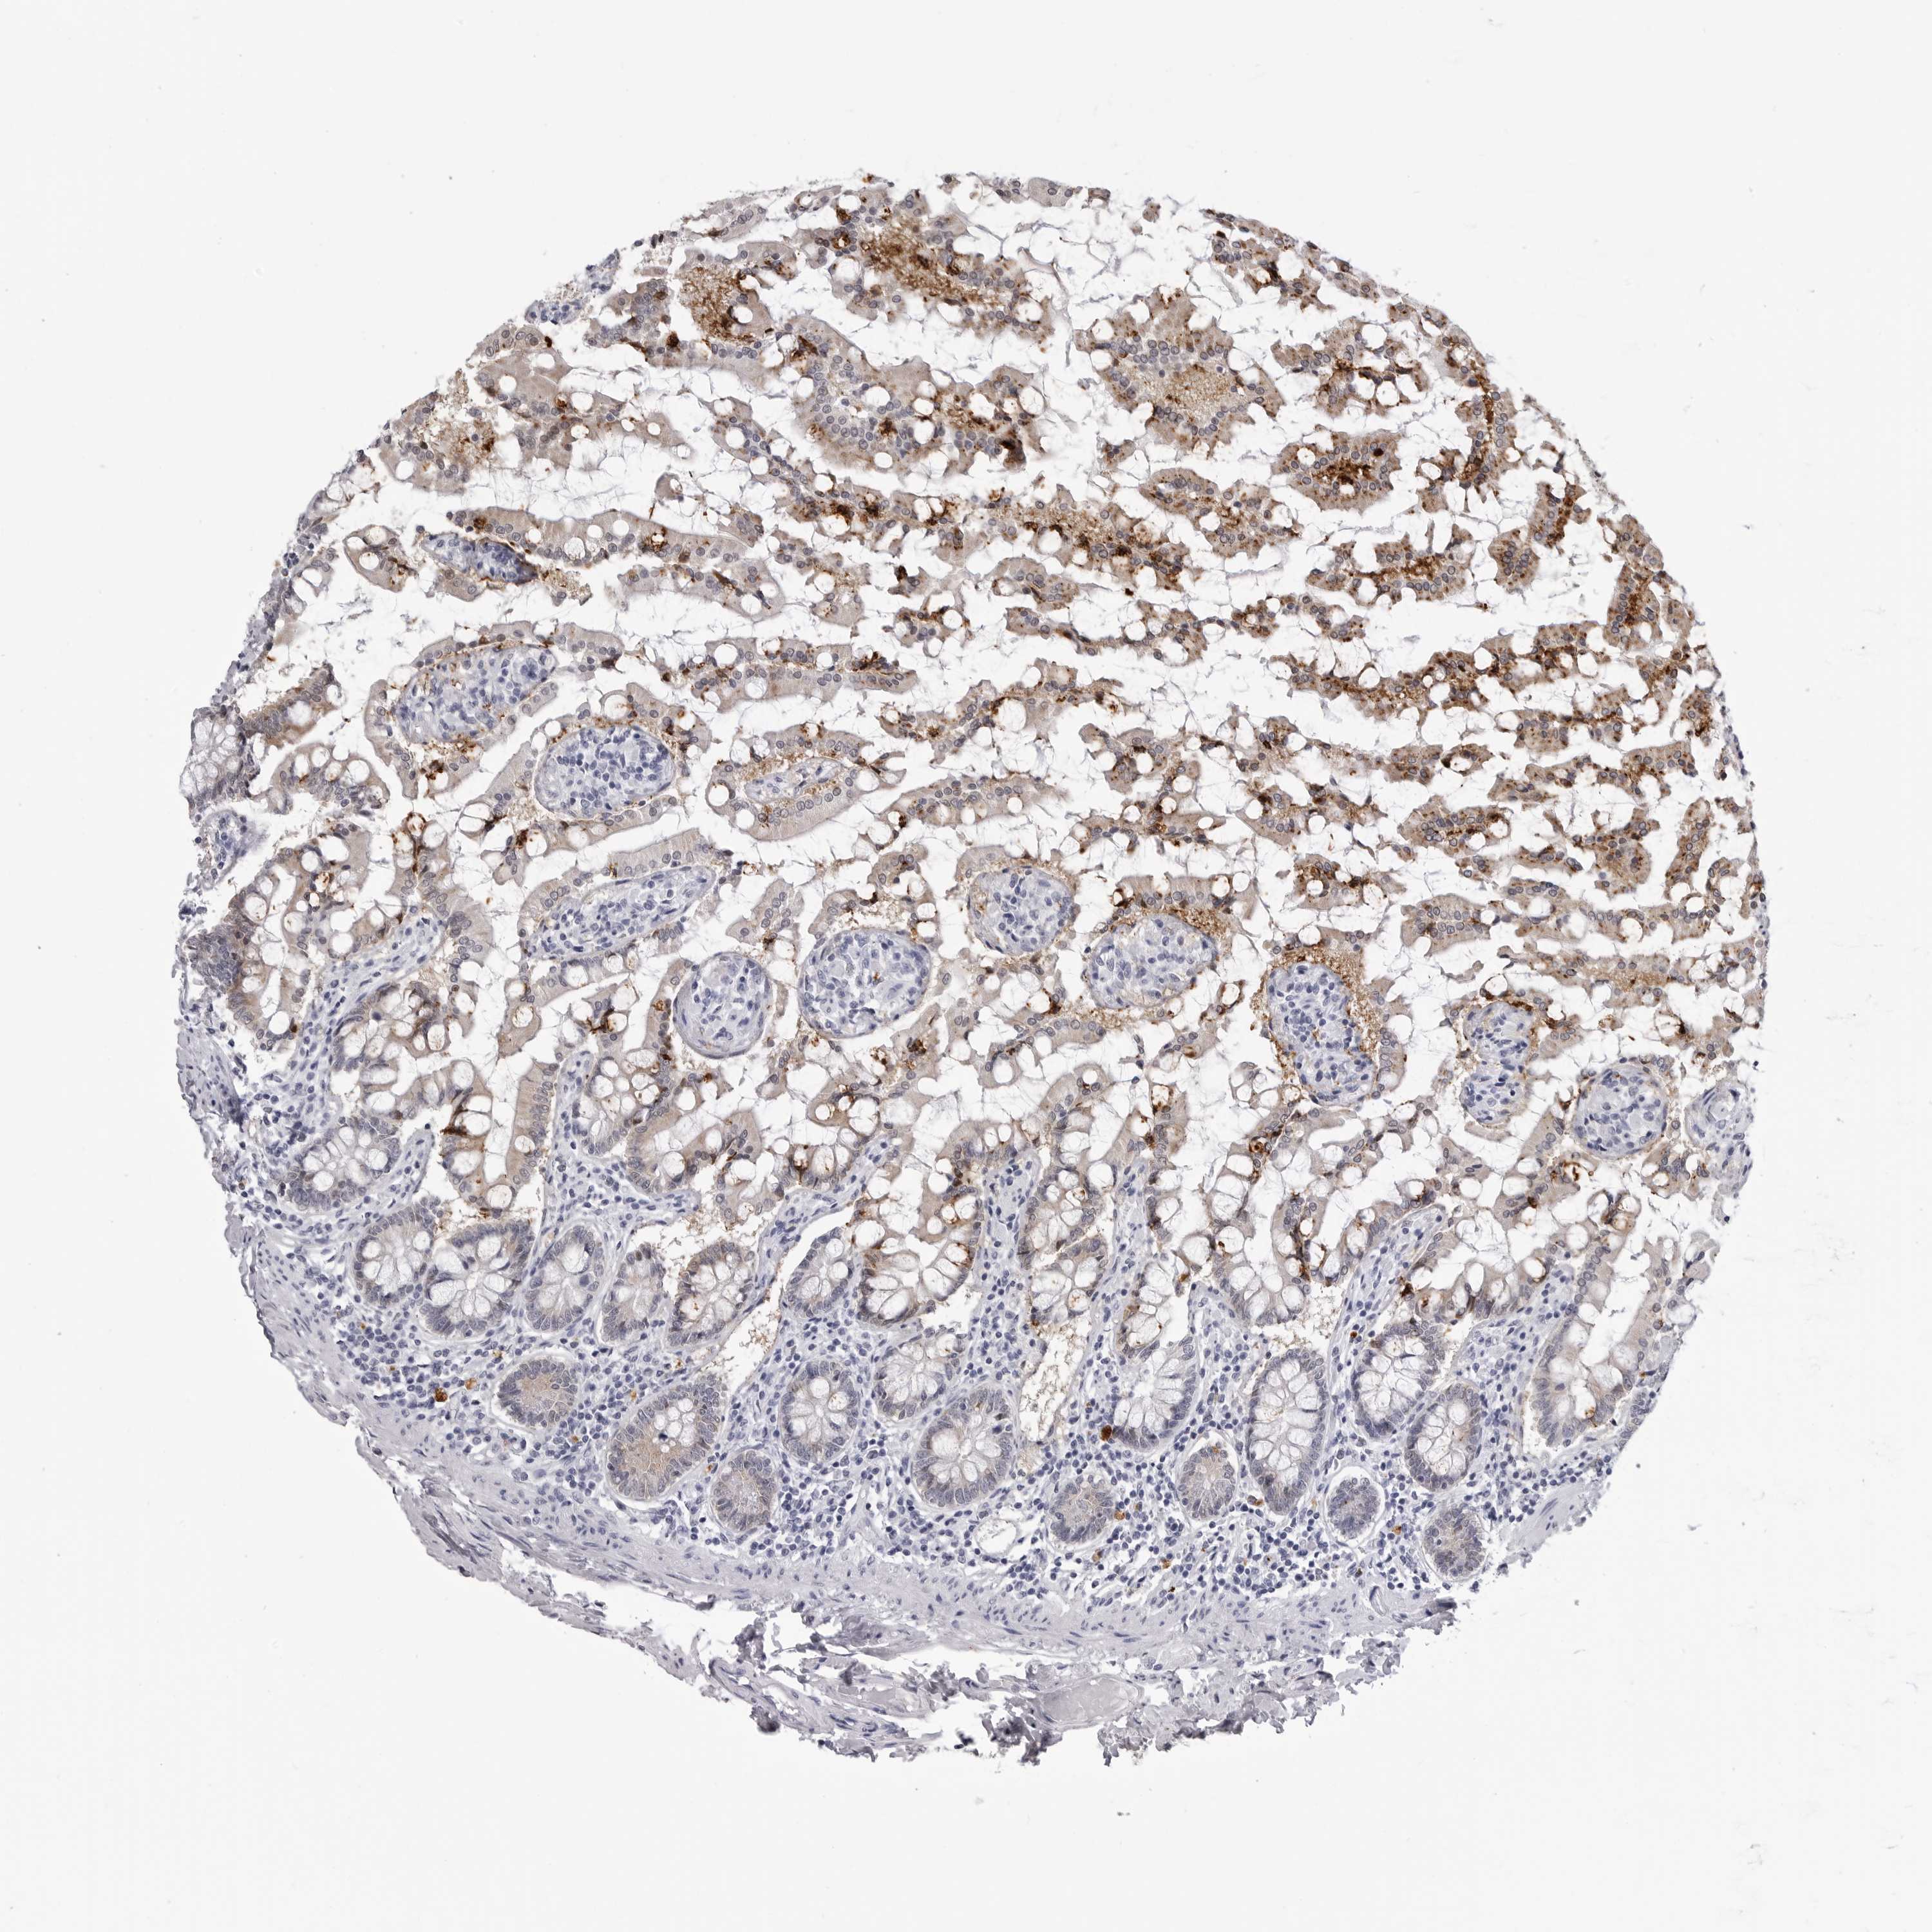
The detailed normal tissue page shows images of the stained tissue, together with antibody staining and expression level of the cell types. A knowledge-based annotated protein expression is provided for each cell type at the top of the page and the staining level of the individual antibodies is given underneath each antibody ID.
Samples from up to three different individuals have been stained for each antibody. The gender, age and tissue characterization are reported for each individual (patient) and are viewable when clicking on the image for magnification.
The images can be clicked for an enlarged view that can be panned. From the enlarged view, all stained images for all antibodies can be browsed (represented by miniature images). The miniature image with an orange overlay is the currently displayed image.
This score describes the level of antibody staining observed in the annotated cell types as not detected, low, medium, or high. It is based on the staining intensity and fraction of stained cells.
The RNA-seq details section shows detailed information about the individual samples used for the transcript profiling and results of the RNA-seq analysis.
Information about each individual sample is listed below, including gender, age, a tissue section image and estimated fractions of cell types. TPM (transcripts per million) values give a quantification of the gene abundance which is comparable between different genes and samples.
RNA-Seq data is reported as average RPKM (reads per kilobase per million mapped reads), generated by the Genotype-Tissue Expression (GTEx) project. More information can be found on the GTEx portal.
Normal distribution across the dataset is visualized with box plots, shown as median and 25th and 75th percentiles. Points are displayed as outliers if they are above or below 1.5 times the interquartile range. RPKM values of the individual samples are presented next to the box plot.
Max RPKM: 1105.2
Min RPKM: 7.5
Std RPKM: 272.0
Median RPKM: 376.6
GTEX-XGQ4-1326-SM-4GIDU
50-59 years, male
1105.2
GTEX-YB5E-1526-SM-5IFIE
40-49 years, male
1087.0
GTEX-XUZC-1426-SM-4BRV3
30-39 years, female
877.3
GTEX-ZYFG-2026-SM-5E43Y
60-69 years, female
856.8
GTEX-145LT-1026-SM-5LU9O
40-49 years, male
856.0
GTEX-ZLV1-1126-SM-4WWBW
60-69 years, female
849.1
GTEX-1122O-1326-SM-5H11F
60-69 years, female
798.3
GTEX-ZXES-1526-SM-5NQ95
30-39 years, female
795.7
GTEX-ZYWO-1526-SM-5SIAL
40-49 years, female
793.6
GTEX-14DAR-1426-SM-5RQIR
50-59 years, male
789.0
GTEX-YF7O-1826-SM-5IFIU
50-59 years, male
779.5
GTEX-131XF-1326-SM-5GCMQ
60-69 years, male
772.0
GTEX-111YS-1426-SM-5GID8
60-69 years, male
743.7
GTEX-133LE-1426-SM-5IFH1
20-29 years, female
740.4
GTEX-Y5LM-1626-SM-4VDTB
40-49 years, female
734.6
GTEX-ZVZP-1826-SM-5GZXB
50-59 years, male
701.4
GTEX-ZA64-1226-SM-5HL7B
20-29 years, male
698.8
GTEX-13113-1226-SM-5EGHT
60-69 years, female
678.3
GTEX-13D11-0726-SM-5LZZB
50-59 years, female
671.4
GTEX-11EQ9-1326-SM-5985X
30-39 years, male
666.7
GTEX-ZZ64-0526-SM-5GZXM
20-29 years, male
648.9
GTEX-11I78-1126-SM-5A5K5
50-59 years, female
645.0
GTEX-YEC4-1726-SM-4W21E
40-49 years, male
643.2
GTEX-Y9LG-1626-SM-5IFHM
30-39 years, male
630.3
GTEX-ZTSS-0926-SM-59865
40-49 years, male
614.7
GTEX-11DXX-1626-SM-5H11H
60-69 years, female
607.0
GTEX-13FTW-2026-SM-5IJE2
40-49 years, male
607.0
GTEX-ZPCL-1726-SM-57WEO
60-69 years, female
602.5
GTEX-139YR-2226-SM-5IFFW
50-59 years, male
589.7
GTEX-ZTX8-0526-SM-59HLD
20-29 years, male
585.4
GTEX-X5EB-1626-SM-4E3IV
40-49 years, male
580.6
GTEX-13PL7-2626-SM-5IFH4
60-69 years, female
532.6
GTEX-11DXZ-1326-SM-5H11X
50-59 years, male
524.4
GTEX-1399R-2026-SM-5K7WN
30-39 years, male
516.1
GTEX-WFG8-1626-SM-4LVMB
20-29 years, male
506.1
GTEX-WQUQ-2426-SM-4MVNW
60-69 years, male
502.1
GTEX-ZEX8-1826-SM-57WBH
50-59 years, male
468.2
GTEX-14E6E-1626-SM-5RQI7
30-39 years, male
456.5
GTEX-ZTPG-2626-SM-57WFX
20-29 years, female
429.9
GTEX-139T6-1026-SM-5IJGC
50-59 years, male
426.9
GTEX-11P82-0826-SM-5P9GU
20-29 years, male
425.3
GTEX-1399S-2026-SM-5KM4B
30-39 years, female
417.4
GTEX-XBED-1426-SM-4AT4G
60-69 years, male
409.8
GTEX-11NSD-1726-SM-5N9C3
20-29 years, male
392.6
GTEX-ZLFU-1526-SM-4WWBT
40-49 years, male
360.5
GTEX-11P7K-1626-SM-5GU63
30-39 years, male
354.3
GTEX-13O61-1326-SM-5KM31
60-69 years, male
350.8
GTEX-WFJO-0926-SM-4LVM2
30-39 years, male
344.1
GTEX-WH7G-1626-SM-4LVMY
40-49 years, male
343.5
GTEX-ZVT2-2126-SM-5NQ93
50-59 years, female
336.1
GTEX-XXEK-1026-SM-4BRUW
50-59 years, male
331.5
GTEX-12BJ1-1926-SM-5HL9Z
60-69 years, male
330.4
GTEX-ZVP2-1726-SM-5GU5P
50-59 years, male
313.0
GTEX-XAJ8-0526-SM-47JYK
40-49 years, male
312.1
GTEX-WRHK-1026-SM-4MVOD
20-29 years, female
307.9
GTEX-1399U-2126-SM-5IFEZ
50-59 years, female
305.9
GTEX-WFG7-1726-SM-4LVME
20-29 years, male
305.0
GTEX-ZP4G-1626-SM-57WGD
20-29 years, female
304.1
GTEX-13CF3-1226-SM-5LZXN
60-69 years, female
277.0
GTEX-Z9EW-0926-SM-5CVMM
40-49 years, male
266.9
GTEX-13FH7-1226-SM-5IJFK
50-59 years, female
261.5
GTEX-Y3IK-1726-SM-4YCCR
50-59 years, female
252.9
GTEX-11XUK-1426-SM-5EQMG
40-49 years, female
251.2
GTEX-VJYA-0926-SM-4KL1N
60-69 years, male
249.9
GTEX-13RTK-0826-SM-5Q5C6
20-29 years, male
247.5
GTEX-131XG-1726-SM-5LZUR
50-59 years, female
244.1
GTEX-Y114-1426-SM-4TT6W
50-59 years, female
233.7
GTEX-ZPIC-2326-SM-57WDW
40-49 years, female
220.5
GTEX-13O21-1026-SM-5IJDU
50-59 years, male
198.0
GTEX-11VI4-1626-SM-5EQKO
40-49 years, female
191.9
GTEX-13QBU-1926-SM-5IJEW
40-49 years, female
180.7
GTEX-X15G-1426-SM-4PQZK
50-59 years, female
164.2
GTEX-148VJ-2226-SM-5NQ9M
70-79 years, male
126.7
GTEX-ZQG8-2526-SM-57WEQ
60-69 years, female
124.5
GTEX-12WSK-1526-SM-5CVNO
40-49 years, female
110.0
GTEX-145ME-0926-SM-5O9AR
40-49 years, female
101.5
GTEX-VUSG-1726-SM-4KKZL
50-59 years, male
85.3
GTEX-13OVI-1926-SM-5IJCG
60-69 years, female
54.1
GTEX-13111-1426-SM-5DUW3
50-59 years, male
36.2
GTEX-WEY5-1526-SM-4LMJF
40-49 years, female
23.4
GTEX-111CU-1326-SM-5NQ8L
50-59 years, male
19.6
GTEX-ZQUD-0926-SM-57WE3
30-39 years, male
18.2
GTEX-ZF2S-1726-SM-57WFT
50-59 years, female
16.8
GTEX-1192X-2526-SM-59868
50-59 years, male
10.7
GTEX-ZC5H-2326-SM-4WAYT
40-49 years, female
10.4
GTEX-XMK1-1826-SM-4B66F
40-49 years, male
9.7
GTEX-117YX-0326-SM-5GICL
50-59 years, male
8.4
GTEX-UPK5-2026-SM-4JBIM
40-49 years, male
7.5
Show all
SMALL INTESTINE - FANTOM5 CAGEi
Tissue data obtained through Cap Analysis of Gene Expression (CAGE) are reported as Tags Per Million, generated by the FANTOM5 project. More information can be found here.
 The Human Protein Atlas project is funded


 MENU
MENU


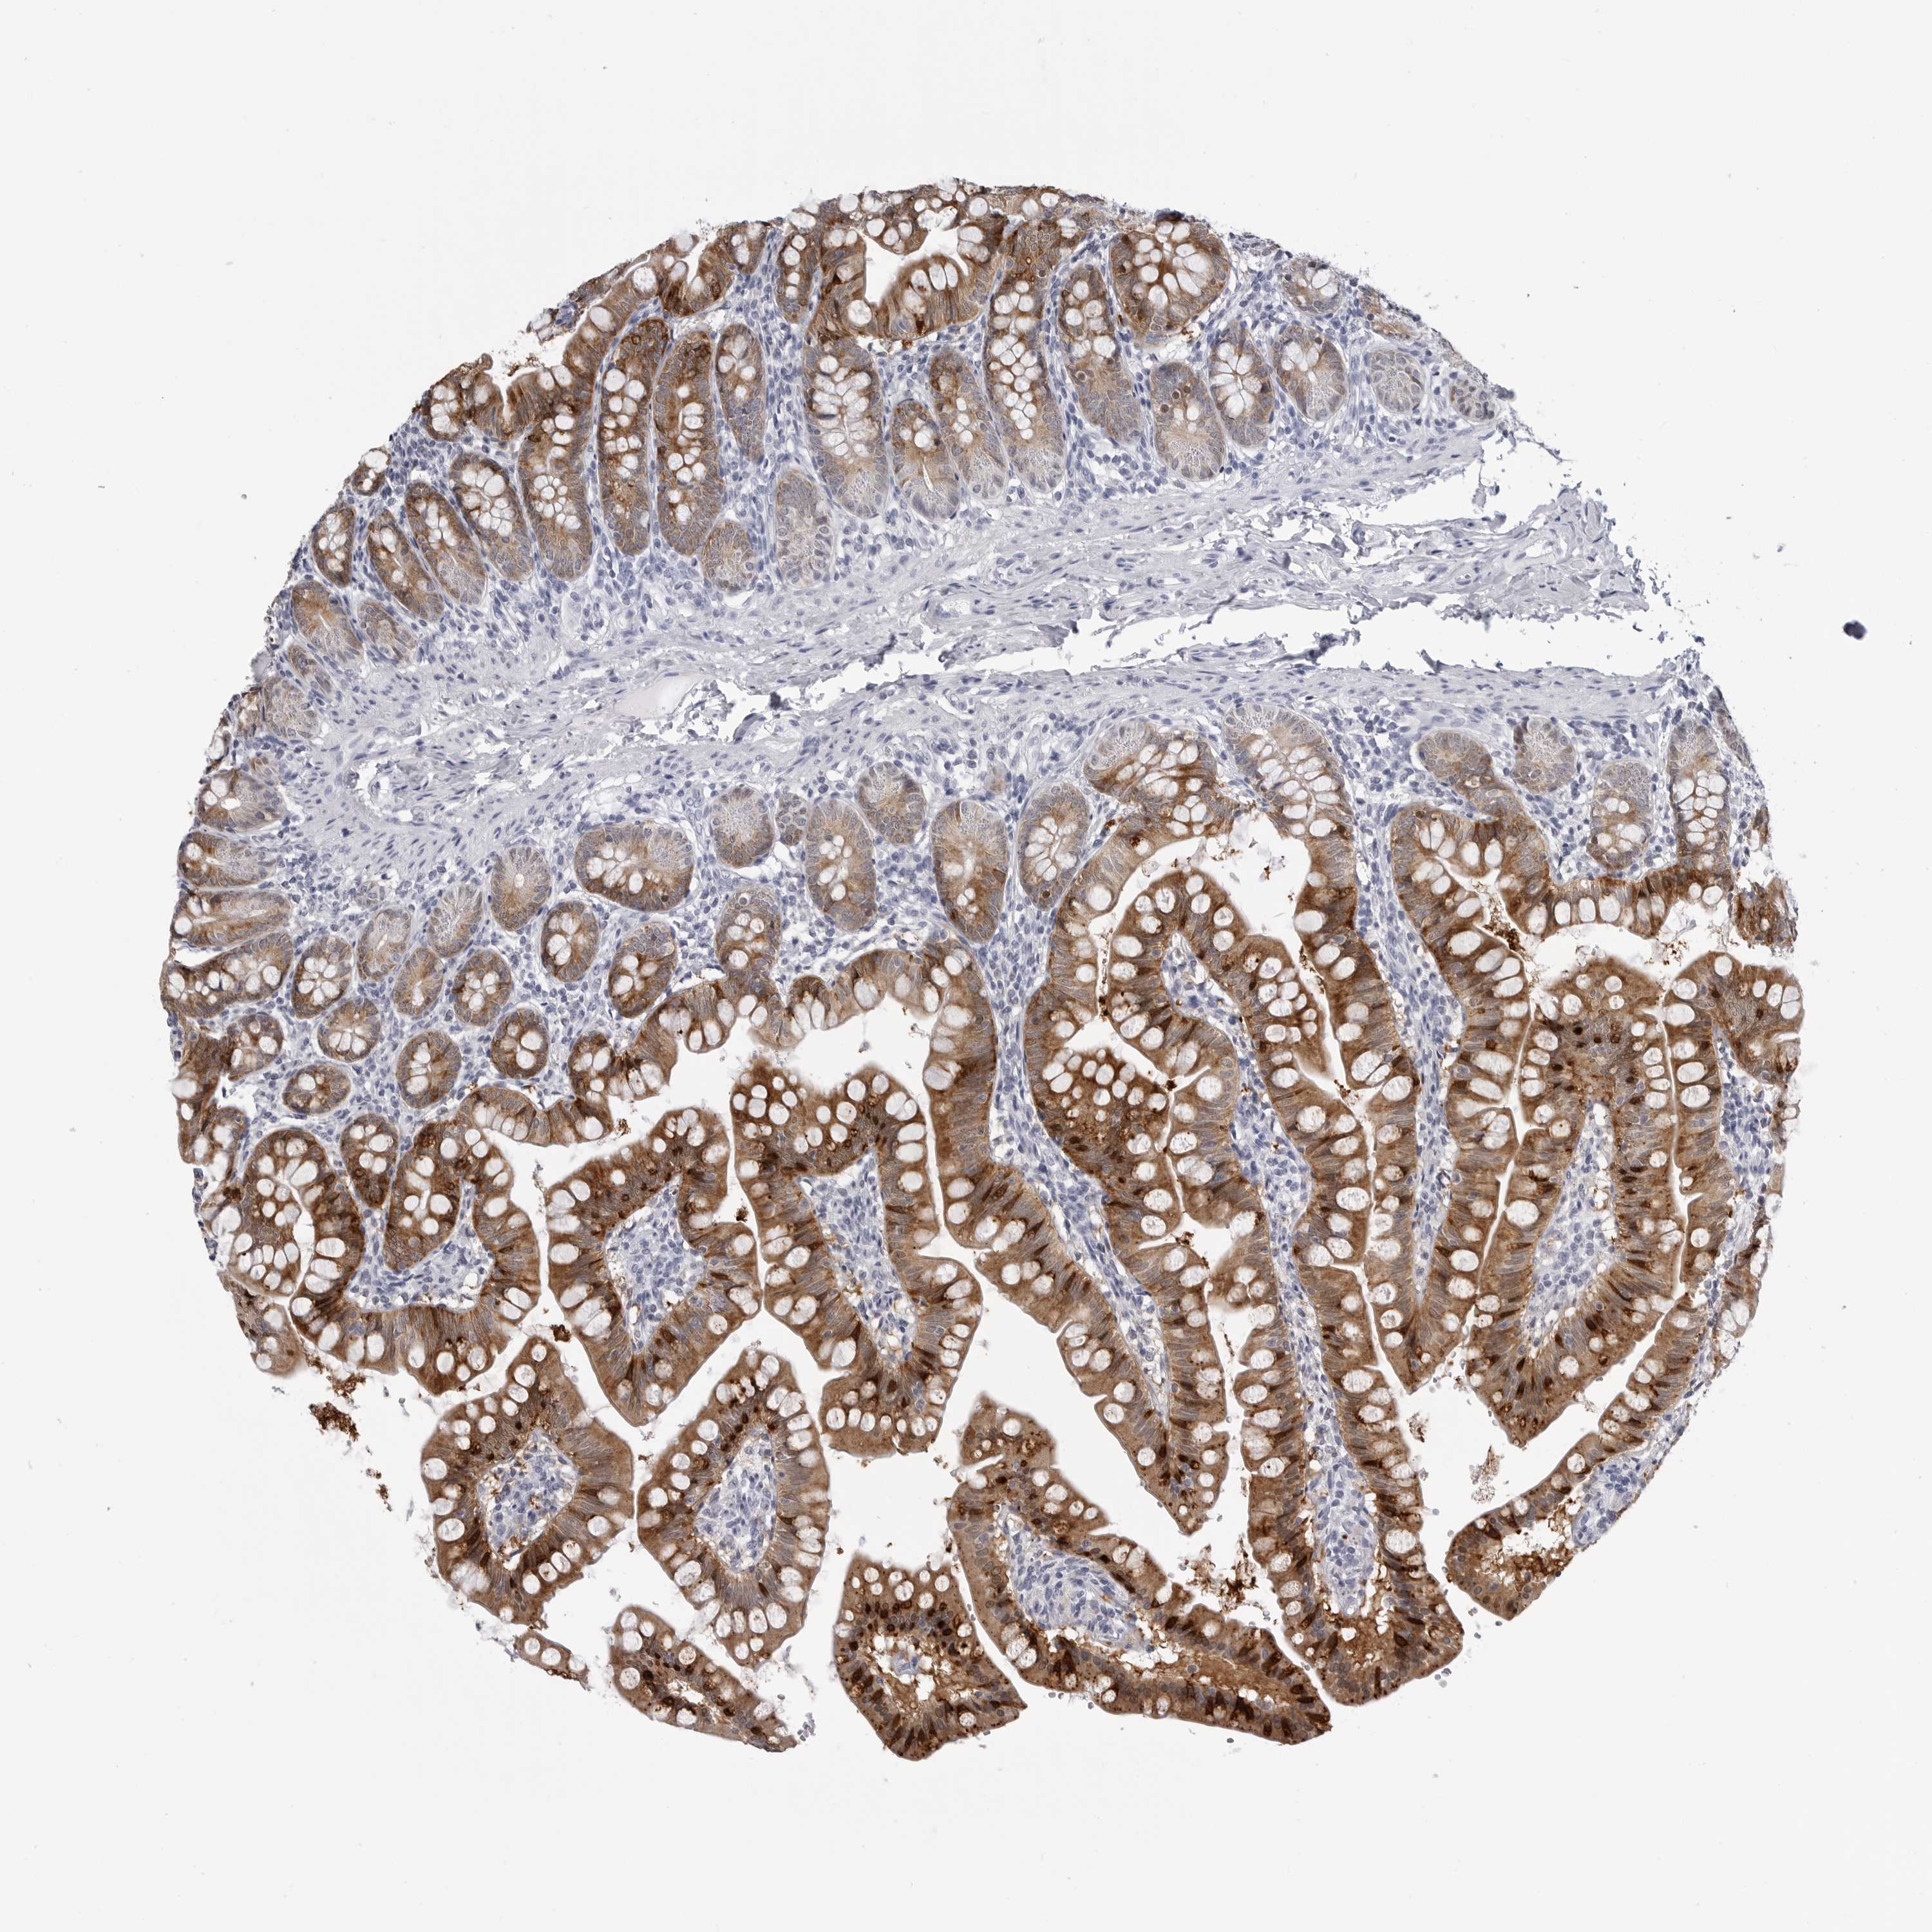
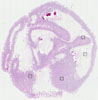
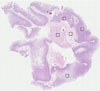
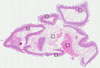
 Male, age 85


