We use cookies to enhance the usability of our website. If you continue, we'll assume that you are happy to receive all cookies. More information. Don't show this again.
The protein expression bar, with the units not detected (n), low (l), medium (m) and high (h), is based on a best estimate of the true protein expression for proteins where the antibody staining pattern has been analyzed by knowledge-based annotation. For genes where more than one antibody has been used, a collective score is set. For details, see Assays & annotation.
h
m
l
n
RNA expressioni
RNA expression shows average values based on RNA-seq data generated by HPA, the Genotype-Tissue Expression (GTEx) consortium or the FANTOM5 consortium.
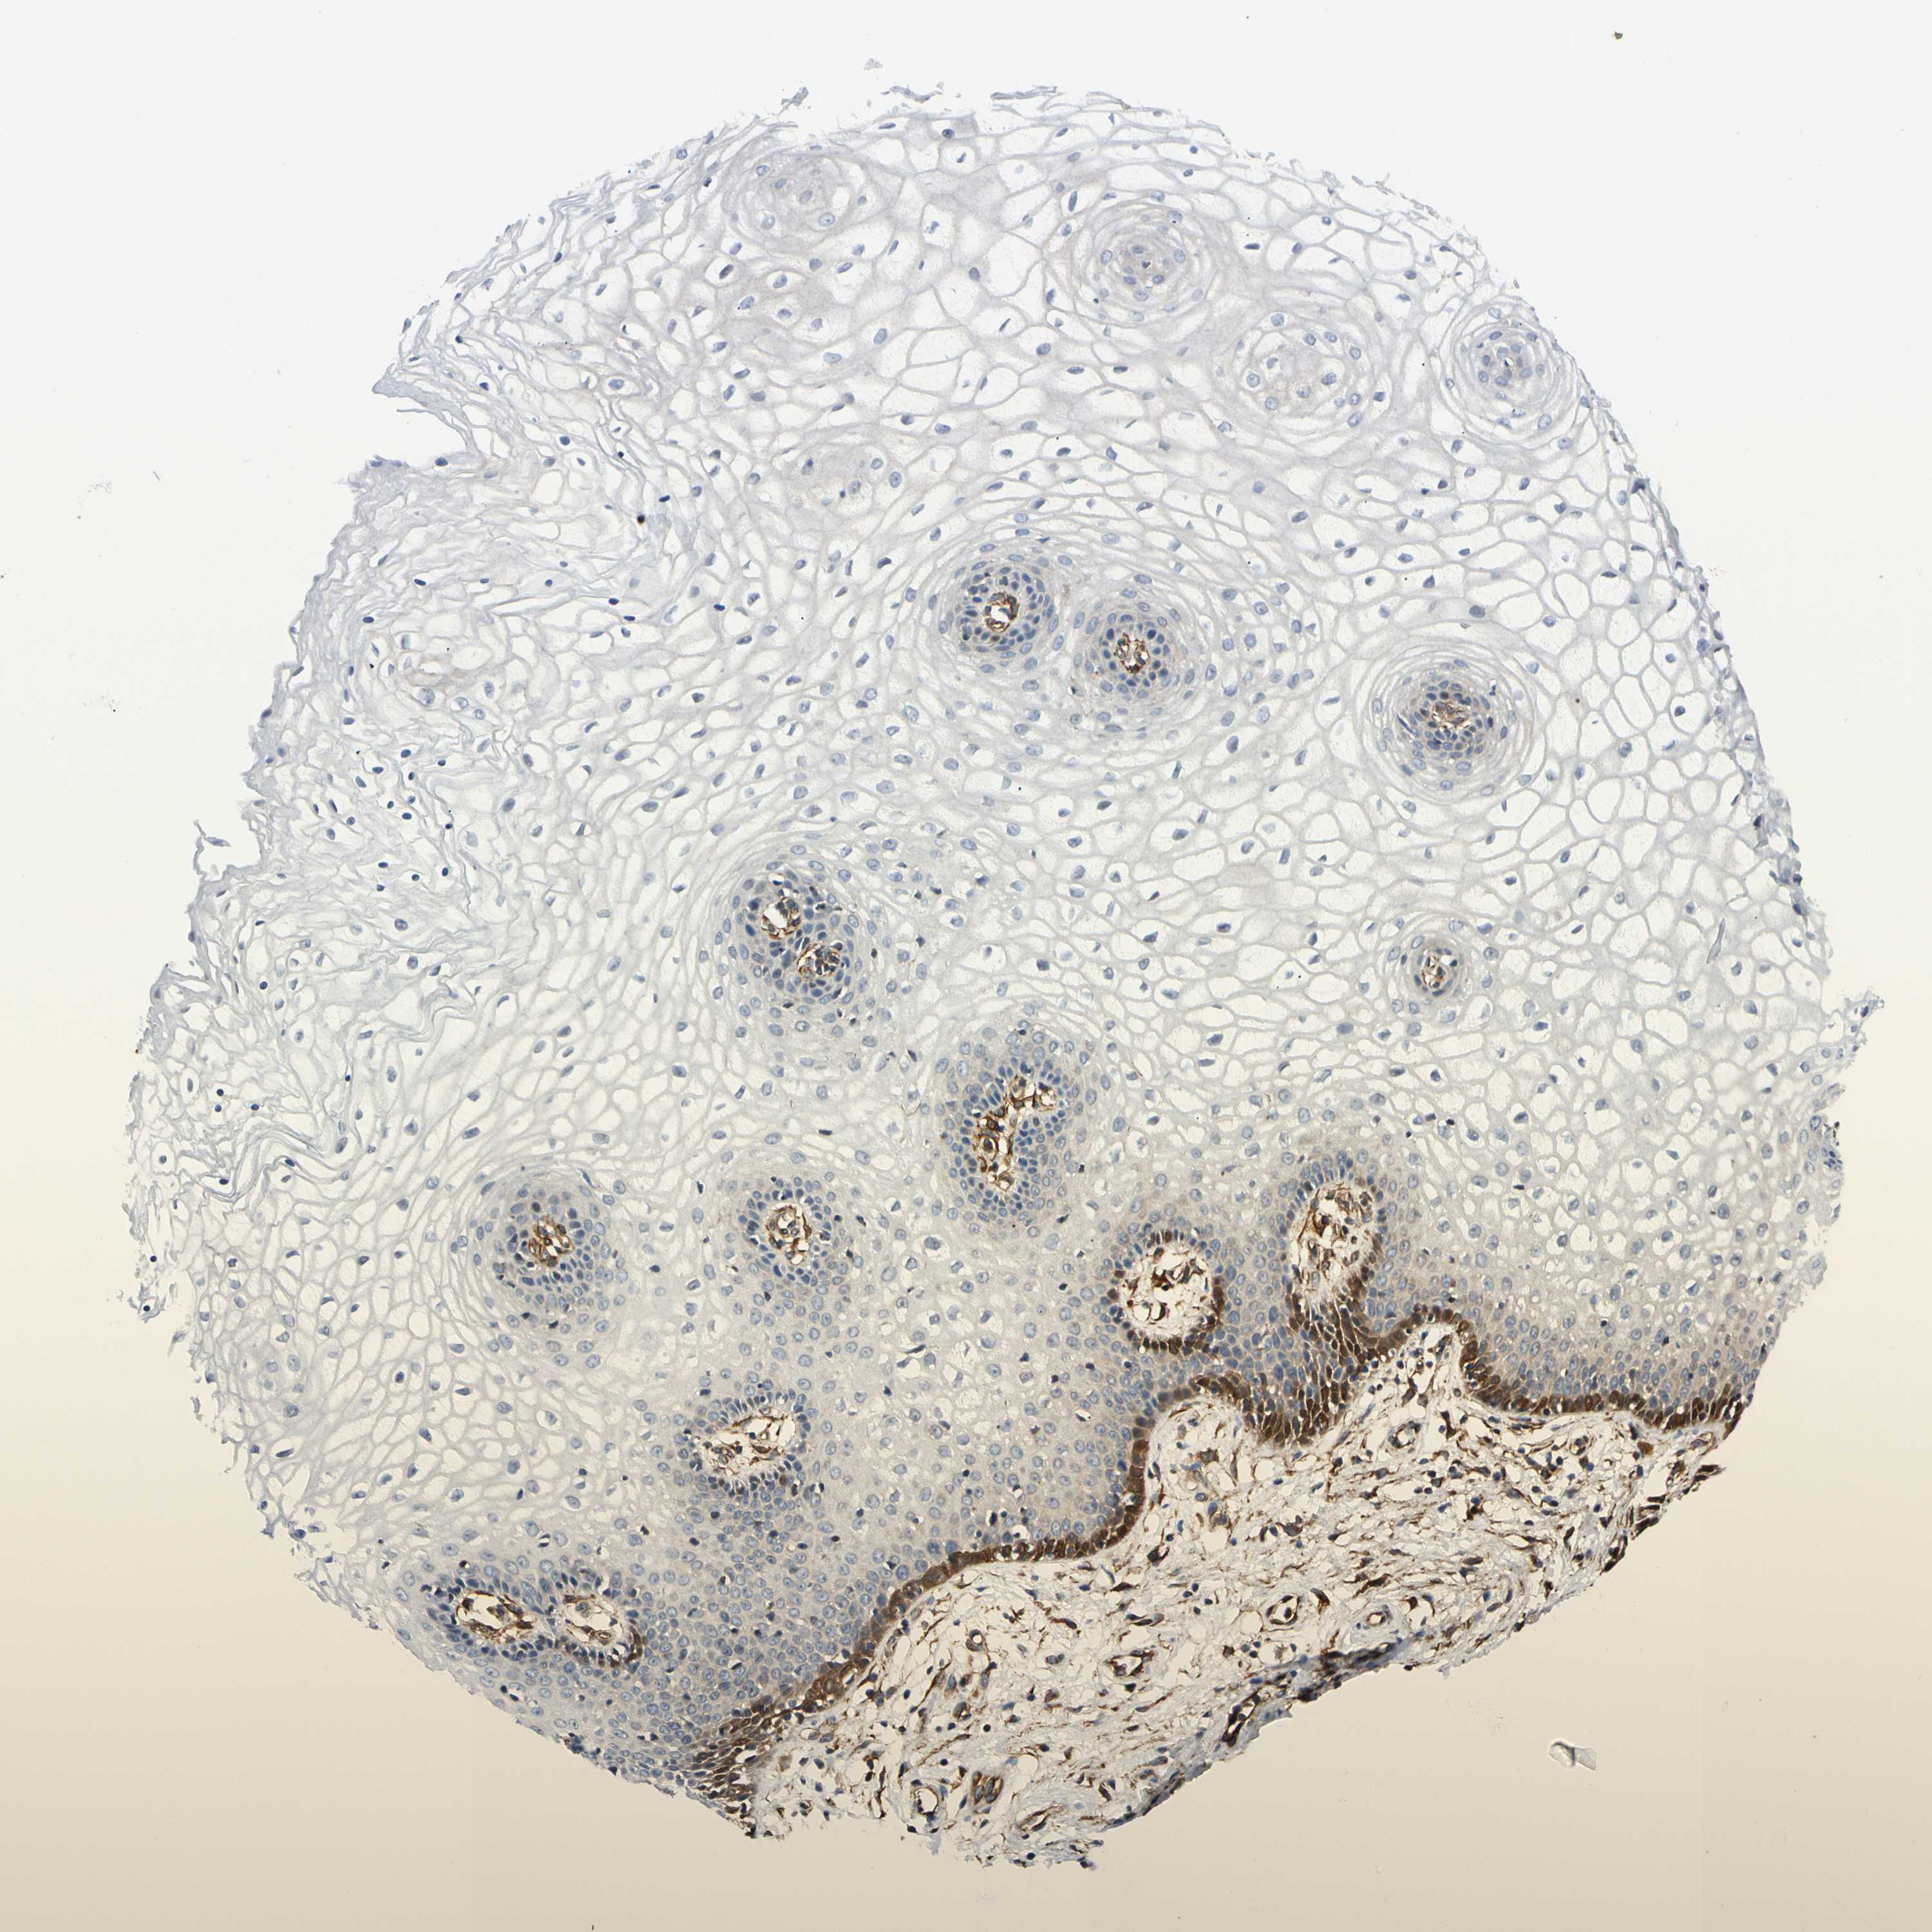
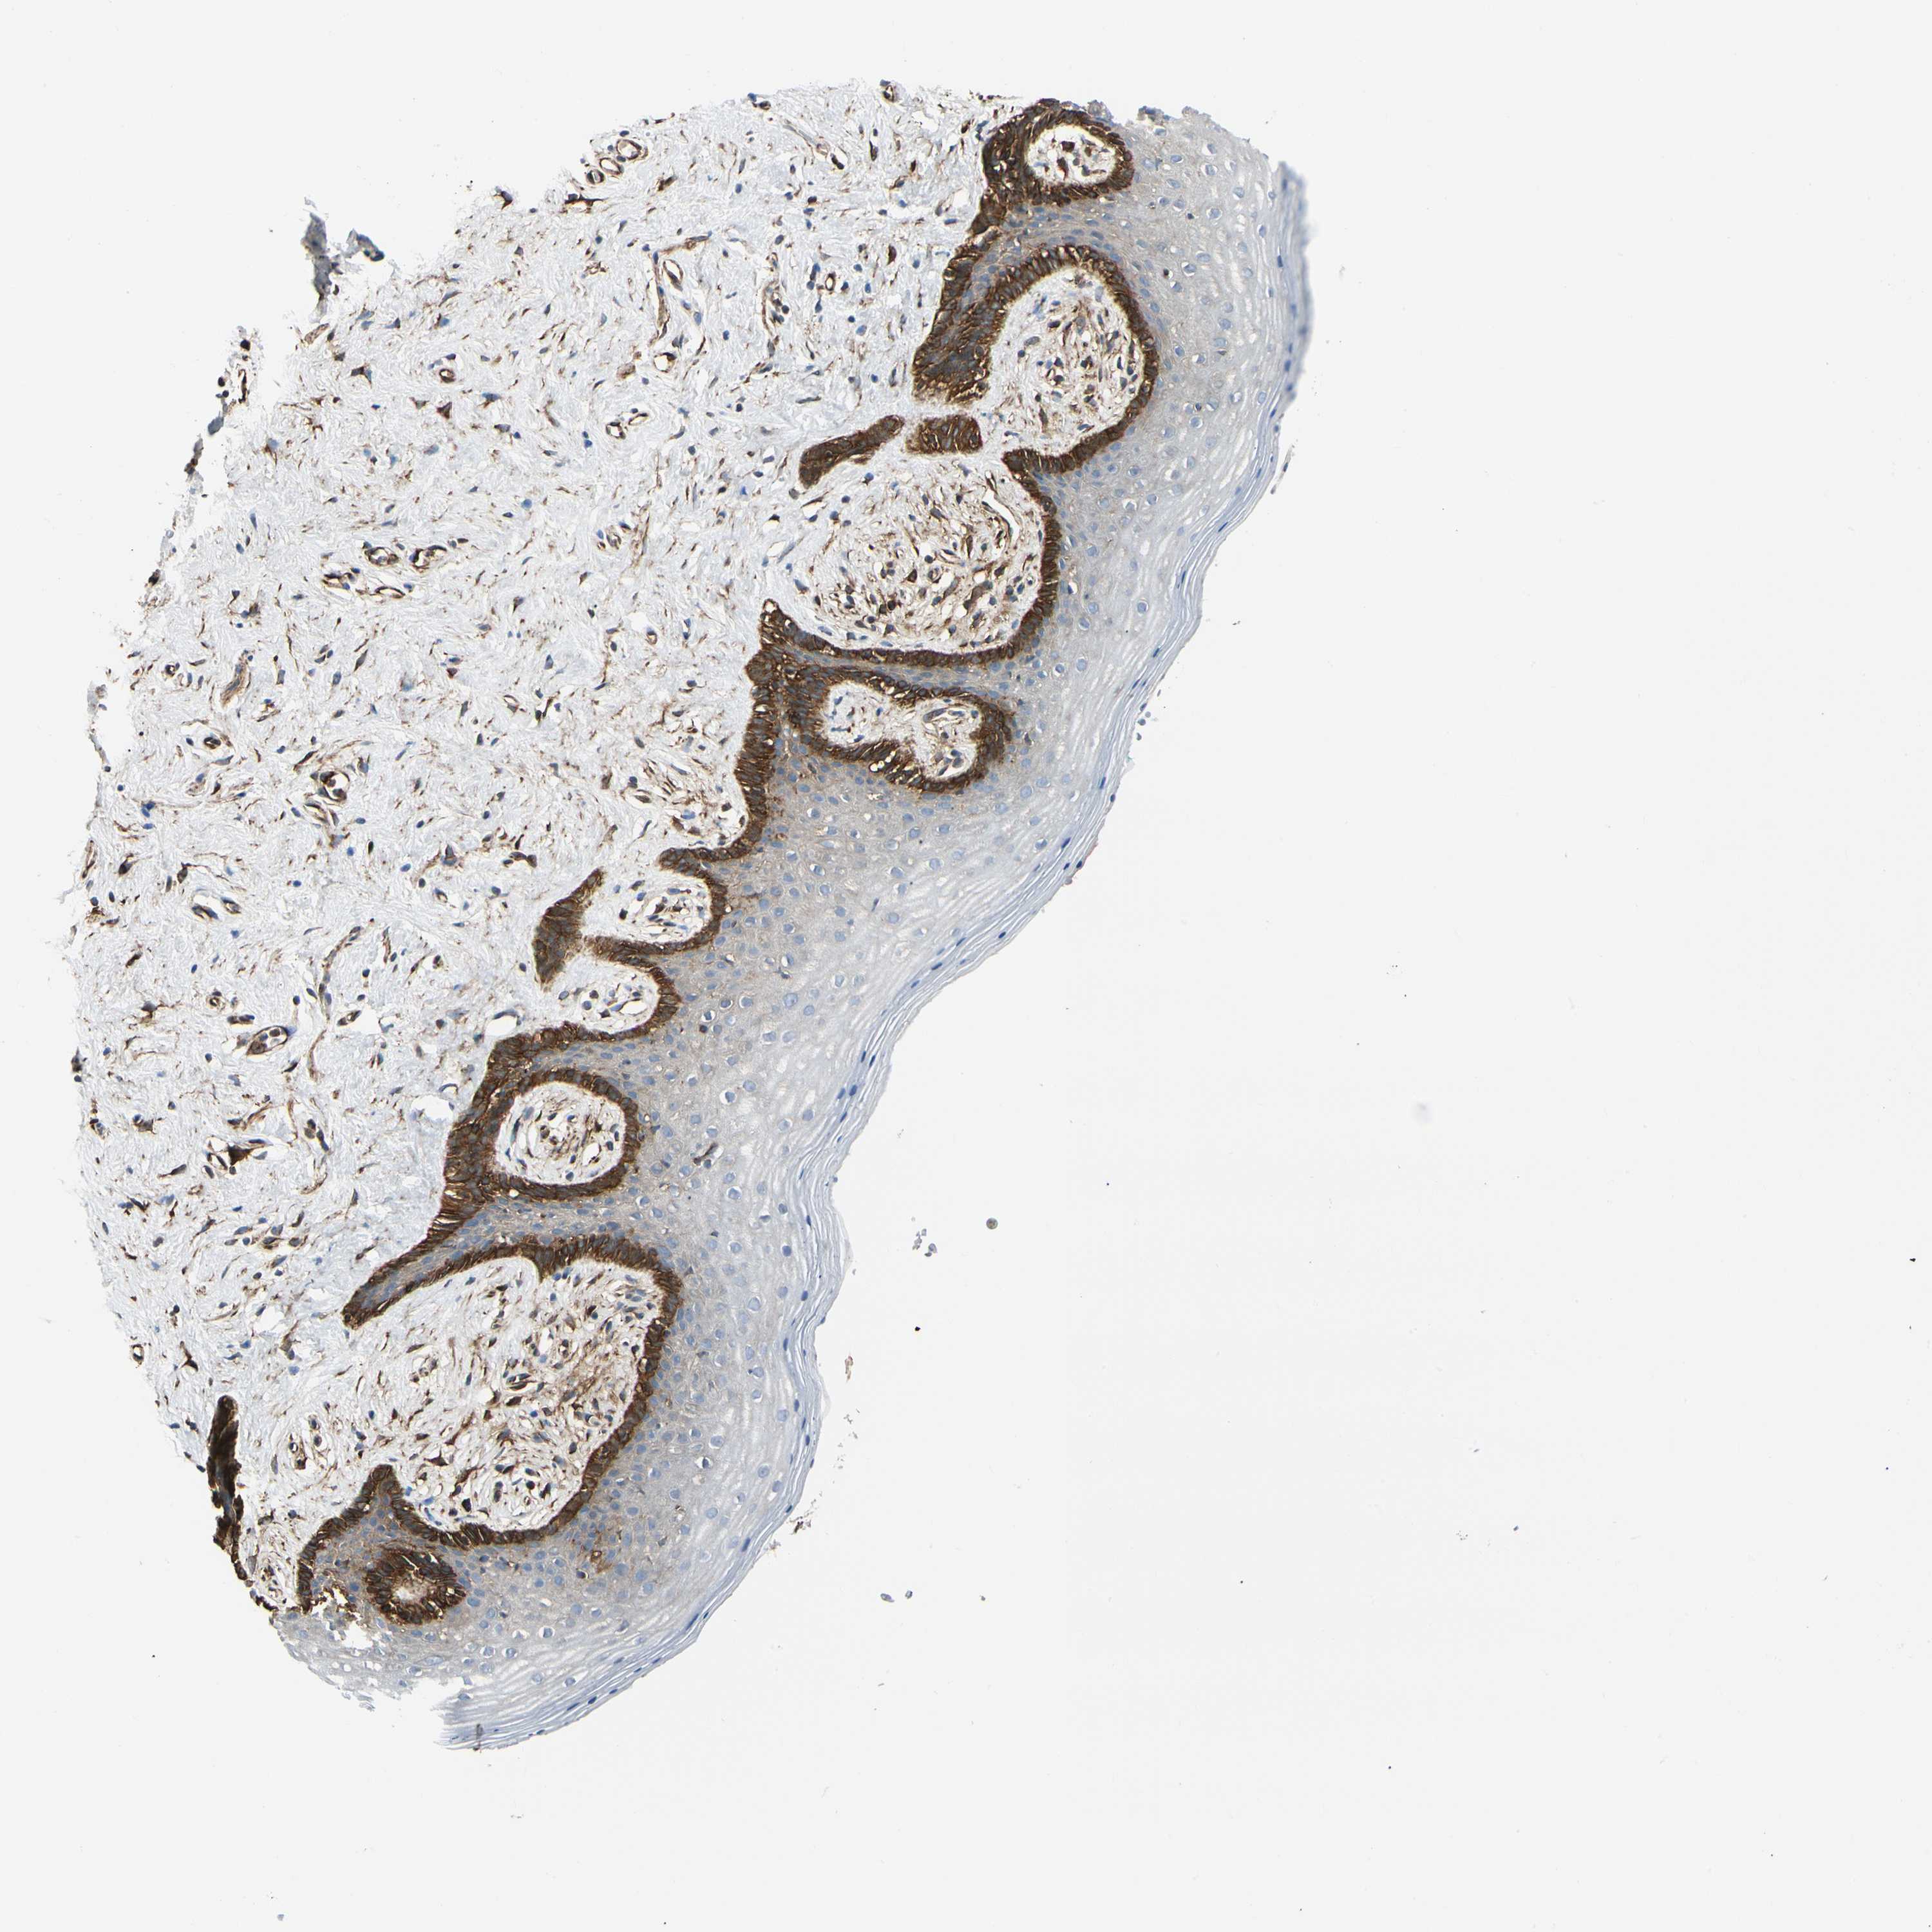
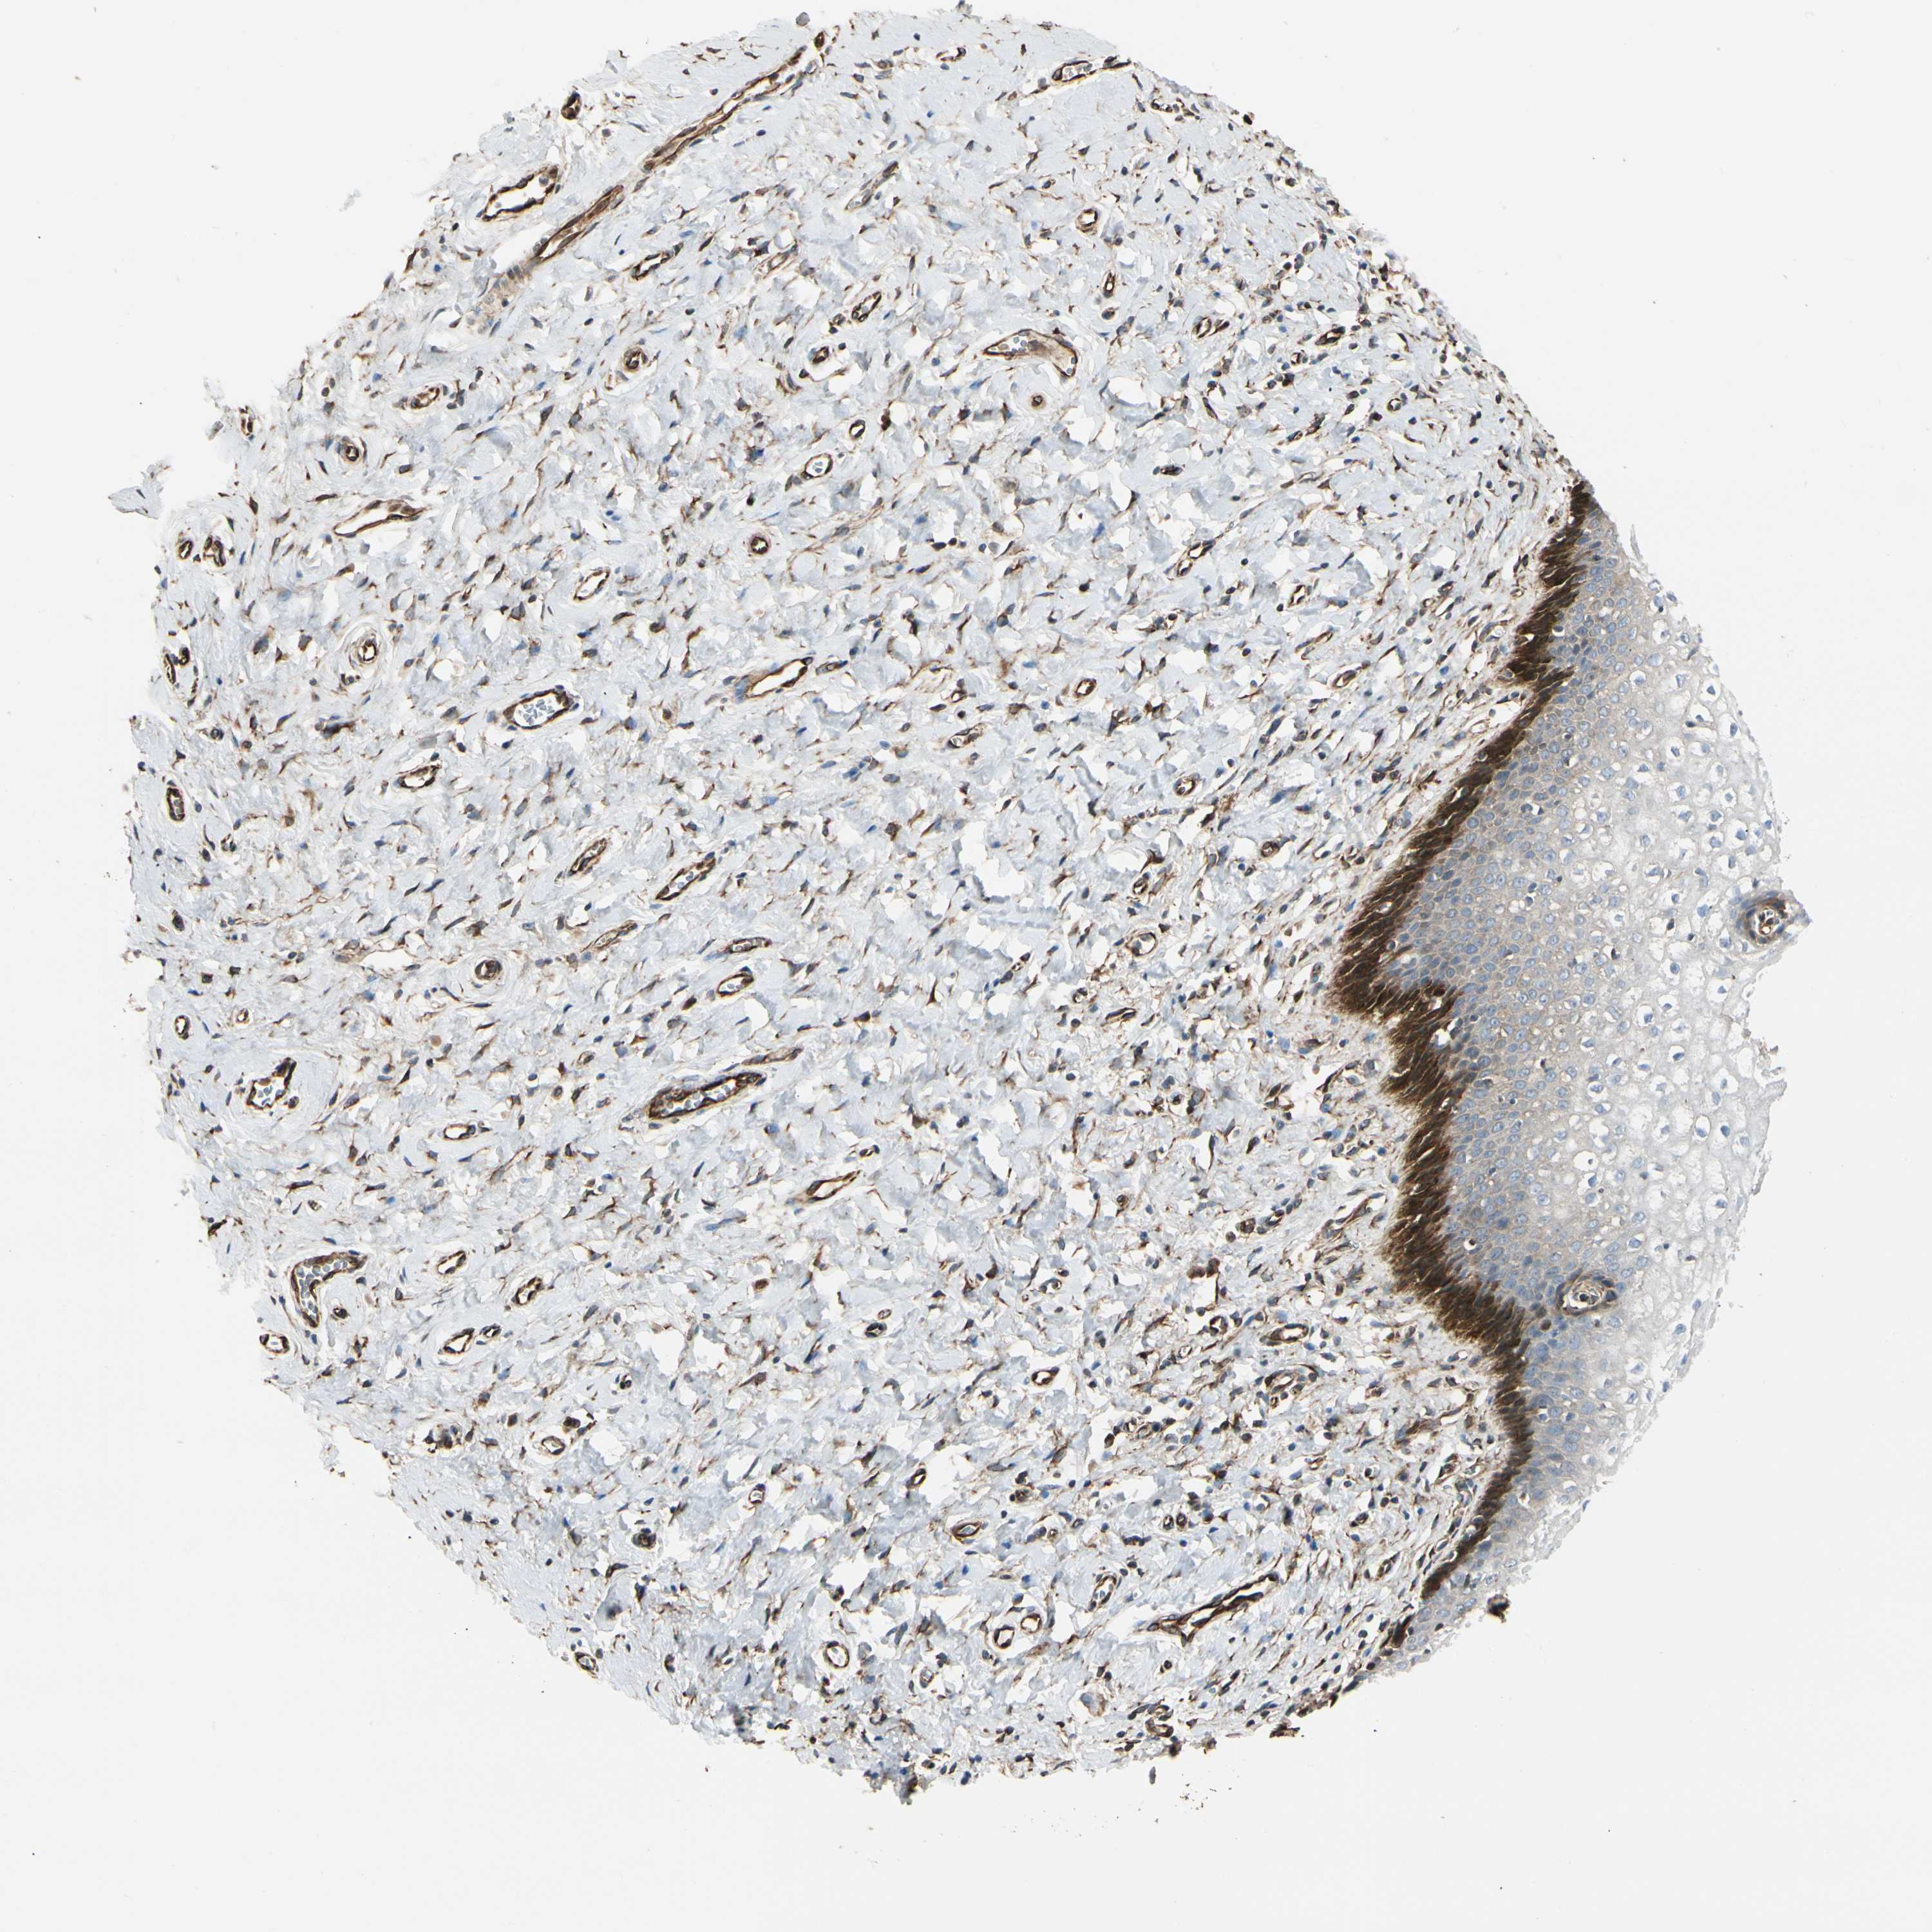
The detailed normal tissue page shows images of the stained tissue, together with antibody staining and expression level of the cell types. A knowledge-based annotated protein expression is provided for each cell type at the top of the page and the staining level of the individual antibodies is given underneath each antibody ID.
Samples from up to three different individuals have been stained for each antibody. The gender, age and tissue characterization are reported for each individual (patient) and are viewable when clicking on the image for magnification.
The images can be clicked for an enlarged view that can be panned. From the enlarged view, all stained images for all antibodies can be browsed (represented by miniature images). The miniature image with an orange overlay is the currently displayed image.
This score describes the level of antibody staining observed in the annotated cell types as not detected, low, medium, or high. It is based on the staining intensity and fraction of stained cells.
The RNA-seq details section shows detailed information about the individual samples used for the transcript profiling and results of the RNA-seq analysis.
Information about each individual sample is listed below, including gender, age, a tissue section image and estimated fractions of cell types. TPM (transcripts per million) values give a quantification of the gene abundance which is comparable between different genes and samples.
RNA-Seq data is reported as average RPKM (reads per kilobase per million mapped reads), generated by the Genotype-Tissue Expression (GTEx) project. More information can be found on the GTEx portal.
Normal distribution across the dataset is visualized with box plots, shown as median and 25th and 75th percentiles. Points are displayed as outliers if they are above or below 1.5 times the interquartile range. RPKM values of the individual samples are presented next to the box plot.
Max RPKM: 1376.9
Min RPKM: 132.5
Std RPKM: 258.1
Median RPKM: 483.7
GTEX-T6MO-1226-SM-4DM5S
40-49 years, female
1376.9
GTEX-14BMU-1926-SM-5S2QC
20-29 years, female
1316.2
GTEX-PWCY-1726-SM-48TD3
20-29 years, female
1141.2
GTEX-S341-1226-SM-4AD5S
40-49 years, female
1112.7
GTEX-13QBU-1726-SM-5IJFQ
40-49 years, female
1058.9
GTEX-132AR-1626-SM-5EGHP
50-59 years, female
1051.0
GTEX-13D11-1326-SM-5IJFY
50-59 years, female
1033.5
GTEX-Y114-1926-SM-4TT8J
50-59 years, female
998.7
GTEX-131XG-2126-SM-5DUXG
50-59 years, female
997.6
GTEX-U3ZN-0926-SM-4DXTU
30-39 years, female
992.6
GTEX-RU1J-1426-SM-46MUV
20-29 years, female
987.0
GTEX-W5WG-1026-SM-4LMIF
50-59 years, female
861.0
GTEX-11I78-2026-SM-5987C
50-59 years, female
850.3
GTEX-13PL7-2726-SM-5L3GB
60-69 years, female
789.3
GTEX-13W3W-2326-SM-5LU4Y
60-69 years, female
768.4
GTEX-147F3-1526-SM-5SIAK
50-59 years, female
765.5
GTEX-12WSJ-1326-SM-5GCOB
40-49 years, female
750.1
GTEX-11DXX-1726-SM-5H11T
60-69 years, female
733.9
GTEX-146FR-2426-SM-5NQAU
60-69 years, female
713.9
GTEX-PWOO-2026-SM-48TDE
40-49 years, female
706.4
GTEX-RWS6-1726-SM-47JXP
60-69 years, female
683.6
GTEX-Q734-1426-SM-48TZQ
40-49 years, female
664.8
GTEX-UJHI-1326-SM-4IHJO
50-59 years, female
661.0
GTEX-ZQG8-1126-SM-51MRL
60-69 years, female
649.9
GTEX-11GSP-2226-SM-5HL5Q
60-69 years, female
637.8
GTEX-13PVR-1426-SM-5S2PW
60-69 years, female
635.5
GTEX-TSE9-2526-SM-4DXUS
60-69 years, female
627.1
GTEX-12ZZX-1926-SM-5EGKC
40-49 years, female
623.7
GTEX-ZTPG-2226-SM-57WF9
20-29 years, female
613.3
GTEX-PLZ4-2726-SM-3P61A
50-59 years, female
596.6
GTEX-11EM3-1826-SM-5A5KO
20-29 years, female
590.9
GTEX-X8HC-2826-SM-46MWJ
50-59 years, female
585.6
GTEX-QVJO-2526-SM-4R1KB
60-69 years, female
568.7
GTEX-12WSD-2926-SM-5LZUH
60-69 years, female
567.1
GTEX-ZP4G-0826-SM-4WWF3
20-29 years, female
553.6
GTEX-WEY5-0826-SM-4LMIH
40-49 years, female
552.4
GTEX-TMMY-1926-SM-4DXUU
40-49 years, female
540.7
GTEX-PX3G-2526-SM-48TZV
20-29 years, female
539.0
GTEX-13OVI-0926-SM-5J1MI
60-69 years, female
529.6
GTEX-ZYY3-2626-SM-5N9DH
60-69 years, female
525.8
GTEX-ZVT3-2726-SM-5GU5X
60-69 years, female
519.6
GTEX-OHPK-2526-SM-3MJH9
50-59 years, female
510.0
GTEX-11XUK-1326-SM-5EQM4
40-49 years, female
499.1
GTEX-ZAJG-2926-SM-5HL8P
50-59 years, female
496.7
GTEX-146FH-2626-SM-5Q5E1
50-59 years, female
490.4
GTEX-ZLWG-1126-SM-4WWFQ
50-59 years, female
489.8
GTEX-ZYVF-0326-SM-5GIES
50-59 years, female
489.2
GTEX-XV7Q-1626-SM-4BRWC
40-49 years, female
487.9
GTEX-XUW1-0326-SM-4BOOR
50-59 years, female
479.5
GTEX-P78B-2226-SM-3P5ZZ
40-49 years, female
463.1
GTEX-Y8LW-1426-SM-5RQJJ
50-59 years, female
462.3
GTEX-ZYWO-2026-SM-5GIDA
40-49 years, female
460.0
GTEX-S4UY-1326-SM-4AD4X
40-49 years, female
450.3
GTEX-TML8-1126-SM-4DXSS
40-49 years, female
450.1
GTEX-N7MT-1926-SM-3LK5N
60-69 years, female
449.4
GTEX-PWN1-2526-SM-48TDS
40-49 years, female
436.3
GTEX-SE5C-1126-SM-4BRWZ
40-49 years, female
430.5
GTEX-S7SF-1426-SM-4AT5A
20-29 years, female
424.9
GTEX-ZV6S-1326-SM-59HJA
40-49 years, female
424.1
GTEX-X15G-1926-SM-4PQZQ
50-59 years, female
422.9
GTEX-ZGAY-2226-SM-4YCCX
40-49 years, female
411.0
GTEX-S4P3-1126-SM-4AD52
50-59 years, female
401.7
GTEX-P4PP-2526-SM-3P61P
30-39 years, female
401.3
GTEX-13N11-1526-SM-5L3FL
50-59 years, female
399.8
GTEX-11VI4-0726-SM-5GU5B
40-49 years, female
398.6
GTEX-WRHU-2926-SM-4MVNQ
50-59 years, female
393.3
GTEX-13U4I-2026-SM-5LU3L
40-49 years, female
391.2
GTEX-14A5I-2726-SM-5SIB3
50-59 years, female
386.7
GTEX-QDT8-2526-SM-48TYX
30-39 years, female
381.7
GTEX-ZZPU-2226-SM-5EGIV
50-59 years, female
379.7
GTEX-13QIC-1826-SM-5J1MY
60-69 years, female
378.8
GTEX-14DAQ-2326-SM-5S2QX
60-69 years, female
375.4
GTEX-1399S-2326-SM-5K7YV
30-39 years, female
375.2
GTEX-OHPL-2526-SM-3MJGT
60-69 years, female
365.3
GTEX-1399U-1526-SM-5J2N7
50-59 years, female
361.6
GTEX-11P81-2126-SM-5HL6N
30-39 years, female
357.0
GTEX-11TTK-2726-SM-5GU58
60-69 years, female
343.9
GTEX-YFC4-2926-SM-5IFJ8
40-49 years, female
334.4
GTEX-T2IS-1926-SM-4DM74
20-29 years, female
318.5
GTEX-XUJ4-1626-SM-4BONV
60-69 years, female
316.4
GTEX-ZE7O-2426-SM-57WD7
50-59 years, female
314.2
GTEX-QCQG-1226-SM-48U23
50-59 years, female
310.9
GTEX-113JC-1926-SM-5N9GE
50-59 years, female
310.5
GTEX-YJ8O-1226-SM-5P9JE
40-49 years, female
293.3
GTEX-NL3G-2526-SM-4SOIE
60-69 years, female
281.1
GTEX-ZXES-0626-SM-5E45P
30-39 years, female
277.6
GTEX-131YS-2426-SM-5J2OD
60-69 years, female
263.0
GTEX-1117F-2526-SM-5GZY6
60-69 years, female
261.9
GTEX-ZVT2-0626-SM-5GICR
50-59 years, female
242.6
GTEX-12WSB-2426-SM-5EGJC
60-69 years, female
225.2
GTEX-14AS3-1726-SM-5RQJV
40-49 years, female
213.4
GTEX-145ME-1426-SM-5RQJS
40-49 years, female
203.0
GTEX-ZC5H-2226-SM-4WAWS
40-49 years, female
192.3
GTEX-UPIC-1426-SM-4IHLQ
20-29 years, female
165.9
GTEX-Y3IK-2226-SM-4YCD4
50-59 years, female
141.2
GTEX-11EMC-1926-SM-5A5JU
60-69 years, female
132.5
Show all
VAGINA - FANTOM5 CAGEi
Tissue data obtained through Cap Analysis of Gene Expression (CAGE) are reported as Tags Per Million, generated by the FANTOM5 project. More information can be found here.
 The Human Protein Atlas project is funded


 MENU
MENU