We use cookies to enhance the usability of our website. If you continue, we'll assume that you are happy to receive all cookies. More information. Don't show this again.
RNA category is based on mRNA expression levels in the analyzed samples (RNA assay description). The categories include: tissue/cell line enriched, group enriched, tissue/cell line enhanced, expressed in all, mixed and not detected. RNA category is calculated separately for The Cancer Genome Atlas (TCGA) data from cancer tissues and internally generated Human Protein Atlas (HPA) data from normal tissues and cell lines.
TCGA (cancer tissue):
Mixed
HPA (cell line):
Cell line enriched (AF22)
HPA (normal tissue):
Tissue enhanced (smooth muscle)
Protein evidencei
Protein evidence scores are generated from several independent sources and are classified as evidence at i) protein level, ii) transcript level, iii) no evidence, or iv) not available.
Evidence at protein level
IMMUNOHISTOCHEMISTRY DATA RELIABILITY
Reliability score - normal tissuesi
Reliability score (score description), divided into Enhanced, Supported, Approved, or Uncertain, is evaluated in normal tissues and based on consistency between antibody staining pattern, available RNA-Seq and gene/protein characterization data, as well as similarity between independent antibodies targeting the same protein.
Kaplan-Meier plots for all cancers where high expression of this gene has significant (p<0.001) association with patient survival are shown in this summary. Whether the prognosis is favourable or unfavourable is indicated in brackets. Each Kaplan-Meier plot is clickable and redirects to a detailed page that includes individual expression and survival data for patients with the selected cancer.
Gene product is not prognostic.
Show all
RNA EXPRESSION OVERVIEWi
RNA expression overview shows RNA-seq data from The Cancer Genome Atlas (TCGA).
TCGA dataseti
RNA-seq data in 17 cancer types are reported as median FPKM (number Fragments Per Kilobase of exon per Million reads), generated by the The Cancer Genome Atlas (TCGA). RNA cancer tissue category is calculated based on mRNA expression levels across all 17 cancer tissues and include: cancer tissue enriched, cancer group enriched, cancer tissue enhanced, expressed in all, mixed and not detected. To access cancer specific RNA and prognostic data, click on the cancer name. The cancer types are color-coded according to which type of normal organ the cancer originates from.
Antibody staining in 20 different cancers is summarized by a selection of four standard cancer tissue samples representative of the overall staining pattern. From left: colorectal cancer, breast cancer, prostate cancer and lung cancer. An additional fifth image can be added as a complement. The assay and annotation is described here. Note that samples used for immunohistochemistry by the Human Protein Atlas do not correspond to samples in the TCGA dataset.
Gene information from Ensembl and Entrez, as well as links to available gene identifiers are displayed here. Information was retrieved from Ensembl if not indicated otherwise.
Gene name
ROBO3 (HGNC Symbol)
Synonyms
FLJ21044, HGPPS, HGPS, RBIG1
Description
Roundabout guidance receptor 3 (HGNC Symbol)
Entrez gene summary
This gene is a member of the Roundabout (ROBO) gene family that controls neurite outgrowth, growth cone guidance, and axon fasciculation. ROBO proteins are a subfamily of the immunoglobulin transmembrane receptor superfamily. SLIT proteins 1-3, a family of secreted chemorepellants, are ligands for ROBO proteins and SLIT/ROBO interactions regulate myogenesis, leukocyte migration, kidney morphogenesis, angiogenesis, and vasculogenesis in addition to neurogenesis. This gene, ROBO3, has a putative extracellular domain with five immunoglobulin (Ig)-like loops and three fibronectin (Fn) type III motifs, a transmembrane segment, and a cytoplasmic tail with three conserved signaling motifs: CC0, CC2, and CC3 (CC for conserved cytoplasmic). Unlike other ROBO family members, ROBO3 lacks motif CC1. The ROBO3 gene regulates axonal navigation at the ventral midline of the neural tube. In mouse, loss of Robo3 results in a complete failure of commissural axons to cross the midline throughout the spinal cord and the hindbrain. Mutations ROBO3 result in horizontal gaze palsy with progressive scoliosis (HGPPS); an autosomal recessive disorder characterized by congenital absence of horizontal gaze, progressive scoliosis, and failure of the corticospinal and somatosensory axon tracts to cross the midline in the medulla. Alternative transcript variants have been described but have not been experimentally validated. [provided by RefSeq, Dec 2009]
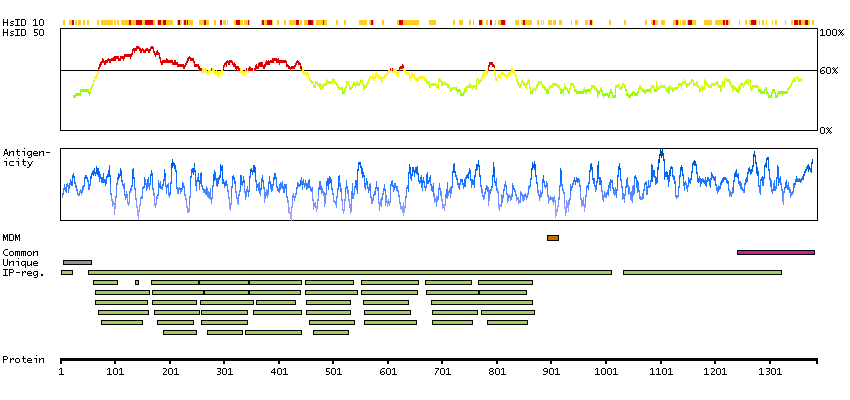
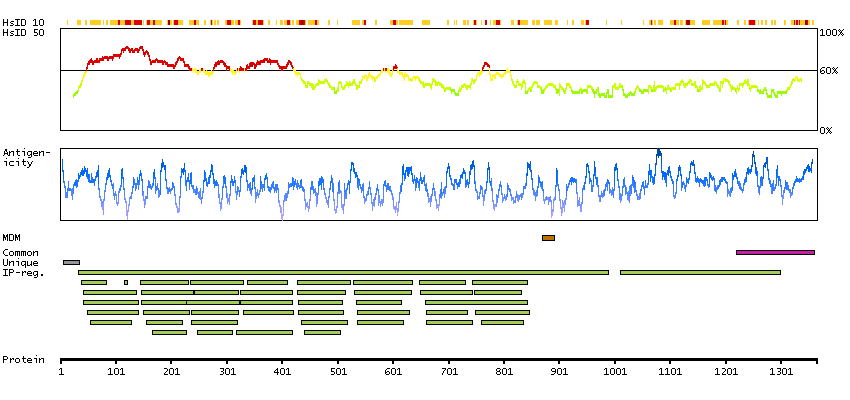
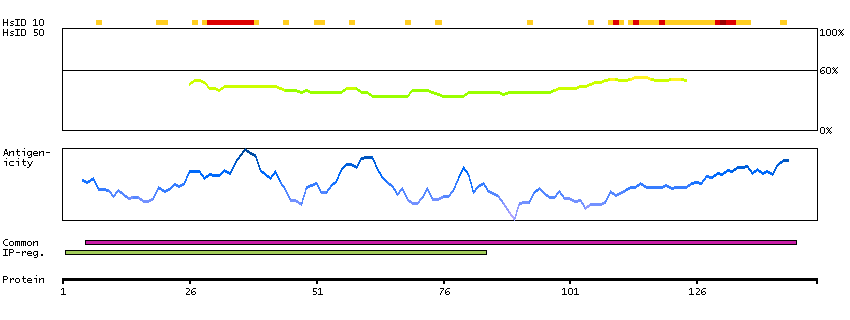
The protein browser displays the antigen location on the target protein(s) and the features of the target protein. The tabs at the top of the protein view section can be used to switch between the different splice variants to which an antigen has been mapped.
At the top of the view, the position of the antigen (identified by the corresponding HPA identifier) is shown as a green bar. A yellow triangle on the bar indicates a <100% sequence identity to the protein target.
Under the antigens, the maximum percent sequence identity of the protein to all other proteins from other human genes is displayed, using a sliding window of 10 aa residues (HsID 10) or 50 aa residues (HsID 50). The region with the lowest possible identity is always selected for antigen design, with a maximum identity of 60% allowed for designing a single-target antigen (read more).
The curve in blue displays the predicted antigenicity i.e. the tendency for different regions of the protein to generate an immune response, with peak regions being predicted to be more antigenic.The curve shows average values based on a sliding window approach using an in-house propensity scale. (read more).
If a signal peptide is predicted by a majority of the signal peptide predictors SPOCTOPUS, SignalP 4.0, and Phobius (turquoise) and/or transmembrane regions (orange) are predicted by MDM, these are displayed.
Low complexity regions are shown in yellow and InterPro regions in green. Common (purple) and unique (grey) regions between different splice variants of the gene are also displayed (read more), and at the bottom of the protein view is the protein scale.
ROBO3-001
ROBO3-021
ROBO3-201
PROTEIN INFORMATIONi
The protein information section displays alternative protein-coding transcripts (splice variants) encoded by this gene according to the Ensembl database.
The ENSP identifier links to the Ensembl website protein summary, while the ENST identifier links to the Ensembl website transcript summary for the selected splice variant. The data in the UniProt column can be expanded to show links to all matching UniProt identifiers for this protein.
The protein classes assigned to this protein are shown if expanding the data in the protein class column. Parent protein classes are in bold font and subclasses are listed under the parent class.
The Gene Ontology terms assigned to this protein are listed if expanding the Gene ontology column. The length of the protein (amino acid residues according to Ensembl), molecular mass (kDalton), predicted signal peptide (according to a majority of the signal peptide predictors SPOCTOPUS, SignalP 4.0, and Phobius) and the number of predicted transmembrane region(s) (according to MDM) are also reported.
 The Human Protein Atlas project is funded


 MENU
MENU