We use cookies to enhance the usability of our website. If you continue, we'll assume that you are happy to receive all cookies. More information. Don't show this again.
The protein expression bar, with the units not detected (n), low (l), medium (m) and high (h), is based on a best estimate of the true protein expression for proteins where the antibody staining pattern has been analyzed by knowledge-based annotation. For genes where more than one antibody has been used, a collective score is set. For details, see Assays & annotation.
h
m
l
n
RNA expressioni
RNA expression shows average values based on RNA-seq data generated by HPA, the Genotype-Tissue Expression (GTEx) consortium or the FANTOM5 consortium.
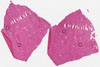
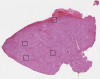
The detailed normal tissue page shows images of the stained tissue, together with antibody staining and expression level of the cell types. A knowledge-based annotated protein expression is provided for each cell type at the top of the page and the staining level of the individual antibodies is given underneath each antibody ID.
Samples from up to three different individuals have been stained for each antibody. The gender, age and tissue characterization are reported for each individual (patient) and are viewable when clicking on the image for magnification.
The images can be clicked for an enlarged view that can be panned. From the enlarged view, all stained images for all antibodies can be browsed (represented by miniature images). The miniature image with an orange overlay is the currently displayed image.
This score describes the level of antibody staining observed in the annotated cell types as not detected, low, medium, or high. It is based on the staining intensity and fraction of stained cells.
The RNA-seq details section shows detailed information about the individual samples used for the transcript profiling and results of the RNA-seq analysis.
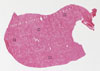
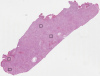
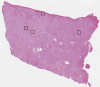
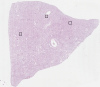
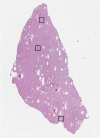
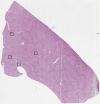
Information about each individual sample is listed below, including gender, age, a tissue section image and estimated fractions of cell types. TPM (transcripts per million) values give a quantification of the gene abundance which is comparable between different genes and samples.
Hepatocytes: 80 Fibroblasts: 15 Other cell types: 5
Male, age 74
Sample 3 TPM: 1233
Cell types%
Hepatocytes: 85 Fibroblasts: 5 Other cell types: 10
Female, age 62
Sample 4 TPM: 1097.4
Cell types%
Hepatocytes: 70 Fibroblasts: 10 Other cell types: 20
Male, age 78
Sample 5 TPM: 682.3
Cell types%
Hepatocytes: 75 Fibroblasts: 5 Other cell types: 20
Male, age 53
Sample 6 TPM: 1433.6
Cell types%
Hepatocytes: 80 Fibroblasts: 5 Other cell types: 15
Male, age 77
Sample 7 TPM: 1522.3
Cell types%
Hepatocytes: 75 Fibroblasts: 5 Other cell types: 20
Female, age 72
Sample 8 TPM: 1298
Cell types%
Hepatocytes: 50 Fibroblasts: 10 Other cell types: 40
Male, age 70
Sample 9 TPM: 1287.9
Cell types%
Hepatocytes: 65 Fibroblasts: 10 Other cell types: 25
Female, age 23
Sample 10 TPM: 1636.3
Cell types%
Hepatocytes: 70 Fibroblasts: 5 Other cell types: 25
LIVER - GTEx RNA-seqi
RNA-Seq data is reported as average RPKM (reads per kilobase per million mapped reads), generated by the Genotype-Tissue Expression (GTEx) project. More information can be found on the GTEx portal.
Normal distribution across the dataset is visualized with box plots, shown as median and 25th and 75th percentiles. Points are displayed as outliers if they are above or below 1.5 times the interquartile range. RPKM values of the individual samples are presented next to the box plot.
Max RPKM: 1357.7
Min RPKM: 66.7
Std RPKM: 264.4
Median RPKM: 591.6
GTEX-ZF2S-3026-SM-4WWCH
50-59 years, female
1357.7
GTEX-QDVN-0826-SM-48TZ2
50-59 years, male
1162.8
GTEX-11DXZ-0126-SM-5EGGY
50-59 years, male
1134.8
GTEX-ZTPG-1426-SM-51MT3
20-29 years, female
1111.4
GTEX-1399R-1226-SM-5P9GF
30-39 years, male
1094.5
GTEX-Q734-0326-SM-48U15
40-49 years, female
1071.0
GTEX-13N11-0926-SM-5IJG2
50-59 years, female
1056.8
GTEX-WYVS-1926-SM-4PQZ2
40-49 years, female
1032.1
GTEX-R53T-0326-SM-48FEC
50-59 years, female
1028.9
GTEX-14E1K-0326-SM-5S2PE
50-59 years, male
1009.5
GTEX-PX3G-0826-SM-48TZS
20-29 years, female
1005.9
GTEX-UPK5-1426-SM-4JBHH
40-49 years, male
955.6
GTEX-QV44-0326-SM-4R1KD
50-59 years, male
931.3
GTEX-WFON-1726-SM-4LVMQ
40-49 years, male
926.4
GTEX-X3Y1-2726-SM-4PQZH
40-49 years, male
917.3
GTEX-14DAQ-1726-SM-5S2R2
60-69 years, female
916.3
GTEX-ZF29-2026-SM-4WWB7
60-69 years, female
915.9
GTEX-ZZPU-0426-SM-5GZYH
50-59 years, female
901.1
GTEX-13SLX-1226-SM-5S2Q6
50-59 years, female
896.6
GTEX-S4Z8-0526-SM-4AD4T
60-69 years, male
895.3
GTEX-TKQ2-1726-SM-4DXUP
50-59 years, male
894.6
GTEX-RM2N-1926-SM-48FCU
50-59 years, male
894.0
GTEX-13PVR-0126-SM-5S2PY
60-69 years, female
879.8
GTEX-OOBJ-0826-SM-3NB2K
60-69 years, male
866.9
GTEX-139YR-0226-SM-5IFEM
50-59 years, male
855.5
GTEX-139TS-1426-SM-5IFJD
60-69 years, male
850.6
GTEX-ZPU1-0826-SM-57WG2
40-49 years, male
847.5
GTEX-VUSG-0126-SM-4KL1X
50-59 years, male
843.4
GTEX-1212Z-0226-SM-59HLF
60-69 years, male
843.0
GTEX-P78B-1326-SM-3P611
40-49 years, female
842.0
GTEX-ZAB5-0426-SM-5CVMI
50-59 years, male
841.6
GTEX-11EQ9-0526-SM-5A5JZ
30-39 years, male
834.4
GTEX-ZVP2-0626-SM-51MSO
50-59 years, male
818.5
GTEX-Z9EW-0426-SM-5CVM9
40-49 years, male
786.5
GTEX-145MF-0826-SM-5QGQA
50-59 years, male
783.6
GTEX-13FTW-1126-SM-5J2NV
40-49 years, male
776.6
GTEX-XOTO-0826-SM-4B65O
50-59 years, male
767.9
GTEX-U3ZN-0226-SM-3DB8D
30-39 years, female
766.2
GTEX-14753-1626-SM-5NQ9L
60-69 years, male
744.0
GTEX-12WSG-0626-SM-5FQTQ
50-59 years, female
736.0
GTEX-144GM-1326-SM-5LU5E
20-29 years, male
735.6
GTEX-13FLV-0326-SM-5N9DJ
50-59 years, male
732.0
GTEX-13113-1326-SM-5GCOI
60-69 years, female
725.5
GTEX-YEC4-0826-SM-5P9FV
40-49 years, male
708.0
GTEX-132NY-0926-SM-5P9G3
60-69 years, male
706.3
GTEX-12KS4-1326-SM-5LUB3
30-39 years, male
699.9
GTEX-QEL4-1226-SM-447A4
50-59 years, male
691.3
GTEX-131XE-0326-SM-5LZVO
50-59 years, male
691.0
GTEX-S32W-1926-SM-4AD63
50-59 years, female
690.2
GTEX-UPIC-0926-SM-4IHLV
20-29 years, female
676.2
GTEX-REY6-1226-SM-48FDR
60-69 years, male
657.3
GTEX-Y5LM-0426-SM-4VBRO
40-49 years, female
654.0
GTEX-S33H-1626-SM-4AD68
30-39 years, male
633.0
GTEX-X4EP-1026-SM-4QAS5
60-69 years, female
620.5
GTEX-147JS-1126-SM-5RQIW
60-69 years, male
618.1
GTEX-ZYY3-0626-SM-5NQ6W
60-69 years, female
613.3
GTEX-RTLS-1326-SM-46MUN
60-69 years, female
612.9
GTEX-145MO-2326-SM-5NQ9K
60-69 years, male
604.6
GTEX-QESD-2026-SM-447BI
20-29 years, male
604.1
GTEX-14AS3-0126-SM-5Q5F4
40-49 years, female
591.6
GTEX-WQUQ-1926-SM-4OOSA
60-69 years, male
576.4
GTEX-Y5V5-0926-SM-4VBPZ
60-69 years, female
572.4
GTEX-ZYT6-0626-SM-5E45V
30-39 years, male
571.5
GTEX-146FH-1526-SM-5NQBU
50-59 years, female
565.6
GTEX-12WSD-1426-SM-5GCN9
60-69 years, female
559.7
GTEX-139TU-0826-SM-5IJFG
60-69 years, male
548.2
GTEX-12696-0826-SM-5EGGE
60-69 years, male
543.9
GTEX-11WQC-0726-SM-5EQMR
60-69 years, male
542.4
GTEX-1399T-0826-SM-5IFES
60-69 years, male
537.5
GTEX-12WSL-0226-SM-5CVMJ
50-59 years, male
536.5
GTEX-YB5E-0326-SM-5IFHU
40-49 years, male
533.1
GTEX-13NZ9-1326-SM-5MR3V
50-59 years, male
528.7
GTEX-YFC4-1526-SM-5IFJS
40-49 years, female
519.9
GTEX-UTHO-2426-SM-4JBHD
60-69 years, male
516.7
GTEX-14C38-1526-SM-5RQJ7
50-59 years, male
511.7
GTEX-13OW6-2626-SM-5IFF2
50-59 years, male
507.6
GTEX-RU72-1426-SM-46MUF
50-59 years, female
468.4
GTEX-X4XY-1626-SM-46MVN
60-69 years, male
465.7
GTEX-1497J-0726-SM-5Q5D1
60-69 years, male
429.7
GTEX-ZAB4-0826-SM-5LU9D
40-49 years, male
421.8
GTEX-ZVT4-0626-SM-5E45T
50-59 years, female
421.5
GTEX-RWSA-1426-SM-47JXA
40-49 years, male
416.5
GTEX-X4EO-1126-SM-4QARQ
60-69 years, female
414.3
GTEX-147F4-1426-SM-5LUA8
50-59 years, male
399.7
GTEX-11DXY-0526-SM-5EGGQ
60-69 years, male
391.9
GTEX-X261-1726-SM-4PQYT
50-59 years, male
380.0
GTEX-QEG4-1826-SM-4R1JN
30-39 years, male
378.8
GTEX-XBEC-1526-SM-4AT68
50-59 years, male
366.9
GTEX-RN64-1826-SM-48FDV
50-59 years, male
364.0
GTEX-14A5I-1726-SM-5QGQ5
50-59 years, female
357.5
GTEX-SJXC-1226-SM-4DM78
60-69 years, male
357.5
GTEX-YECK-1926-SM-4W21H
60-69 years, male
354.3
GTEX-11ZVC-0726-SM-5FQT9
50-59 years, female
353.6
GTEX-11GSP-0626-SM-5986T
60-69 years, female
352.0
GTEX-ZVT3-1626-SM-5GU66
60-69 years, female
346.1
GTEX-13QJC-0726-SM-5RQJK
60-69 years, female
345.1
GTEX-11OF3-0726-SM-5BC4Z
60-69 years, male
343.8
GTEX-13N2G-0926-SM-5IFGJ
60-69 years, male
340.5
GTEX-1269C-0626-SM-5FQSS
60-69 years, female
332.3
GTEX-13NZB-0626-SM-5IFH6
30-39 years, male
328.7
GTEX-11ZTS-1426-SM-5EQMM
60-69 years, female
326.0
GTEX-12WSM-0726-SM-5GCOW
60-69 years, male
325.4
GTEX-11NV4-1326-SM-5HL6V
60-69 years, male
310.3
GTEX-131YS-1626-SM-5HL6C
60-69 years, female
309.6
GTEX-11NUK-1226-SM-5P9GM
50-59 years, male
303.8
GTEX-T6MN-1226-SM-3NMA5
50-59 years, male
297.1
GTEX-13VXU-0926-SM-5IFFH
50-59 years, male
296.3
GTEX-Q2AG-1126-SM-48U1P
40-49 years, female
290.1
GTEX-145LU-1326-SM-5LU9N
50-59 years, male
285.2
GTEX-13NYB-1026-SM-5IFH3
40-49 years, male
285.1
GTEX-13O3O-1826-SM-5IFGW
60-69 years, female
272.8
GTEX-RNOR-1426-SM-48FDJ
50-59 years, female
272.3
GTEX-12WSI-0226-SM-5GCNA
50-59 years, male
259.8
GTEX-131XH-0626-SM-5LZWH
50-59 years, male
258.3
GTEX-WZTO-0626-SM-4PQYY
40-49 years, male
243.3
GTEX-13FTZ-0726-SM-5IFFY
60-69 years, male
226.7
GTEX-13112-1426-SM-5EGH8
50-59 years, male
216.2
GTEX-11ZUS-2526-SM-59872
30-39 years, male
195.5
GTEX-12ZZZ-1326-SM-59HKW
60-69 years, male
66.7
Show all
LIVER - FANTOM5 CAGEi
Tissue data obtained through Cap Analysis of Gene Expression (CAGE) are reported as Tags Per Million, generated by the FANTOM5 project. More information can be found here.
 The Human Protein Atlas project is funded


 MENU
MENU


 Female, age 60