We use cookies to enhance the usability of our website. If you continue, we'll assume that you are happy to receive all cookies. More information. Don't show this again.
The protein expression bar, with the units not detected (n), low (l), medium (m) and high (h), is based on a best estimate of the true protein expression for proteins where the antibody staining pattern has been analyzed by knowledge-based annotation. For genes where more than one antibody has been used, a collective score is set. For details, see Assays & annotation.
h
m
l
n
RNA expressioni
RNA expression shows average values based on RNA-seq data generated by HPA, the Genotype-Tissue Expression (GTEx) consortium or the FANTOM5 consortium.
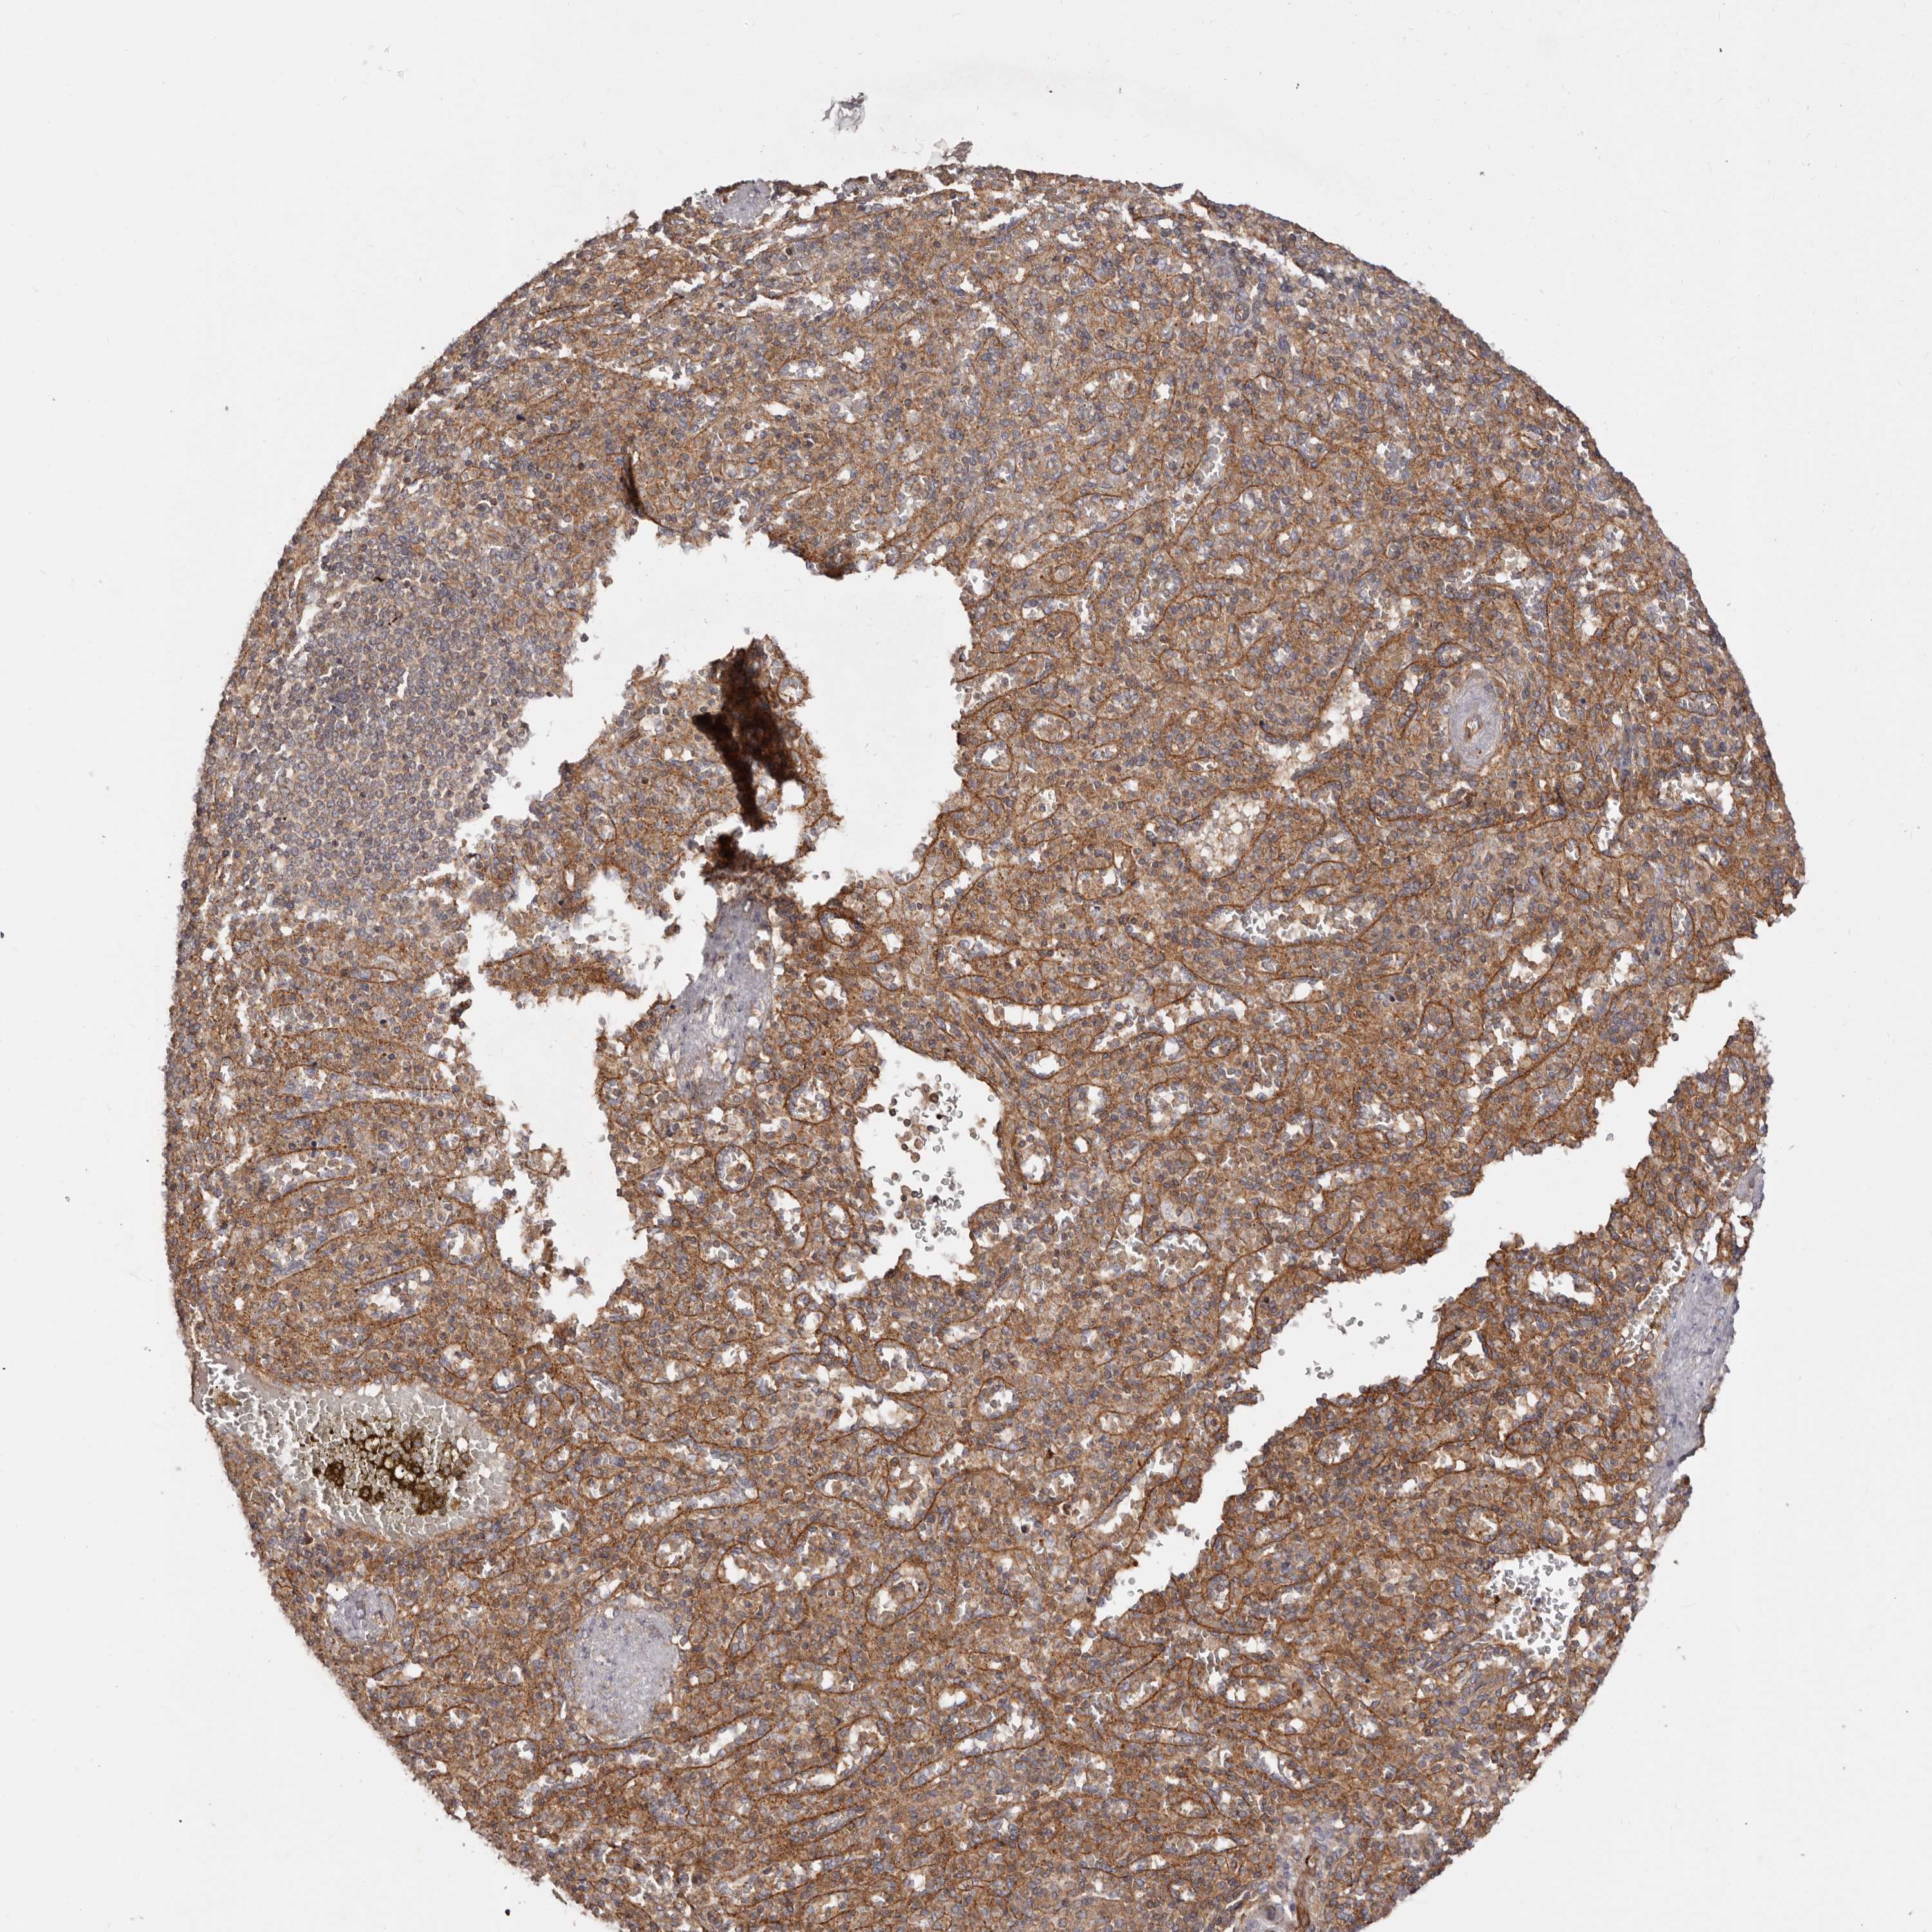
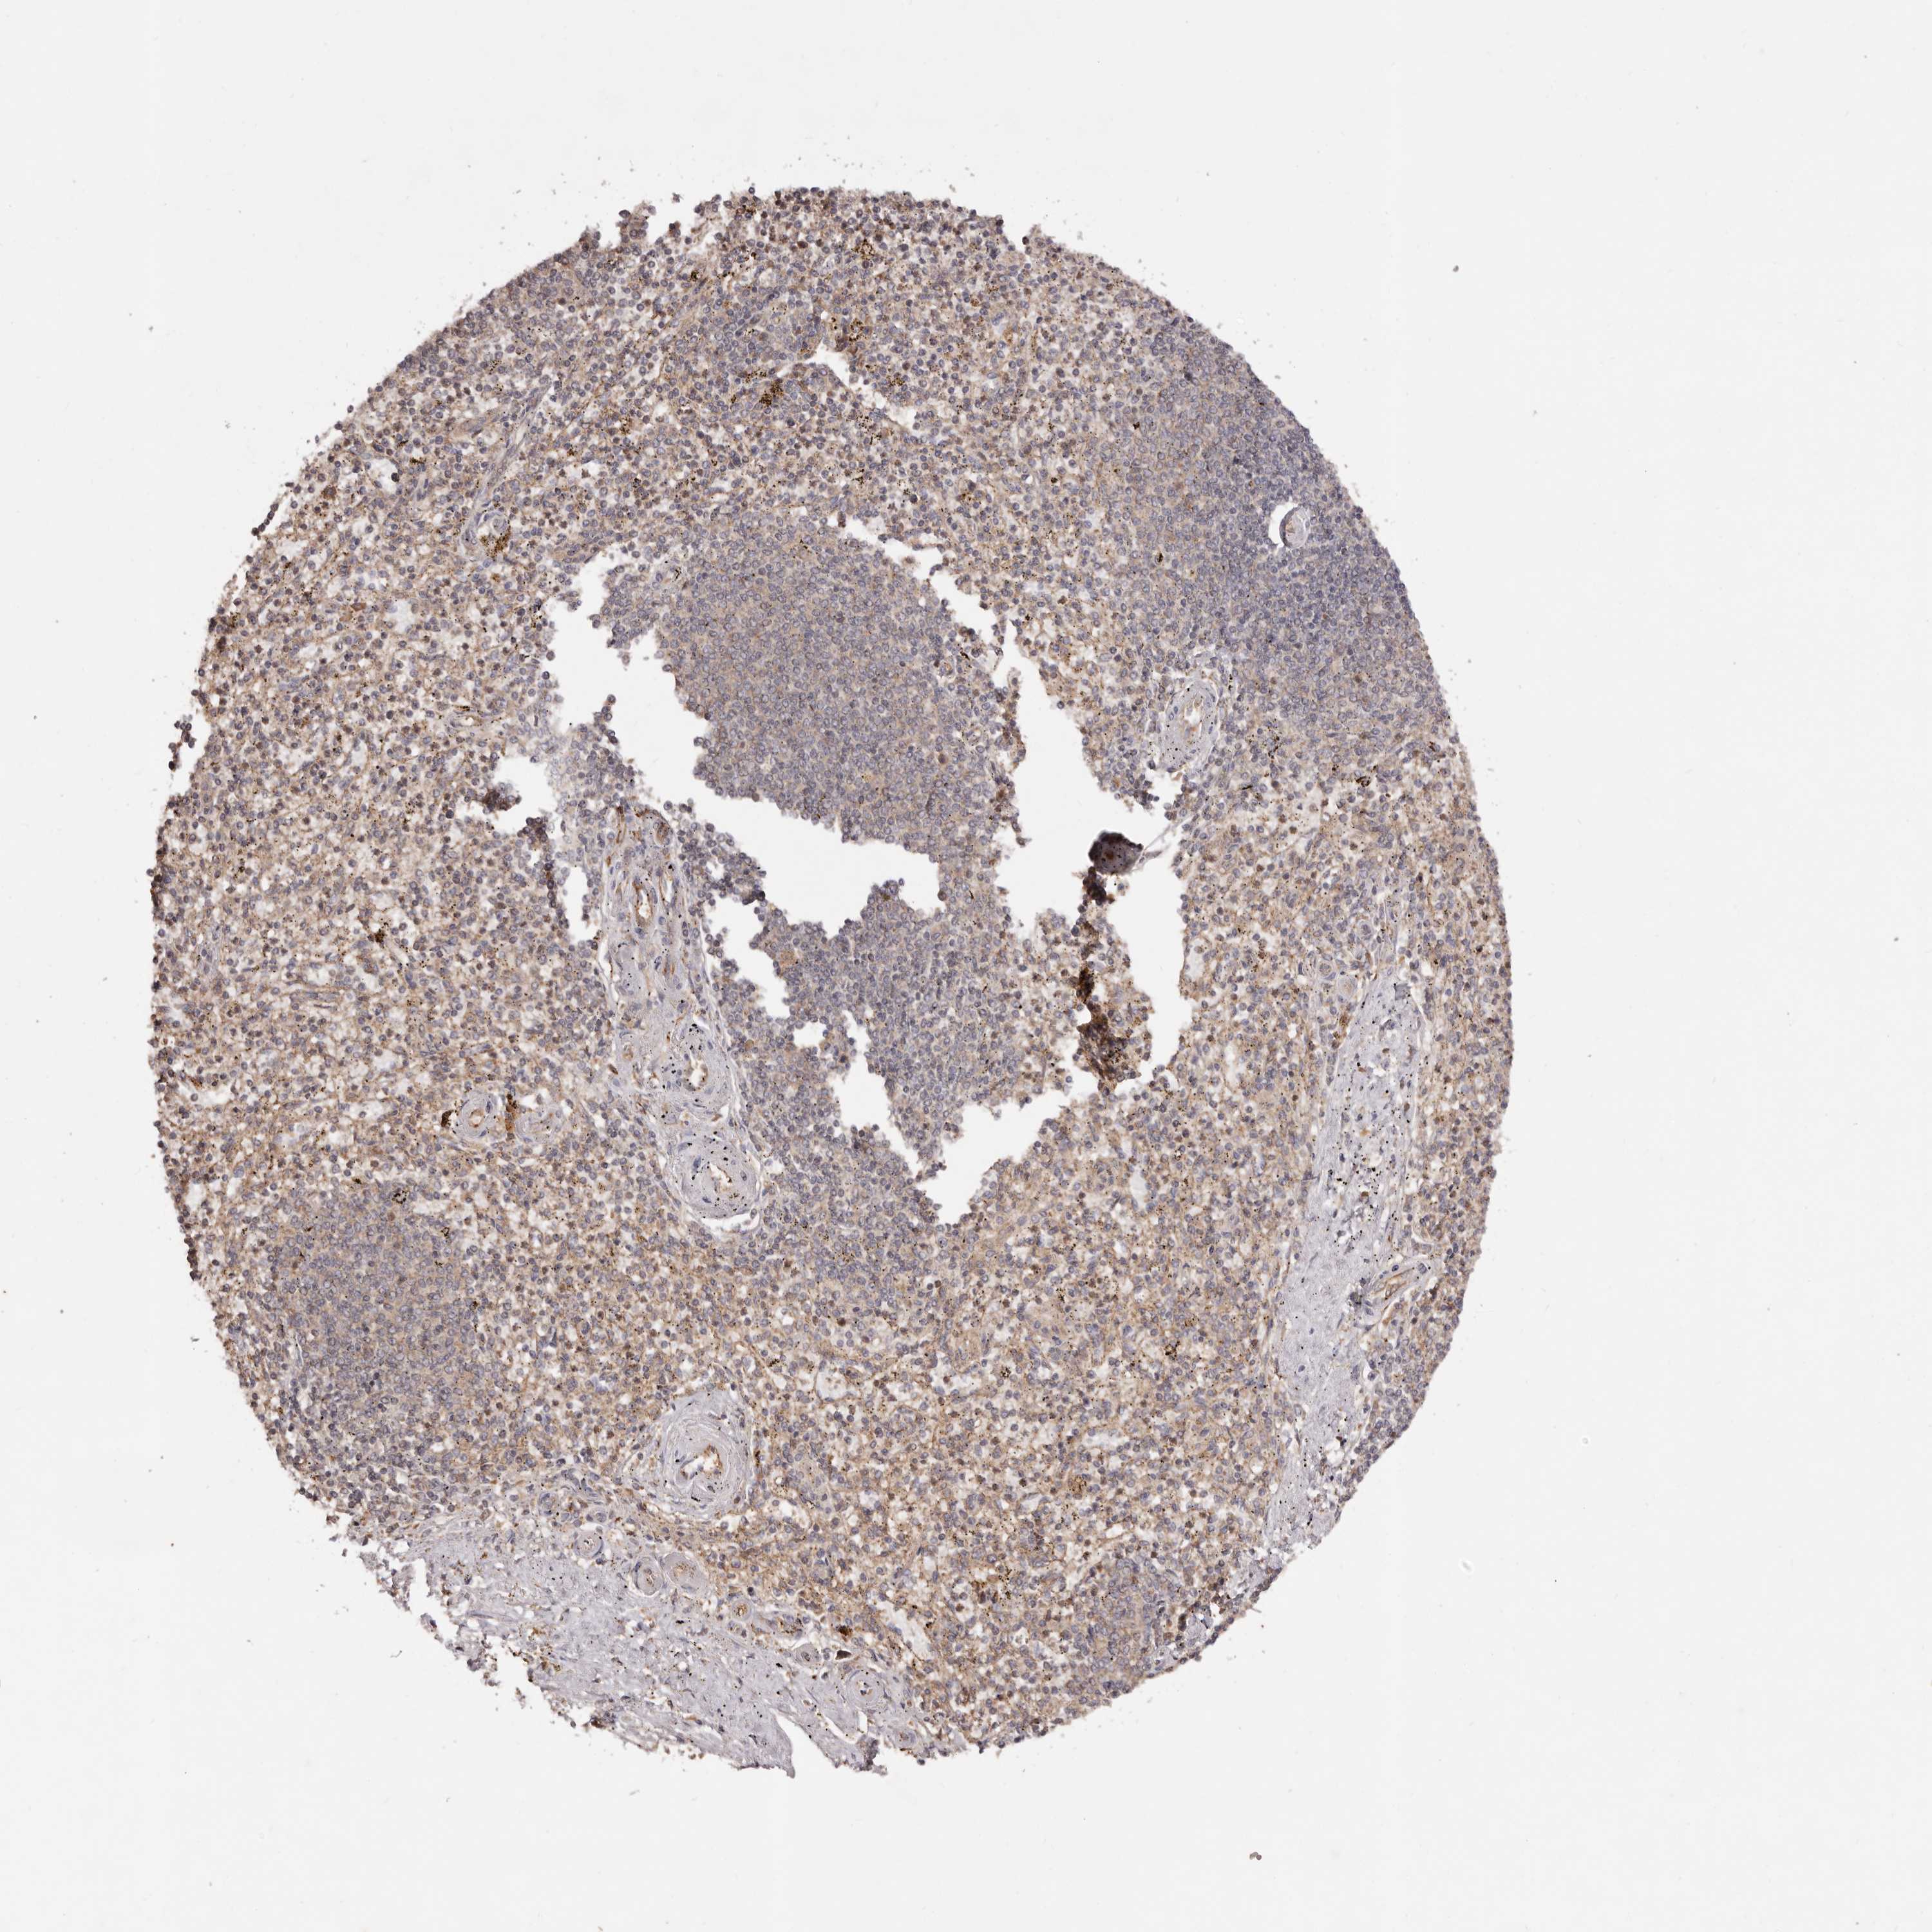
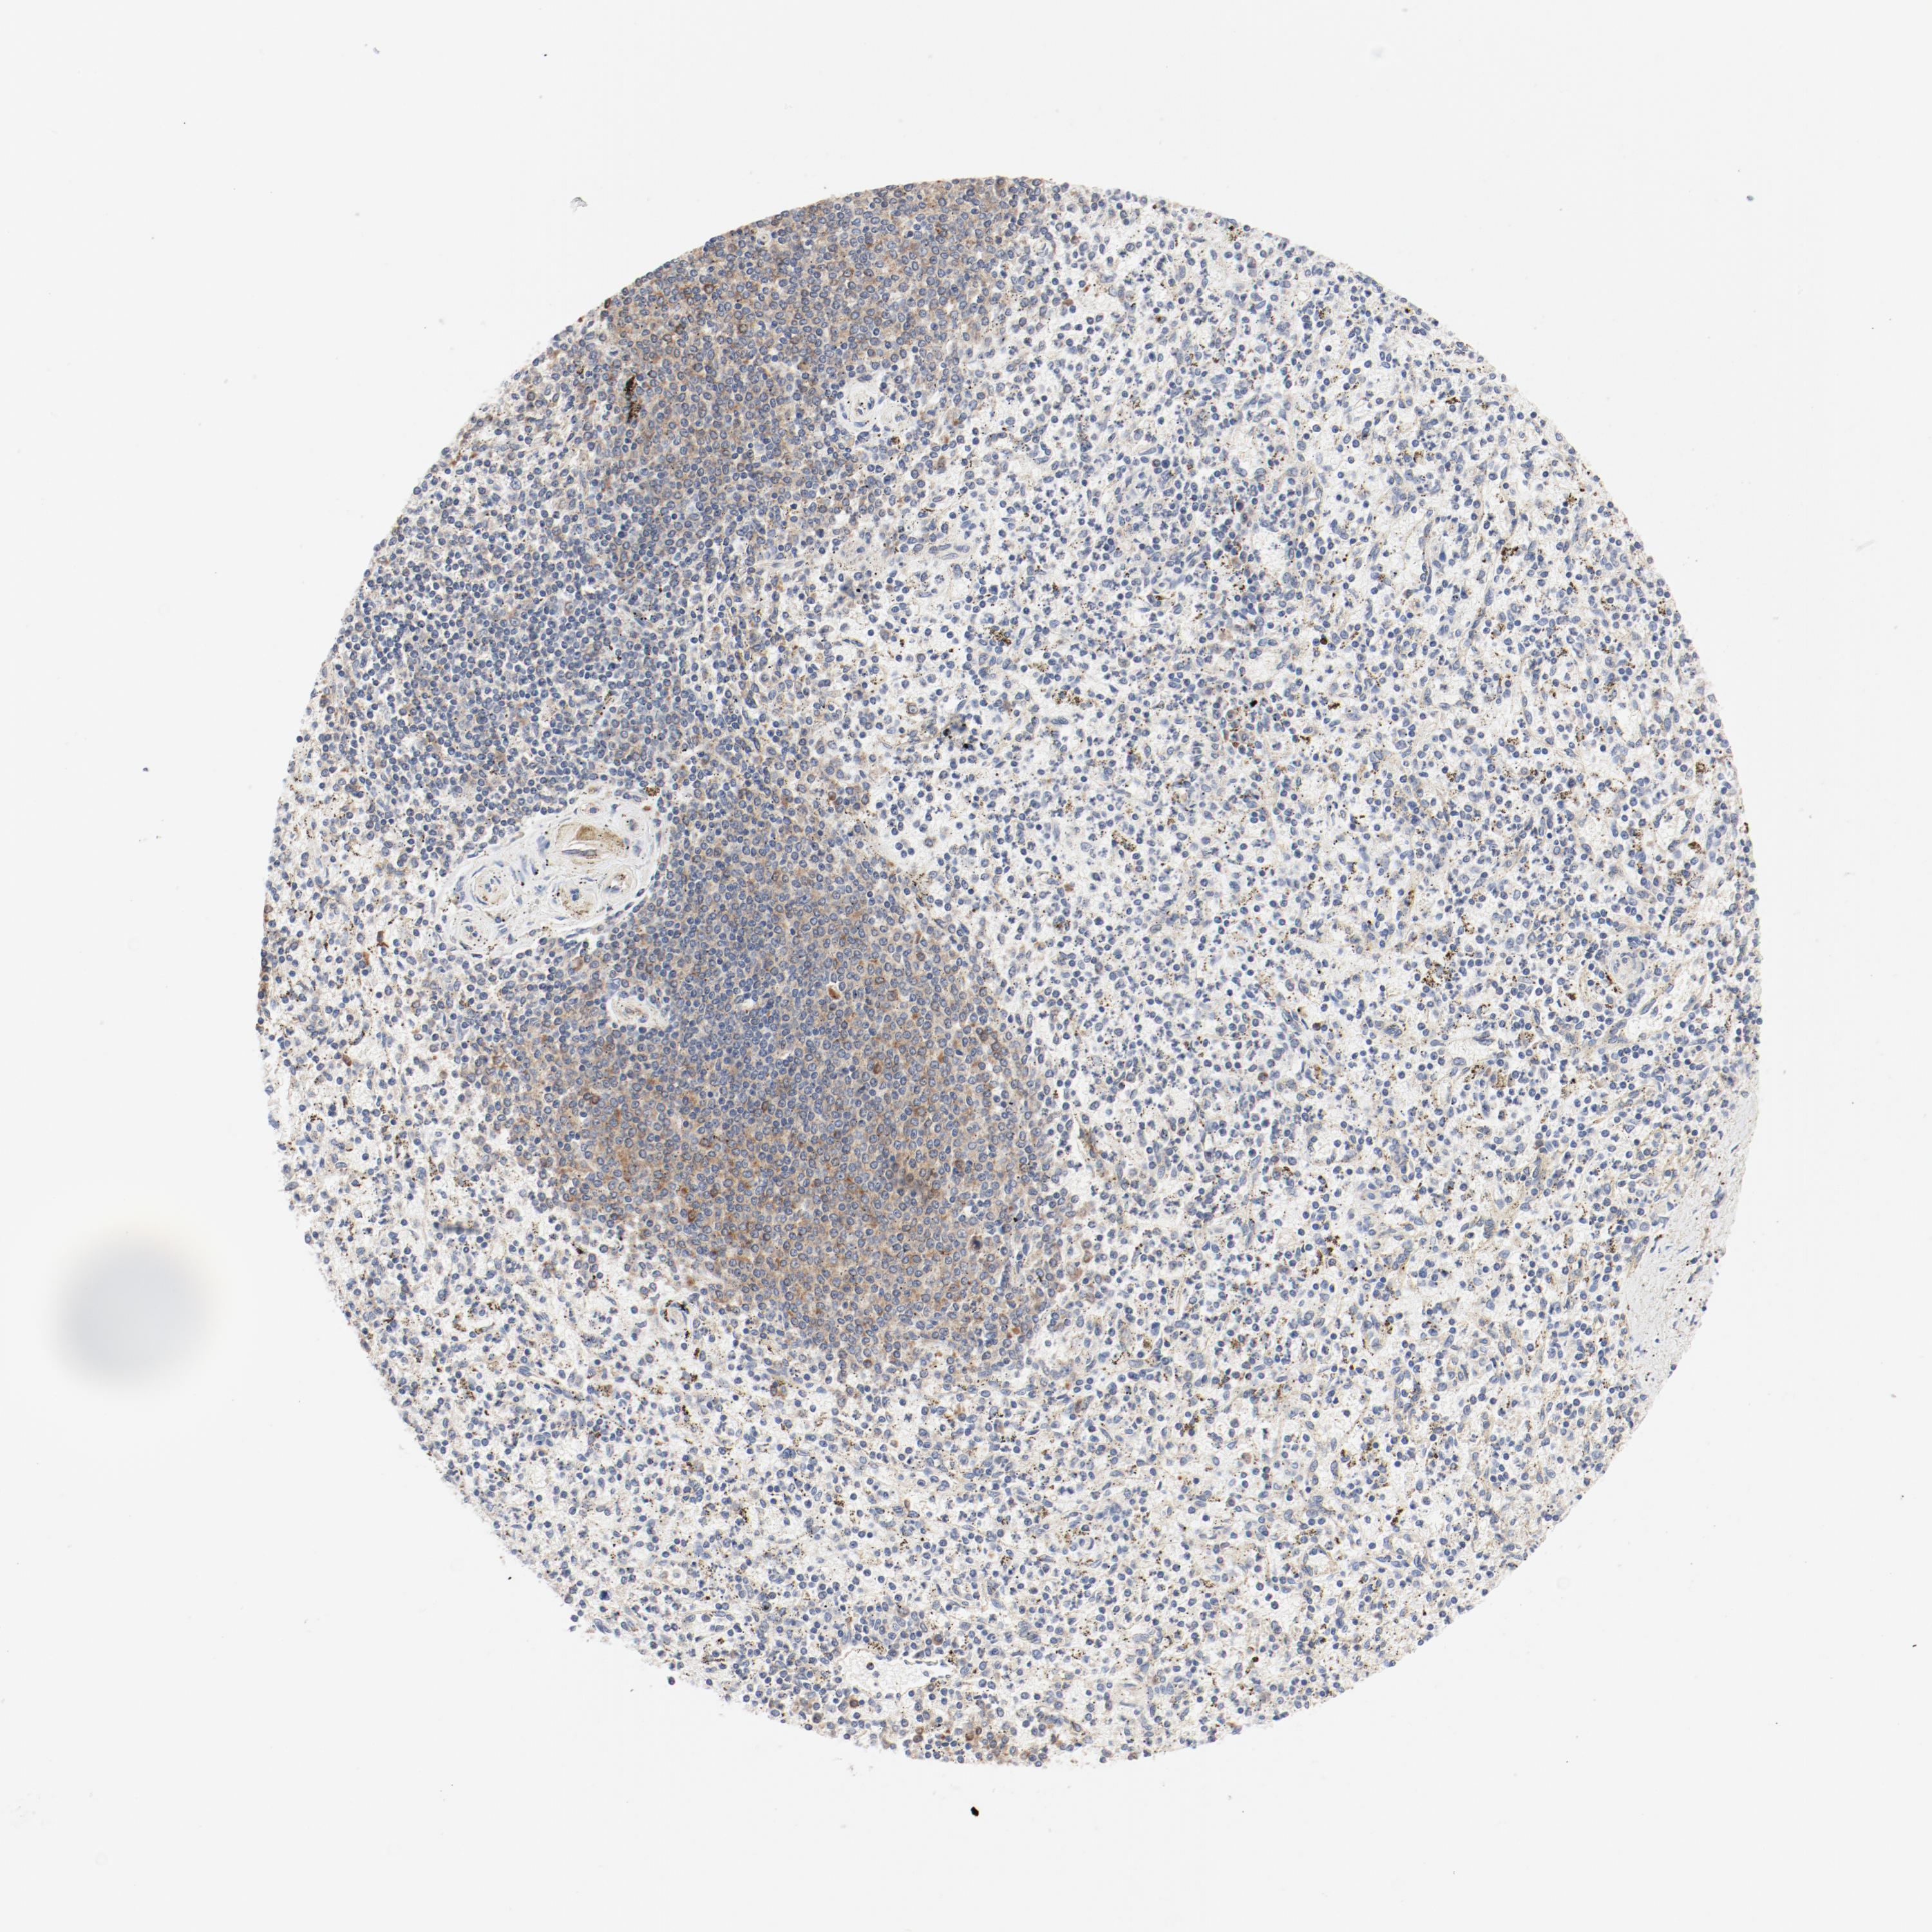
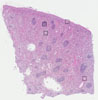
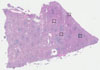
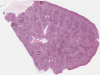
The detailed normal tissue page shows images of the stained tissue, together with antibody staining and expression level of the cell types. A knowledge-based annotated protein expression is provided for each cell type at the top of the page and the staining level of the individual antibodies is given underneath each antibody ID.
Samples from up to three different individuals have been stained for each antibody. The gender, age and tissue characterization are reported for each individual (patient) and are viewable when clicking on the image for magnification.
The images can be clicked for an enlarged view that can be panned. From the enlarged view, all stained images for all antibodies can be browsed (represented by miniature images). The miniature image with an orange overlay is the currently displayed image.
This score describes the level of antibody staining observed in the annotated cell types as not detected, low, medium, or high. It is based on the staining intensity and fraction of stained cells.
The RNA-seq details section shows detailed information about the individual samples used for the transcript profiling and results of the RNA-seq analysis.
Information about each individual sample is listed below, including gender, age, a tissue section image and estimated fractions of cell types. TPM (transcripts per million) values give a quantification of the gene abundance which is comparable between different genes and samples.
RNA-Seq data is reported as average RPKM (reads per kilobase per million mapped reads), generated by the Genotype-Tissue Expression (GTEx) project. More information can be found on the GTEx portal.
Normal distribution across the dataset is visualized with box plots, shown as median and 25th and 75th percentiles. Points are displayed as outliers if they are above or below 1.5 times the interquartile range. RPKM values of the individual samples are presented next to the box plot.
Max RPKM: 895.7
Min RPKM: 337.2
Std RPKM: 117.1
Median RPKM: 572.3
GTEX-13X6H-0726-SM-5Q5BX
50-59 years, female
895.7
GTEX-146FR-1926-SM-5NQA6
60-69 years, female
851.0
GTEX-13FH7-1326-SM-5IFG8
50-59 years, female
843.0
GTEX-Y5LM-0326-SM-4VBRN
40-49 years, female
833.9
GTEX-XMK1-0126-SM-4B65F
40-49 years, male
832.1
GTEX-ZYWO-0226-SM-5GZX3
40-49 years, female
818.1
GTEX-11XUK-0426-SM-5EQML
40-49 years, female
799.4
GTEX-XGQ4-0126-SM-4AT4H
50-59 years, male
768.7
GTEX-ZYFG-0726-SM-5GIDX
60-69 years, female
745.1
GTEX-14DAR-0326-SM-5S2PS
50-59 years, male
741.3
GTEX-XUJ4-0226-SM-4BOP8
60-69 years, female
740.5
GTEX-14E6E-1226-SM-5S2R5
30-39 years, male
738.0
GTEX-Q2AH-0226-SM-48U1I
40-49 years, male
718.4
GTEX-144GN-2126-SM-5O99D
50-59 years, male
715.6
GTEX-147F3-0126-SM-5NQBJ
50-59 years, female
714.4
GTEX-13PVR-0326-SM-5RQJY
60-69 years, female
707.9
GTEX-13N11-0126-SM-5KM2Z
50-59 years, female
703.2
GTEX-R55G-0226-SM-48FEI
40-49 years, female
701.6
GTEX-QDVN-0526-SM-48TZ4
50-59 years, male
700.2
GTEX-12WSK-0126-SM-5GCO7
40-49 years, female
695.5
GTEX-O5YT-0926-SM-48TDG
20-29 years, male
695.0
GTEX-RUSQ-0126-SM-47JWV
50-59 years, male
683.8
GTEX-QCQG-0226-SM-48U28
50-59 years, female
675.2
GTEX-13CF3-0226-SM-5J1NW
60-69 years, female
673.6
GTEX-11NSD-0426-SM-5N9CR
20-29 years, male
671.4
GTEX-11P81-1326-SM-5GU5S
30-39 years, female
670.9
GTEX-U4B1-0526-SM-4DXTK
40-49 years, male
665.8
GTEX-U3ZH-0126-SM-4DXUK
30-39 years, male
663.6
GTEX-12BJ1-0726-SM-5EGGF
60-69 years, male
649.5
GTEX-T5JW-0126-SM-4DM6K
20-29 years, female
648.8
GTEX-XXEK-0126-SM-4BRVU
50-59 years, male
633.6
GTEX-11DXX-0726-SM-5H12X
60-69 years, female
633.1
GTEX-139T6-0226-SM-5IFGZ
50-59 years, male
633.0
GTEX-YEC4-0126-SM-4W21T
40-49 years, male
630.4
GTEX-QV31-0126-SM-447BP
30-39 years, male
626.2
GTEX-13U4I-1626-SM-5IFFR
40-49 years, female
620.3
GTEX-ZP4G-0326-SM-4YCEF
20-29 years, female
620.1
GTEX-X4LF-0226-SM-4QAS8
50-59 years, male
616.6
GTEX-XQ8I-1726-SM-4BOQB
50-59 years, male
613.0
GTEX-OIZH-0926-SM-48TBR
50-59 years, male
611.8
GTEX-WHWD-0126-SM-4OORS
50-59 years, male
607.3
GTEX-132QS-0226-SM-5IFFZ
60-69 years, male
606.3
GTEX-1399S-0226-SM-5IFFG
30-39 years, female
596.7
GTEX-X585-1826-SM-4QAS3
50-59 years, male
592.8
GTEX-11VI4-0126-SM-5GU6Z
40-49 years, female
591.5
GTEX-131XE-1126-SM-5EGHW
50-59 years, male
586.8
GTEX-OOBJ-0926-SM-48TDO
60-69 years, male
586.6
GTEX-146FQ-0626-SM-5LU9U
30-39 years, male
584.5
GTEX-ZLWG-0426-SM-4WWFA
50-59 years, female
584.1
GTEX-ZVP2-0526-SM-51MSC
50-59 years, male
580.1
GTEX-Y8LW-0126-SM-4VBS1
50-59 years, female
575.8
GTEX-12WSG-0926-SM-5EGIH
50-59 years, female
575.0
GTEX-XAJ8-0126-SM-47JYG
40-49 years, male
569.6
GTEX-13PL7-1126-SM-5MR5O
60-69 years, female
568.9
GTEX-1399R-0226-SM-5IJGG
30-39 years, male
568.3
GTEX-ZV6S-0826-SM-5NQ6Z
40-49 years, female
564.0
GTEX-ZZPU-0126-SM-5E446
50-59 years, female
561.8
GTEX-12WSN-0126-SM-5DUX5
40-49 years, male
561.3
GTEX-Y3I4-0126-SM-4TT26
50-59 years, male
561.0
GTEX-12WSJ-0526-SM-5GCOZ
40-49 years, female
559.6
GTEX-ZLFU-0526-SM-4WWBN
40-49 years, male
553.4
GTEX-ZVZP-0726-SM-59HKA
50-59 years, male
540.3
GTEX-1211K-0426-SM-5FQTP
60-69 years, female
534.6
GTEX-QLQW-0126-SM-447BK
30-39 years, male
533.2
GTEX-W5WG-0626-SM-4SOID
50-59 years, female
532.4
GTEX-S4Z8-0226-SM-4AD5K
60-69 years, male
530.4
GTEX-VJYA-0126-SM-4KL1P
60-69 years, male
527.7
GTEX-U3ZN-0126-SM-4DXUM
30-39 years, female
519.1
GTEX-S3XE-0626-SM-4AD6B
50-59 years, male
517.1
GTEX-Z9EW-0726-SM-5HL9H
40-49 years, male
503.6
GTEX-131XG-0426-SM-5IFGD
50-59 years, female
503.1
GTEX-XV7Q-0126-SM-4BRVK
40-49 years, female
503.1
GTEX-11LCK-0126-SM-5A5M5
30-39 years, male
502.4
GTEX-Y114-0726-SM-4TT6U
50-59 years, female
499.4
GTEX-QMRM-0226-SM-4R1K7
50-59 years, male
498.5
GTEX-PX3G-0926-SM-48U12
20-29 years, female
497.9
GTEX-ZAB5-0526-SM-5CVMU
50-59 years, male
497.1
GTEX-WFON-0126-SM-4LVM9
40-49 years, male
492.7
GTEX-X3Y1-0126-SM-4PQZA
40-49 years, male
490.5
GTEX-ZDTT-1026-SM-5KM19
60-69 years, male
487.6
GTEX-145MN-0126-SM-5RQHY
30-39 years, male
485.1
GTEX-Y3IK-0126-SM-4WWE9
50-59 years, female
482.7
GTEX-XPVG-0626-SM-4B65B
50-59 years, male
481.8
GTEX-P4PP-0926-SM-48TBZ
30-39 years, female
481.0
GTEX-139YR-0426-SM-5IFFV
50-59 years, male
475.7
GTEX-13111-0126-SM-5EGHO
50-59 years, male
474.7
GTEX-117YX-2126-SM-5GIEL
50-59 years, male
474.1
GTEX-POMQ-0126-SM-48TD6
20-29 years, female
467.9
GTEX-YFCO-0926-SM-5LUA5
40-49 years, male
458.8
GTEX-YB5K-1926-SM-4VDT4
40-49 years, female
456.2
GTEX-1122O-0526-SM-5N9DM
60-69 years, female
454.9
GTEX-QV44-0126-SM-4R1KH
50-59 years, male
453.1
GTEX-11EQ9-0426-SM-5A5JY
30-39 years, male
448.7
GTEX-13VXT-1326-SM-5LU3Y
20-29 years, female
447.0
GTEX-11P7K-0426-SM-5BC5H
30-39 years, male
446.2
GTEX-UPK5-1626-SM-4JBHI
40-49 years, male
440.4
GTEX-P4QS-0926-SM-48TBS
60-69 years, male
425.4
GTEX-UJHI-0126-SM-4IHLP
50-59 years, female
424.4
GTEX-ZPU1-1026-SM-4YCEQ
40-49 years, male
419.1
GTEX-YB5E-0426-SM-5IFHR
40-49 years, male
417.0
GTEX-13S86-0126-SM-5S2PI
40-49 years, male
414.7
GTEX-PLZ6-0126-SM-48TC6
30-39 years, male
404.9
GTEX-Q734-0226-SM-48U1A
40-49 years, female
363.0
GTEX-PW2O-0126-SM-48TC8
20-29 years, male
337.2
Show all
SPLEEN - FANTOM5 CAGEi
Tissue data obtained through Cap Analysis of Gene Expression (CAGE) are reported as Tags Per Million, generated by the FANTOM5 project. More information can be found here.
 The Human Protein Atlas project is funded


 MENU
MENU